ABSTRACT
RESUMO
Received on September 13th, 2014 and accepted on May 24th, 2017.
1 Universidade Federal de Santa Maria, Departamento de Solos, Santa Maria, Rio Grande do Sul, Brazil. [email protected]; [email protected]; [email protected];
[email protected]; [email protected]
2 Universidade Nacional de Assuncão, Assuncão, San Lorenzo, Paraguay. [email protected]
*Corresponding author: [email protected]
Yield and nutritional efficiency of corn in response to rates
and splits of nitrogen fertilization
Despite its relevance, nitrogen is poorly utilized by the plants when improperly applied. Thus, the objective of this study was to evaluate the yield and nitrogen use efficiency (NUE) in corn in response to doses and split application of nitrogen fertilization. The experimental design was a randomized block design, with three replications. Doses of nitrogen of 0, 30, 60 and 180 kg ha-1 were applied at sowing in order to create different nutritional status of corn plants and to
obtain different values of Normalized Difference Vegetation Index (NDVI) measured with “Greenseeker®” optical sensor.
The subplots with nitrogen doses in topdressing of 0, 30, 60 and 90 kg ha-1 at V8 and a dose of 60 kg ha-1 at V12 were
placed in experimental plots with doses of 0, 30, 60 and 180 kg ha-1 of nitrogen at sowing. Moreover, NUE was calculated
in the experiment using agronomic indexes determined by applications of nitrogen in late topdressing (V8 and V12) and contrasted to the possible combinations at doses of 60, 90 and 120 kg ha-1 of total N applied. The results showed the
occurrence of a linear relationship between nitrogen fertilizer dose and NDVI at V8 as well as at V12 stages. Late topdressing fertilizations (V12) did not cause a decrease in grain yield when combined with nitrogen fertilization at sowing, moreover resulted in higher NUE. Split the nitrogen dose showed better NUE than the combinations where nitrogen was not applied at sowing or in topdressing. The delay of nitrogen topdressing can be an alternative for the planning of the moment of the N fertilization according to the climate forecast in each region.
Key words: GreenSeeker®;nitrogen; optical sensing; Zea mays L.
Telmo Jorge Carneiro Amado1, Enrique Oswin Hahn Villalba1, Rafael Pivotto Bortolotto1*, Douglas Dalla Nora1,
Jardes Bragagnolo1, Enrique Asterio Benítez León2
10.1590/0034-737X201764040003
Produtividade e eficiência nutricional do milho em resposta a doses e parcelamentos da
adubação nitrogenada
Apesar de sua relevância, o nitrogênio apresenta reduzido aproveitamento pela planta quando aplicado de forma inadequada. Assim, objetivou-se avaliar a produtividade e a eficiência do uso de nitrogênio (EUN) no milho em resposta a doses e parcelamentos da adubação nitrogenada. O delineamento experimental utilizado foi de blocos ao acaso, com três repetições. Foram aplicadas doses de 0, 30, 60 e 180 kg ha-1 de nitrogênio em semeadura visando criar diferentes
condições nutricionais das plantas de milho e assim obter diferentes níveis de Índice de Vegetação por Diferença Normalizada (NDVI) medidos com sensor óptico “GreenSeeker®”. As subparcelas com doses de nitrogênio em cobertura
de 0, 30, 60 e 90 kg ha-1 em V8 e uma dose de 60 kg ha-1 em V12 foram alocadas experimentalmente nas parcelas com doses
de 0, 30, 60 e 180 kg ha-1 de nitrogênio em semeadura. Além disso, foi calculado no experimento a EUN através de índices
INTRODUCTION
The most evident economic and environmental benefits related to nitrogen fertilization are linked to the application of average doses ranging from 40 to 60 kg ha-1
(Amado et al., 2006; Gross et al., 2006; Gomes et al., 2007).
The split and season of application of the nitrogen fertilizer are alternatives to increase the efficiency of the corn crop yield and to mitigate losses of this nutrient. This is attained by better nitrogen (N) utilization due to the synchronization between the applications and the period of greater demand of the nutrient by the plant (Silva et al., 2005b; Bragagnolo et al., 2013).
Understanding the effects imposed by the late application of N in corn is fundamental to improve the fertilization recommendations of this nutrient, since the effectiveness of this application strategy in corn is strongly dependent on the degree of deficiency of the element at the moment of topdressing fertilization (Binder et al. 2000).
In this context, it is important to evaluate the agronomic indices that measure the N use efficiency (NUE) in each region, searching for better N management practices and with that, to meet the grain demand through the balance between inputs and outputs of the applied nutrients (Dobermann, 2007; Snider & Bruselma, 2007; Portz et al.,
2012). Scharf et al. (2002) reported that late N fertilization
(V11 to V16) did not result in yield losses for corn, but they found additions in the NUE and consequently some savings in fertilization associated with lower environmental damages.
In Brazil, it was found recovery rates of N varying among values by 30% (Lara-Cabezas et al., 2000), and
between 44 and 55% of applied N (Silva et al., 2005a). In
relation to the topdressing application of N, the fertilization split may or may not result in gains in productivity, which is mainly related to the water availability after fertilization, which allows a high recovery of applied N (Sangoi & Almeida, 1994). Hence, the use of optical sensors is a new technology targging at a better NUE in split fertilizations. Raun et al. (2002) demonstrated that canopy evaluations
using GreenSeeker® active optical sensor (NTech
Industries, Ukiah, CA) could be done to evaluate the effect
of varying doses of N in topdressing on grasses, resulting in improvements in NUE.
Blackmer et al. (1996) and Raun et al. (2005)
demonstrated a good relationship between N nutrition in crop growth and the Normalized Difference Vegetation Index (NDVI) obtained by the optical sensor. Teal et al. (2006)
pointed out a good prediction of grain yield with NDVI readings for adjustment of late N doses. Martin et al. (2007)
verified high correlations between the accumulated biomass and the vegetation index in chronologically superior vegetative development stages (V8 and V12).
The factors considered in the optimization of the use of N such as the correct dose and the correct application time should be evaluated and investigated at a regional level in order to reduce losses and to obtain better practices for the use of fertilizers (Fixen, 2010). The objective of this study was to evaluate the productivity and the NUE in corn crops in response to doses and splits of the nitrogen fertilization.
MATERIAL AND METHODS
The study was conducted in southern Paraguay in one of the country’s most important agricultural regions. The climate is classified as Cfa, according to Köppen, with hot summers and occasional frost in the winter. The average annual rainfall ranges from 1300 to 1900 mm, with rainfall evenly distributed over the year. The average temperature varies from 17 to 27oC for the months of July and January,
respectively.
The experiment was composed of seasons and varying doses of N applied to the corn crop during the 2010/2011 crop year in the municipality of Alto Verá, Department of Itapúa in Paraguay, in the commercial area of a producer of cooperative Colônias Unidas. During the corn crop cycle, an accumulate precipitation of 852.5 mm was recorded in the experiment (Figure 1).
The soil in the experimental area is classified as Red Latosol with loam-clay texture. Table 1 shows the granulometric and chemical characteristics of the soil, determined at the experiment implementation according to procedures described by Tedesco et al. (1995).
linear entre dose de adubo nitrogenado e o NDVI, tanto no estádio V8, como em V12. As adubações em cobertura tardia (V12) não provocaram decréscimo na produtividade de grãos quando combinadas com as doses de nitrogênio na semeadura, inclusive apresentaram uma maior EUN. O parcelamento das doses de nitrogênio demonstrou melhores EUN que as combinações onde o nitrogênio não foi aplicado em semeadura ou cobertura. O atraso das coberturas nitrogenadas pode ser uma alternativa para o planejamento do momento da fertilização com N de acordo com a previsão climática em cada região.
The experimental design was a randomized block design, with three replications. At the sowing, the following treatments were applied: 0, 30, 60 and 180 kg ha-1 of N
applied by broadcasting in the form of urea. The dimensions of the experimental plots were 10x5 m. On the main plots, the sub-plots with dimensions of 2x5 m with 0.5 m of border were delimited. They received five different doses of N in topdressing at V8 phenological stage and only one dose at V12 phenological stage. Soybean was sown with 12.0 m -1 seeds (inoculated with Bradyrhizobium japonicum) with
0.50 m of spacing between rows. In these subplots, four doses of N (0, 30, 60 and 90 kg ha-1, in the form of urea)
were applied at the V8 stage when the eighth leaf of the main stem was emitted, and the fifth treatment consisted of application by broadcasting of 60 kg ha-1 of N in the
form of urea in topdressing at stage V12 (80% of vegetative development).
The different doses of N at sowing and the insertion of subplots with doses of N in topdressing were applied in order to simulate several conditions of N supply conditions for corn plants, resulting in different levels of NDVI, accumulated biomass in the aerial part, absorbed N and grain yield to determine the efficiency of use of N applied in late topdressing (V8 and V12) in the experiment.
Table 2 describes the general characteristics of the accomplished evaluations. The fertilizations of K2O and P2O5 were carried out at the same doses for all plots.
Vegetation index was measured using Greenseeker®
active optical sensor, which provides two measurements from the reflectance of two wavelengths related to the vegetation cover dynamics, resulting in NDVI, as represented in equation (1), proposed By Rouse et al.
(1973):
NDVI = (ρ nir - ρ r) / (ρ nir + ρ r) (1)
Where: ρnir and ρr are the reflectance in the near and visible infrared, respectively for quantifying vegetation growth and it numerically ranges from -1 to +1.
NDVI readings were performed on linear displacement over the experimental unit with the useful width captured by the 0.7 m sensor. The data were collected dynamically at a distance of 0.60 m between the sensor and the target. The equipment was adjusted to a per second reading, totaling approximately 30 measured points in each of the formed subplots and, subsequently, the average was determined for only one value of NDVI in each of the subplot of the experiment. NDVI readings were performed in each subplot at two different times, at V8 and V12 stages to generate
Figure 1: Daily and accumulated precipitations that occurred in the experiments during the corn crop cycle in the 2010/11 harvest.
Table 1: Early fertility characterization of two soil depths in the experiment, 2010/2011
Depth Clay1 SOM2 pH (H
2O) P
3 K3 Ca4 Mg4 Al4 CTC5
m g kg -1 mg dm-3 m mol c dm
-3
0-0.10 441.0 33.0 5.7 6.1 1,2 45,4 13,2 0,0 99,0
0-0.20 449.0 32.0 5.3 5.5 1,1 43,6 12,6 0,2 112,0
1Clay determined by densimetry, 2Soil organic matter determined by Walkley-Black’s method, 3Phosphorus and potassium determined after
response curves, and so check corn response to N rates applied at sowing and previously application of N at late topdressing.
Corn grain yield was evaluated by manually collecting the four central rows of each plot, discarding the rows at the ends, making a total area of 4 m2, after which the grain
mass was corrected to 14% moisture.
With the data on productivity, biomass and absorbed N obtained for each subplot of the experiment, the calculations of the agronomic indices were carried out, adapting the methodology proposed by Snyder & Bruuselma (2007) and Dobermann (2007). Absorbed N was calculated from the concentration of N in the plant tissue and the produced dry mass. According to the applied dose of N (sowing + topdressing), the following indices of each subplot were calculated: Agronomic efficiency of nitrogen use (NAE - kg increase in crop yield/kg of applied nutrient); apparent recovery efficiency of N (NRE - kg increase in absorbed nutrient/kg of applied nutrient); N physiological efficiency (NPE - kg increase of crop yield/kg increase of absorbed nutrient); partial factor productivity (PFP - kg of grain yield/kg of nutrient input); partial nutrient balance (PNB - kg nutrient removed / kg of applied nutrient), presented in equations (2), (3), (4), (5) and (6), respectively.
NAE = (YN - Y0) / XN (2)
NRE = (AXN - AX0) / XN (3)
NPE = (YN - Y0) / AXN - AX0 (4)
PFB = YN - XN (5)
PNB = CN/ XN (6) Where: YN = productivity at the N dose; Y0 = productivity with no N; XN = amount of applied N; AXN = amount of N absorbed by corn at flowering; AX0 = amount of N absorbed, in the control without N application; CN = amount of N extracted by grain harvest.
The results were submitted to analysis of variance by the SISVAR 5.3 software (Ferreira, 2010) using the Scott Knott’s test at 5% of probability. To obtain the response curves, a regression analysis using the JMP IN® Version
3.2.1 software was used (Sall et al., 2005), using the F test
at 5% of significance level.
RESULTS AND DISCUSSION
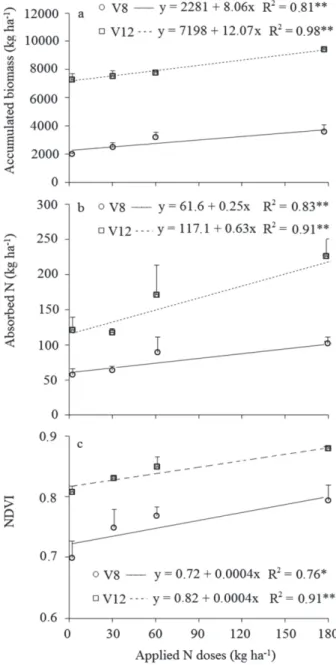
When attributes of plants at V8 and V12 stages were evaluated, significant relationships were verified with li-near adjustments between treatments 0, 30, 60 and 180 kg ha-1 of N at sowing, with biomass accumulated in the aerial
part, N absorption and NDVI obtained with the optical sensor (Figure 2).
At V8 stage (Figure 2), the biomass accumulated in the aerial part reached a minimum value of 2281 kg ha-1 and a
maximum value of 3732 kg ha-1. Corn absorbed between 62
and 107 kg ha-1 of N and the NDVI values obtained by the
optical sensor varied from 0.72 to 0.79, following the variation of N absorption by the plant. However, for the V12 stage (Figure 2), the ratios increased, with biomass ranging from 7198 to 9371 kg ha-1. The absorbed N varied
between 117 and 230 kg ha-1, while NDVI, still for the V12
stage, presented a range between 0.82 and 0.89.
The high ratios between NDVI and absorbed N and biomass production at V8 and V12 stages indicate that NDVI is a viable tool for generating recommendations of N at the variable rate in topdressing (Freeman et al., 2007)
when there is a calibration between the doses of N and the value of NDVI. Raun et al. (2005) explains that as the
vegetative development becomes more intense and the between rows are covered by leaves, NDVI values increase by the reduction of the exposed soil and by the increase of the amount of green mass.
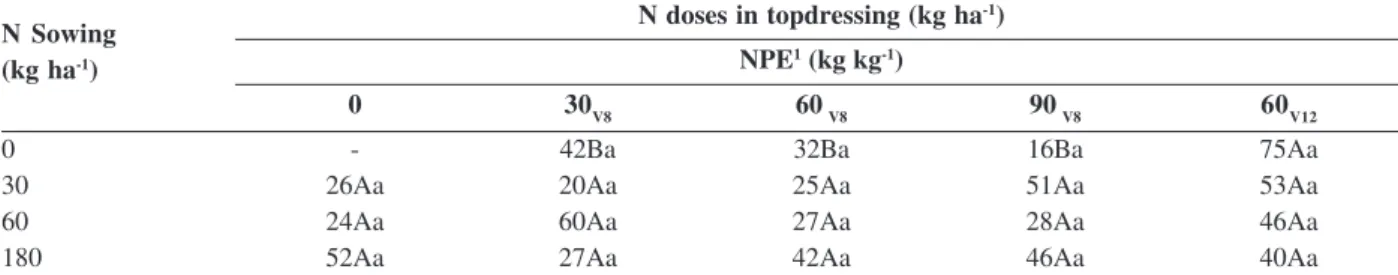
The value of the NPE index at the dose 0 kg ha-1 at
sowing combined with the topdressing dose of 60 kg ha-1
Table 2: Characteristics, management and evaluations carried out at 2010/11 harvest
Characteristics
Coordinates S 26°42’43.20"; W 55°44’45.6"
Altitude 310 m
No-tillage planting system 12 years
Corn hybrid DKB 390 (Dekalb)
Previous crop Wheat
Sowing date November 6, 2010
NDVI Reading and N in topdressing (V8) 42 DAS
NDVI Reading and N in topdressing (V12) 57 DAS
Date of harvest March 29, 2011
Phosphorus (triple super phosphate) 90 kg ha-1
Potassium (potassium chloride) 60 kg ha-1
Spacing 0.70 m
Plant population 59000 plants ha-1
(V12) was the highest value found in the experiment (75 kg kg-1), which was significantly superior to the other
treatments with N applied at V8. The other combinations of sowing and topdressing fertilizations presented similar NPE without significant differences between means (Table 3). Studies have shown that contemporary corn hybrids display higher N absorption peaks during silking and grain filling (Rajcan & Tollenaar, 1999; Silva et al., 2005b),
absorbing more than 50% of the required N over the cycle only in this phase, which shows changes in the absorption and assimilation curve of N in corn in relation to the genotypes launched in previous decades.
In relation to the 30 kg ha-1 dose of N at sowing, the
highest yield (12406 kg ha-1) was obtained with the dose of
90 kg ha-1 in topdressing, significantly differing from the
yields achieved with the doses of 0.0; 30 and 60 kg ha-1 of
N (V8) (Figure 3). At the dose of 60 kg ha-1 of N at sowing,
the N rates applied in topdressing showed statistically higher yields than the control plot, although no difference was found between them, where the highest yield was achieved at the dose 30 kg ha-1 (12242 kg ha-1). For the
dose of 180 kg ha-1 of N at sowing, none of the topdressing
doses showed a significant difference in corn productivity, with a higher yield for the dose 0 kg ha-1 of N in topdressing
(13157 kg ha-1) (Figure 3).
A substitutive effect was observed between N rates at sowing and N rates in topdressing, that is, as doses at sowing increased, the responses at topdressing doses decreased. Costa (2000), working with three N doses at sowing and topdressing (30, 60 and 90 kg ha-1 N), showed
that the application of 30 kg ha-1 at sowing and 90 kg ha-1
at topdressing provided the highest productivity, and this is the strategy of split N fertilization. According to Bull (1993), studies conducted in Brazil show that the best results are obtained with the application of 30 kg of N ha-1 at
sowing and 60 to 120 kg of N ha-1 between 30 and 45 days
after germination.
By analyzing the agronomic indices, NAE values varied between 11 and 97 kg kg-1 and PFP values ranged between
360 and 42 kg kg-1, showing a significance in the treatments
with a inversely proportional response to the increase of the amounts of applied N (Figure 3). The highest values of both indices were obtained when 0 kg ha-1 of N was applied
at sowing and 30 kg ha-1 of N in topdressing. Snider &
Bruselma (2007) reported that for the United States, NAE generally varies between 20 and 30 kg kg-1 and PFP values
between 40 and 80 kg kg-1 (Figure 3). So, values above
these points of NAE and PFP indicate well managed systems that have the capacity to supply N to corn.
In relation to the recovery of N applied in the treatments and determined by the NRE index, statistical difference in this index was found only for the treatment 0 kg ha-1 of N at
sowing, in which the combination with 60 kg ha-1 (V12)
presented lower value of NRE (0.59 kg kg-1). The highest
NRE value was 1.80 kg kg-1 for the subplot that received
the 30 kg ha-1 dose in topdressing, which was similar to
treatments with 30 and 60 kg ha-1 (V8) (Figure 3). Significant
difference in NRE was observed when doses of N applied at sowing (30, 60 and 180 kg ha-1) were combined with 0, 30
and 60 kg ha-1 doses of N at the V8 stage. According to
Dobermann (2007), values ranging from 0.5 to 0.8 kg kg-1
are considered points of high N recovery efficiency. Those values were verified in sowing and topdressing fertilizations that added between 90 and 150 kg ha- 1 of N to
the system.
The PNB index showed interactions and significant differences in all accomplished comparisons. The highest balances were found at the combined doses of 30 (0 + 30; 30 + 0) and 60 (60 + 0; 30 + 30; 0 + 60) kg ha-1 of N (Figure
3) originated by the low addition of N and high export by corn grains.
The reduced values of NUE were verified at the highest applied dose of N and with combined additions above 210 (180 + 30; 180 + 60; 180 + 90) kg ha-1 of N. Values ranging
from 0.55 and 0.76 kg kg-1 were found in the system, pointing
to a higher input than the output of N. Similar data from responses at these high doses were verified by Snyder & Bruselma (2007) in the USA and were also found by Rillo & Richmond (2006) in Argentina in treatments that exceeded 220 kg ha-1 of N applied at sowing.
The results found in the experiment showed that corn production potential is expressed as N doses ranging from 90 kg ha-1 to 180 kg ha-1 N. However, at doses between 60
and 120 kg ha-1 of N, the maximum economic efficiency of
N fertilization in corn is found (Silva et al., 2005a; Gross et al., 2006; Gomes et al., 2007).
So, in an attempt to better evaluate the experiment and estimate the efficiency of combined fertilization between sowing and topdressing (V8 and V12), the likely combination obtained in the experiment with total fertilization was analyzed with total fertilization (topdressing + sowing) of 60, 90 and 120 kg ha-1 of applied N (Figure 3).
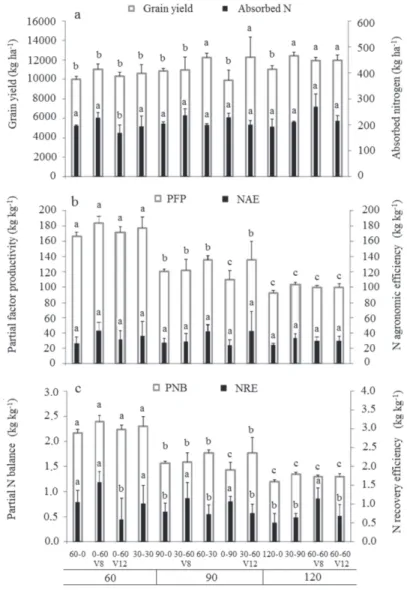
The highest grain yields were verified in the combined treatments, with part of N at sowing and part of N in topdressing (Figure 3a). The highest productivity was obtained with the 30 + 90 kg ha-1 dose of N (12406 kg ha-1)
followed by similarities in the combinations 30 + 60 (V12), 60 + 30, 60 + 60 (V8) and 60 + 60 (V 12) kg ha-1 of N.
Meira et al. (2009), with five combinations of N applied
at sowing and at the V8 stage (0 + 120, 30 + 90, 60 + 60, 90 + 30 and 120 + 0 kg ha-1 of N), verified the maximum yield of
corn grains with the combination 30 + 90 kg ha-1 of N. In a
study by Silva et al. (2005a), the authors stated that the
split and the time of application of nitrogenous inputs are alternatives for increasing productivity. In this same
experiment, it was concluded that the application of half of the N at sowing and the other half at the stage of 4 to 6 leaves, or half of the N at sowing and the other half at the stage of 8 to 10 leaves, generated the best yields.
When the mean effect of nitrogen fertilization in topdressing at V8 and V12 were compared, a significantly higher response was found in late fertilization 30-60 (V12) with a productivity of 12265 kg ha-1, in relation to 30-60
fertilization (V8) in which a productivity of 10976 kg ha-1
was reached (Figure 3). In the conditions where the applied N rates were lower than the N exports in the grains (60, 90 and 120 kg ha-1 of N), it was observed that the
fertilization closest to the highest N demand of corn (V8 and V12) was an efficient strategy (Figure 3a). Physiological changes in modern corn hybrids suggest changes in N uptake dynamics, increasing the plant’s ability to absorb it during grain filling. This may justify the use of late nitrogen topdressing, whenever climatic constraints do not prevent the adequate supply of N to corn (Silva et al., 2005b).
The combination of 0-60 at V12 presented the lowest value of absorbed N (169 kg ha-1), which was the only
combination being statistically smaller than the others (Fi-gure 3a). The highest values were observed at the combinations 60-60 (V8), 30-60 (V8) and 60-60 (V12) with values of 269, 236 and 214 kg ha-1 of N absorbed,
respectively.
Adequate precipitation in the experiment during vegetative stages contributed to a stable and similar N absorptions in the combinations until the flowering stage, whereas N absorption in grain filling probably differentiated corn productivity in the accomplished combinations (Figure 3a). A modern hybrid that can develop its vegetative potential, without water restrictions, and that is able to maintain the photosynthetic apparatus of the plant physiologically active for longer and with an optimal root growth is able to reach a higher N absorption in the period of grain filling and higher productivity per area at the end of the crop cycle (Rajcan & Tollenaar, 1999; Sangoi, 2001).
Table 3: Nitrogen physiological efficiency (NPE) obtained from corn’s response according to the nitrogen doses (N) in topdressing
and to N levels at sowing (2010/11 harvest)
N doses in topdressing (kg ha-1)
NPE1 (kg kg-1)
0 30V8 60 V8 90 V8 60V12
0 - 42Ba 32Ba 16Ba 75Aa
30 26Aa 20Aa 25Aa 51Aa 53Aa
60 24Aa 60Aa 27Aa 28Aa 46Aa
180 52Aa 27Aa 42Aa 46Aa 40Aa
Lowercase letters do not differ from each other in the same columns; upper case letters do not differ from each other in the lines by the Scott-Knott test at 5% of significance.
The values of PFP and NAE with 60 kg ha-1 of total
applied N did not significantly differ between their combinations, with the findings of higher values in the treatment 0 + 60 kg ha-1 of N with PFP value equal to 184 kg
kg-1 and NAE of 43 kg kg-1, followed by the dose 30 + 30 kg
ha-1 of N which obtained PFP of 177 kg kg-1 and NAE of 36
kg kg-1. For the combinations with total N applied of 90 kg
ha-1, the highest values of PFP (136 kg kg-1) and NAE (63
kg kg-1) were found in the treatment of 30 + 60 (V12) kg ha -1 of N, which differed significantly only from treatment 0 +
90 with PFP values equal to 110 kg ha-1 and NAE equal to
24 kg kg-1. These results indicate that the early N deficiency
was not compensated by late application (Figure 3b). According to Dobermann (2007) and Snider & Bruselma (2007), ideal conditions of production with maximum efficiency of N use are between 40 and 80 kg kg-1 of PFP. In
this situation, no good results were found with the analyzed
Figure 3: a) Grain yield and absorbed nitrogen (N) as a function of combinations of N doses at sowing and topdressing, b) partial
factor productivity (PFP) and N agronomic efficiency (NAE) as a function of combinations of N doses at sowing and topdressing, c) partial N balance (PNB) and N recovery efficiency (NRE) as a function of combinations of N rates at sowing and topdressing under three levels of applied N (60, 90 and 120 kg ha-1), 2011.
combinations. However, the achieved results agree with García (2009), where the low N values applied in South America, between 40 and 120 kg ha-1 of N generate PFP
values around 30% higher than the ideal values proposed by the researchers. Rillo & Richmond (2006) in Argentina, with doses between 50 and 220 kg of N at sowing, found high values of PFP and NAE similar to those found in this work carried out in Paraguay.
Dobermann (2007) reported that for NAE, values from 10 to 30 kg kg-1 are found in most experiments, although
values over 30 kg kg-1 indicate well-managed and balanced
systems. In this study conducted in Paraguay, for doses of 60, 90 and 120 kg ha-1 of total applied N, an NAE in the
range of 30 to 40 kg kg-1 of N was observed for most of the
combined treatments.
the combinations that totaled 120 kg ha-1 of applied N,
in which the ratio of N input and output were close to 1. Values of PNB were higher in the total doses of 60 kg ha-1 for all treatments in which a high N removal of the
system was verified in comparison to the N supplied with the fertilizer. Overall, a PNB above the value of 1 kg kg-1 was verified for all the treatments, inferring in a
larger N output than input in the system. The PNB values decreased as combined doses (60, 90 and 120 kg ha-1) increased, which presented PNB values of 2.3; 1.7;
1.4 kg kg-1, respectively, in the means of the sowing and
topdressing combinations.
For NRE values at doses of 60, 90 and 120 kg ha-1 of N,
the lowest recoveries were 0.59 kg kg-1 (0 + 60 V12); 0.73 kg
kg-1 (60 + 30) and 0.50 kg kg-1 (120 + 0), with reduced amounts
of N provided by the fertilizer. The highest values found resulted in 1.58 kg kg-1 (0 + 60 V8); 1.15 kg kg-1 (30 + 60 V8)
and 1.14 kg kg-1 (60 + 60 V8). Those values represent a
high capacity to recover and absorb N fertilizer and soil reserves. Values between 0.5 and 0.8 kg kg-1 were proposed
by Dobermann (2007) as points of high N recovery efficiency.
Lara Cabezas (2000) argued that obtaining NRE greater than 1 occurs when fertilized plants are able to exploit higher soil volume and, consequently, accumulate more N and biomass. Kuzyakov et al. (2000) explained that NRE
does not distinguish the origin of N, whether it comes from soil or the applied fertilizer, which could justify recoveries above 100%. Thus, the so-called positive priming effect occurs, where the supply of N may accelerate the mineralization of the organic matter of the soil and provide more N to the fertilized plant.
The comparison of NRE in the seasons of topdressing fertilization showed that the fertilizations at V8 allowed a better recovery of N than at V12 stage, but finally the differentiated behavior of NRE between treatments did not reflect in reduction in grain yield. The justification for this situation is the likely uptake of N in grain filling due to the good corn vegetative growth (Rajcan & Tollenaar, 1999; Sangoi, 2001).
CONCLUSIONS
The evaluations indicated a linear relationship between nitrogen fertilizer doses and the normalized difference vegetation index, both at V8 and V12 stages.
The delay of the nitrogen fertilization in topdressing (V12) did not cause a decrease in grain yield when it was combined with N at sowing, presenting a higher NUE than the fertilization combinations performed in topdressing (V8). The split in the nitrogen doses showed better NUE than the combinations where nitrogen was not applied at sowing or topdressing.
The possibility of delaying the fertilization in topdressing increases the N fertilization window in corn, being an alternative for the planning of the moment of the N fertilization according to the existing climate forecast in each region.
REFERENCES
Amado TJC, Mielniczuk J & Aita C (2002) Recomendação de adubação nitrogenada para o milho no RS e SC adaptada ao uso de culturas de cobertura do solo, sob sistema plantio direto. Revista Brasileira de Ciência do Solo, 26:241-248.
Binder DL, Sander DH & Walters DT (2000) Maize response to time of N application as affected by level of N deficiency. Agronomy Journal, 92:1228-1236.
Blackmer TM, Schepers JS, Varvel GE & Walter-Shea EA (1996) Nitrogen deficiency detection using reflected shortwave radiation from irrigated corn canopies. Agronomy Journal, 88:01-05.
Bragagnolo J, Amado TJC, Nicoloso RS, Jasper J, Kunz J & Teixeira TG (2013) Optical crop sensor for variable-rate nitrogen fertilization in corn: I. Plant nutrition and dry matter production. Revista Brasileira de Ciência do Solo, 37:1288-1298.
Bull LT (1993) Cultura do milho: fatores que afetam a produtivi-dade. Piracicaba, Potafos. 301p.
Costa AM (2000) Adubação nitrogenada na cultura do milho (Zea mays L.) em sistema de plantio direto. Dissertação de Mestrado. Universidade Estadual de São Paulo, Botucatu. 90p.
Dobermann A (2007) Nutrient use efficiency – measurement and management. In: Workshop on fertilizar best management practices, Bélgica. Anais, Brussels. p.01- 09.
Ferreira DF (2010) Programa Sisvar.exe: sistema de análise de variância. Lavras, UFLA. CD-ROM.
Fixen PE (2010) The four rights within a global fertilizer best managament practices framework. In: Prochnow LI, Casarin V & Stipp S R (Eds.) Boas praticas para uso eficiente de fertilizan-tes. Piracicaba, International Plant Nutrition Institute. p.01-22. Freeman KW, Girma K, Arnall DB, Mullen RW, Martin KL, Teal RK & Raun WR (2007) By-plant prediction of corn forage biomass and nitrogen uptake at various growth stages using remote sensing and plant height. Agronomy Journal, 99:530-536.
García F (2009) Eficiencia de uso de nutrientes y mejores practicas de manejo para la nutrición de cultivos. In: Simposio Fertilidad, Alto Rosario. Anais, International Plant Nutrition Institute. p. 09-19.
Gomes RF, Silva AG, Assis RL & Pires FR (2007) Efeito de doses e época de aplicação de nitrogênio nos caracteres agronômicos da cultura do milho sob plantio direto. Revista Brasileira de Ciência do Solo, 31:931-938.
Gross MR, Von Pinho RG & Brito AH (2006) Adubação nitrogenada, densidade de semeadura e espaçamento entre filei-ras na cultura do milho em sistema plantio direto. Revista Ciên-cia e Agrotecnologia, 30:387-393.
Kuzyakov Y, Friedel JK & Stahr K (2000) Review of mechanisms and quantification of priming effects. Soil Biology & Biochemistry, 32:1485-1498.
Martin KL, Girma K, Freeman KW, Teal RK, Tubana B, Arnall DB, Chung B, Walsh O, Solie JB, Stone ML & Raun WR (2007) Expression of variability in corn as influenced by growth stage using optical sensor measurements. Agronomy Journal, 99:384-389.
Meira FA, Buzetti S, Andreotti M, ARF O, Sá M & Andrade JAC (2009) Fontes e épocas de aplicação do nitrogênio na cultura do milho irrigado. Revista Semina: Ciências Agrárias, 30:275-284.
Portz G, Molin JP & Jasper J (2012) Active crop sensor to detect variability of nitrogen supply and biomass on sugarcane fields. Precision Agriculture, 13:33-44.
Rajcan I & Tollenaar M (1999) Source: Sink ratio leaf senescence in maize. I. Dry matter and partitioning during grain filling. Field Crops Research, 60:245-253.
Raun WR, Solie JB, Stone ML, Martin KL, Freeman KW, Mullen RW, Zhang H, Schepers JS & Johnson GV (2005) Optical sensor-based algorithm for crop nitrogen fertilization. Communications in Soil Science and Plant Analysis, 36:2759-2781.
Raun WR, Solie JB, Johnson GV, Stone ML, Mullen RW, Freeman KW, Thomason WE & Lukina EV (2002) Improving nitrogen use efficiency in cereal grain production with optical sensing and variable rate application. Agronomy Journal, 94:815-820. Rillo SN & Richmond PB (2006) Evaluación de tres criterios de fertilización nitrogenada en el cultivo de maiz en siembra directa en un suelo hapludol. In: 16th National Congress of Aapresid,
Rosario. Anais, AAPRESID. p.78-84.
Rouse JW, Haas RH, Schell JA & Deering DW (1973) Monitoring vegetation systems in the Great Plains with ERTS. 3rd ERTS
Symposium, Washington. Proceedings, NASA SP-351. p.309-317.
Sall J, Creighton L & Lehman A (2005) JMP start statistics: A guide to statistics and data analysis using JMP and JMP IN software. 3ª ed. Cary, Duxbury Press. 580p.
Sangoi L & Almeida ML (1994) Doses e épocas de aplicação de nitrogênio para a cultura do milho num solo com alto teor de matéria orgânica. Pesquisa Agropecuária Brasileira, 29:13-24. Sangoi L (2001) Understanding plant density effects on maize
growth and development: an important issue to maximize grain yield. Ciência Rural, 31:159-168.
Scharf PC, Wiebold WJ & Lohry JA (2002) Corn yield response to nitrogen fertilizer timing and deficiency level. Agronomy Journal, 94:435-441.
Silva EC, Buzetti S, Guimarães GL, Lazarini E & Sá M (2005a) Doses e épocas de aplicação de nitrogênio na cultura do milho em plantio direto sobre Latossolo Vermelho. Revista Brasileira de Ciência do Solo, 29:353-362.
Silva PRF, Strieder ML, Silva RPC, Rambo L, Sangoi L, Argenta G, Forsthofer EL & Silva AA (2005b) Grain yield and kernel crude protein content increases of maize hybrids with late nitrogen side-dressing. Scientia Agricola, 62:487-492.
Snyder CS & Bruulsema TW (2007) Nutrient use efficiency and effectiveness in North America: indices of agronomic and environmental benefit. Norcross, International Plant Nutrition Institute. 4p.
Teal RK, Tubana B, Girma K, Freeman KW, Arnall DB, Walsh O & Raun WR (2006) In-season prediction of corn grain yield potential using normalized difference vegetation index. Agronomy Journal, 98:1488-1494.