A Work Project, presented as part of the requirements for the Award of a Master Degree in Finance from the NOVA – School of Business and Economics
THE IMPACT OF THE EUROPEAN SOVEREIGN DEBT CRISIS ON THE RECOVERING FROM THE FINANCIAL CRISIS– EQUITY RETURNS OF THE
BANKING SECTOR
MADALENA SANTOS RIBEIRO VIEIRA DUQUE 508
A Project carried out on the Financial Markets Major, under the supervision of Professor Paulo M. M. Rodrigues
2
THE IMPACT OF THE EUROPEAN SOVEREIGN DEBT CRISIS ON THE RECOVERING FROM THE FINANCIAL CRISIS – EQUITY RETURNS OF THE BANKING SECTOR
Abstract
This paper analyses, through a dynamic panel data model, the impact of the Financial and the European Debt crisis on the equity returns of the banking system. The model is also extended to specifically investigate the impact on countries who received rescue packages. The sample under analysis considers eleven countries from January 2006 to June 2013. The main conclusion is that there was in fact a structural change in banks’ excess returns due to the outbreak of the European Debt Crisis, when stock markets were still recovering from the Financial Crisis of 2008.
3
1 Introduction
“The recent crisis that developed from a global banking crisis in the summer of 2007 to a European sovereign debt crisis since 2010 is one of the most challenging episodes for policy makers both at government and central banks since the introduction of the euro” (Alter and Beyer, 2013, page 4). Many theories have offered potential explanations about how financial crisis develop and how these can be prevented. However, periods of serious turmoil continue to happen from time to time.
In fact, the Global Financial Crisis of 2008 has been considered the worst financial crisis since the Great Depression of the 1930s. The weakness of financial institutions globally can be pointed out as one of the major consequences of such trouble conditions. Although the crisis originated in North America, with the burst of the U.S. housing bubble in 2007, it rapidly spread to the rest of the world. Among its causes, one can point out the huge growth of the housing bubble and the associated subprime lending; a flood of irresponsible credit to consumers; fraudulent underwriting practices; deregulation (in the sense that the regulatory framework has not accompanied the financial complexity and innovation); predatory lending; over-indebtedness; and incorrect measure of risk. In the aftermath of the financial crisis, authorities and central banks adopted severe measures, either through fiscal stimulus or austerity plans.
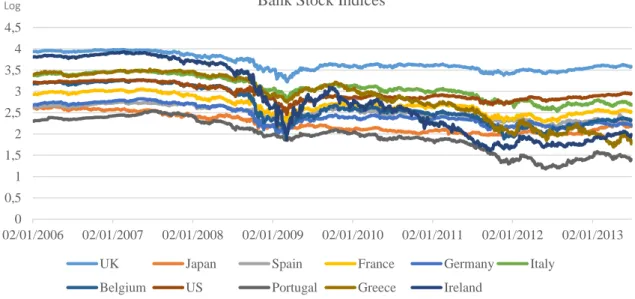
When the banking sector worldwide finally began to see its stock prices recover, Europe was hit by serious problems concerning the amount of sovereign debt (see figure 1). The recession of 2008-2012 had created favourable and undesired conditions for a scenario of simultaneous banking crisis, governments’ debt crisis and a competitiveness crisis. As the ability to repay and refinance government debt in European countries increased, a currency crisis was established, leading to sovereign defaults. The tightening nexus
4
established within world economies, mostly due to the globalization process of the last century, also exposed non-European economies to this Eurozone crisis.
Figure 1 – Banking Sector Equity Indices. Data source: Datastream.
To a certain extent, the most affected European nations (such as Greece, Ireland, Italy and Portugal) found themselves in a position where they were neither unable to repay nor to finance their governments’ debt. It was in the beginning of 2010 that the first country in the analysis (Greece) recognized urgent need for international support. When asking for external help, those nations committed themselves to an agreement with and established by “Troika” 1, in exchange for financial support. Meanwhile, the European Central Bank
(ECB) sought to ease the crisis’s impact. In order to ensure that money flows were not freezing, the ECB provided cheap loans to European banks and lowered interest rates.
1 “Troika” is the tripartite committee led by the European Commission (EC), the European Central Bank (ECB) and the International Monetary Fund (IMF). The entity has been providing financial assistance to governments of countries in trouble, such as Greece, Ireland, Portugal and Cyprus. The financial support measures consist in the European Financial Stability Facility (EFSF) and the European Stability Mechanism (ESM), among others.
0 0,5 1 1,5 2 2,5 3 3,5 4 4,5 02/01/2006 02/01/2007 02/01/2008 02/01/2009 02/01/2010 02/01/2011 02/01/2012 02/01/2013 Bank Stock Indices
UK Japan Spain France Germany Italy
Belgium US Portugal Greece Ireland
5
Greece, Ireland, Italy and Portugal have been the most worrisome countries regarding liquidity problems.
The main goal of this paper is to study if there was in fact a structural change in banks’ equity returns when both financial and sovereign debt crisis hit. Aside from answering that question, I will then study the impact of the EU Emergency Measures (i.e., rescue loans) received by four Euro-member countries (Greece, Ireland, Portugal and Spain) on equity returns of their banking systems. Although the causes of such serious crises differ from country to country, the feedback loop between domestic sovereign creditworthiness and domestic banks are evident in all of the European States. The systematic risk coming from this growing interdependence between banking systems and sovereigns highlights the usefulness of analysing the factors that influence the rise and fall of bank returns. Even more in a scenario of crisis, as the one we are living nowadays.
The reminder of this paper is organized as follows. Section 2 introduces a brief literature review. Section 3 explains the methodology and the details of the model. Section 4 presents the estimation results and section 5 concludes.
2 Literature Review
There is a vast range of literature on the Financial Crisis and European Sovereign Debt Crisis. Many studies were conducted to explain the causes and consequences of these two successive events, as well as their impact on equity returns of the banking sector. In order to be clearer, this section is divided into three major topics: i) What has been affecting banking sector’s performance?; ii) From financial crash to European sovereign debt
6
crisis; and iii) The impact of the European debt problemsin equity returns of the banking sector.
i) What has been affecting banking sector performance?
One of the most important drivers of bank returns of advanced economies is the funding conditions prevailing at the time. There are different channels whereby the worsening of sovereign creditworthiness jeopardize banks funding conditions. First of all, bank losses that took place since the subprime crisis have exasperated banks’ balance sheets, increasing therefore the cost of funding and decreasing the leeway of doing that. The same losses lead to a reduction in the value of banks’ collateral, undermining the wholesale funding and conditioning their ability in getting liquidity from the respective central banks. Also, the negative spillovers from sovereigns to the banking sector have contributed to the downgrade of domestic banks rating. In that way, rating agency news have powerful impacts in determining banking funding conditions. In the recent past, several rating downgrades have increased the costs of funding and the access to international markets was, almost automatically, damaged (see Arezki, Candelon and Sy, 2011 and Alter and Beyer, 2013). Another channel of impact is related to the reduction of funding benefits that banks obtain by government guarantees – even more in European countries, where governments are no longer capable of avoiding bank failures, notwithstanding the fear of a negative systematic risk coming from it.
Additionally, Chan-Lau, Liu and Schmittmann (2012) show that changes in both growth prospects and sovereign risk had a strong impact on the behaviour of equity returns, especially from 2008 onwards. The authors pointed out that “a deterioration of the economic outlook hurts a country’s repayment capacity raising its sovereign debt. Losses in bond holdings decrease banks’ ability to provide credit, further damaging the growth
7
outlook, and to continue buying sovereign debt, leading to higher sovereign spreads that affect the country’s ability to serve its debt”. Once again, the feedback loop between sovereigns and banks is evident.
Regarding the performance of the banking sector in adverse economic conditions, there are a lot of factors that help explaining why some banks performed better than others. Accordingly to the same article by Chan-Lau, Liu and Schmittmann (2012), European banks more reliant on wholesale funding, measured by the loan-to-deposit ratio, tend to perform poorly. Its short-term conditions increase the likelihood of funding shortages, when market uncertainty is established (Duffie 2010, and Gorton and Metrick 2010). On the contrary, deposits seem to be a stable source of funds, helping banks protecting themselves in crisis episodes. Moreover, higher capitalization (measured as the equity to asset ratio) and lower leverage make banks’ equity returns less vulnerable to euro area crisis episodes (Chan-Lau, Liu and Schimttmann, 2012). Surprisingly, banks located in countries with more power regulation had worse stock returns during the euro crisis episodes. It is not to say that governance is bad for banks’ performance, but the attributes that market rewarded in 2006 to increase shareholders’ wealth, for instance, implied too many risks that lead to huge costs when the crisis hit; see Beltratti and Stulz (2009).
ii) From financial crash to European sovereign debt crisis
Ureche-Rangau and Burietz (2012) presented direct empirical evidence for the link between the financial crisis and the current European sovereign debt crisis. The subprime crisis started in 2007 with a real state crisis. This period was dominated by many bank runs, accompanied by several bank failures. The simultaneous process of sequential increases in interest rates and decreases in house prices led to colossal default rates on
8
subprime mortgages. Banks’ exposure to financial market problems was creating serious concerns.
In order to avoid market panic and restore people’s confidence, governments saw themselves in the duty to limit the bust and consequences phase. Providing public financing was the first step taken, leading to a colossal increase of the sovereign debt and its cost. That is why one may say that the financial crash was one of the main drivers of the current sovereign problems. Meanwhile, many rescue plans were put in practice, contributing to an even higher level of sovereign debts. Those financial packages (capital injections, liquidity provisions, guarantees, among others) had serious consequences and since 2010, governments have faced troubles in refunding their own debt (see Ureche-Rangau and Burietz, 2012).
In more detail, the period between January 2007 and September 2008 was defined by the banking crisis, when banks’ Credit Default Swap (CDS) increased sharply, and sovereign CDS remained stable. Then, from September 2008 and October 2008, the implementation of the aforementioned rescue plans helped in reducing banks CDS, but through the cost of sovereign CDS increases. From October 2008 onwards, banks’ difficulties became even more serious and, simultaneously, governments’ debt was getting riskier (Ureche-Rangau and Burietz, 2012).
iii) The impact of the European debt problems in equity returns of the banking sector
During financial crisis, the consequences of a sovereign creditworthiness deterioration on the banking system turn even more dynamic. As Alter and Beyer (2013) noticed, “Sovereign debt amplification feeds back into the financial sector by affecting balance sheets of financial institutions and thereby having a negative impact on domestic banks’
9
ratings that pushes up their funding costs, see e.g. BIS (2011)”. The same article also shows that the individual contagion risk from countries that have implemented rescue plans is very high in the time preceding those programs, decreasing significantly shortly after. For instance, after the implementation of rescue packages in Greece, Portugal and Ireland, spillover risks from those countries were partially mitigated.
Chan-Lau, Liu and Schimttmann (2012) compare the two crises periods: 2006-2008 and 2009-2010. Their analysis reveals that the impact of the Euro-periphery sovereign stress measure had a much higher impact in the second period. This might occur since the focus on sovereign exposures was boosted once the European Banking Authority (EBA) started performing stress tests and important data became available to markets.
Besides the direct link with the tightening nexus between sovereigns and banks aforementioned, there is also a channel through which high government debts affects banks’ equity value. Every so often, and in a context of high debt levels, governments have no alternative but to increase taxes or decrease public spending. As a chain reaction, economic growth falls. The amount of non-performing loans increases and asset prices fall, automatically hurting both asset quality and capitalization of banks2 (Poeck and
Wijffelaars, 2012).
Credit rating agencies also play a fundamental role in this downward spiral both across countries and financial markets, essentially focused in more troubled countries like Greece, Ireland, Portugal and Spain (see Arezki, Candelon and Sy, 2011)3. Accordingly,
2 Accordingly to Poeck and Wijffelaars (2012), “even if high debt does not lead to fiscal consolidation it hampers growth through high interest expenditure which crowds out expenditure that could benefit growth”.
3 The sign and magnitude of the impact of credit rating downgrades in a specific country depends on different factors. One can highlight the characteristics of the announcement, the individual economic and financial conditions of that country and the rating agency that states the announcement (see Poeck and Wijffelaars, 2012).
10
“downgrades to near speculative grade ratings for relatively large economies such as Greece have a systematic spillover effects across Euro zone countries” (Arezki, Candelon and Sy, 2011), rising sovereign bond and CDS spreads, while increasing pressures on stock markets4. One should notice that such feedback loop (related with the effect of sovereign spreads on banks’ balance sheets) greatly threatens governments capacity of recapitalizing those banks after a banking crisis event (Poeack and Wijffelaars, 2012).
3 Model and Data
In order to study the impact of the European Sovereign Debt Crisis in the recovery of bank equity returns from the Great Recession of 2008-2012, I have defined a panel data regression. Eleven countries were included in this study: the United Kingdom, Japan, Spain, France, Germany, Italy, Belgium, the United States of America, Portugal, Greece and Ireland. Besides the inclusion of two dummies representing the aforementioned crises, other macro variables were taken into consideration.
The sample of monthly data under analysis starts in January 2006 and ends in June 2013. The starting date was chosen in order to cover both the beginning and the pike of the financial crisis (in 2008), whereas the end of the interval was dictated by data availability. Data was collected from different sources, such as Bloomberg, Datastream, OECD, Banco de Portugal and Eurostat. To perform the required econometric computations, I used the program STATA.5. The following equation describes the panel data regression
4 In the case of Greece, a rating downgrade by Fitch in December 2009 (from A- to BBB+) had a significance and negative spillover effect across European member-states. For instance, a 0,17% increase in Greek CDS spreads and a 0.05% increase in Irish CDS spreads (Arezki, Bertrand and Sy, 2011). 5 To estimate my model, I used the Arellano- Bond dynamic panel-data estimation, with robust standard errors, in order to deal with heteroskedasticity. After the model was built, the Wooldridge test was performed to endorse that we were not in the presence of serial correlation. Details are presented in the book “Microeconometrics using STATA”.
11
estimated to carry out the analysis:
Bank Excess Returnsit = β 0 + β1CDSit + β2PMIit + β3OISit + β4VIXit + β5IPit +
+ β6TradeJapan-EUi,t + β7TradeEU-USit + β8Financial_crisis + β9EUSovdebt_crisis + εit
Equation (1) where:
i=1, 2, … , 11 corresponds to each of the eleven countries
t=1,2,.. 89 corresponds to months starting in February 2006 and ending in June 2013.
Notice that, to overcome nonstationarity problems all explanatory variables are expressed in first differences. Moreover, all data was converted to Euros.
Bank Excess Returns (Bank Excess Returns)
The dependent variable is the Bank Excess Equity Returns of the different eleven countries under consideration. It was computed from the bank stock indices extracted from Datastream. After doing the appropriate transformation from prices to returns, I subtracted the risk free rate proxy to obtain the excess equity return series. According to Chan-Lau, Liu and Schmittmann (2012), the 1-month Euro Overnight Index average swap rate (EONIA) seems to be the most suitable risk free6 proxy.
6 EONIA swap is the most liquid rate in euro money markets and it less disturbed by counterparty risk. German bonds yields could also have been used as a proxy for the risk free rate, although they could be affected by worries about potential need of help by Germany to European countries. See Chan-Lau, Liu and Schimttmann, 2012. Sovereign Risk GDP Outlook Funding Conditions Investor Sentiment Economic Health Commercial Wealth
12
Credit Default Swap spread (CDS)
The variable Credit Default Swap, as an insurance against non-payment, is presented in the model to measure the impact of the sovereign stress. There are different reasons for the choice of CDS spreads rather than bond spreads. The fact of holding more information about the real sovereign stress is only one of them. Likewise, the arithmetic average of the 5-year CDS spreads of most worrisome countries in that field (Belgium, Spain, Portugal and Greece7) is representing the sovereign risk variable in the model.
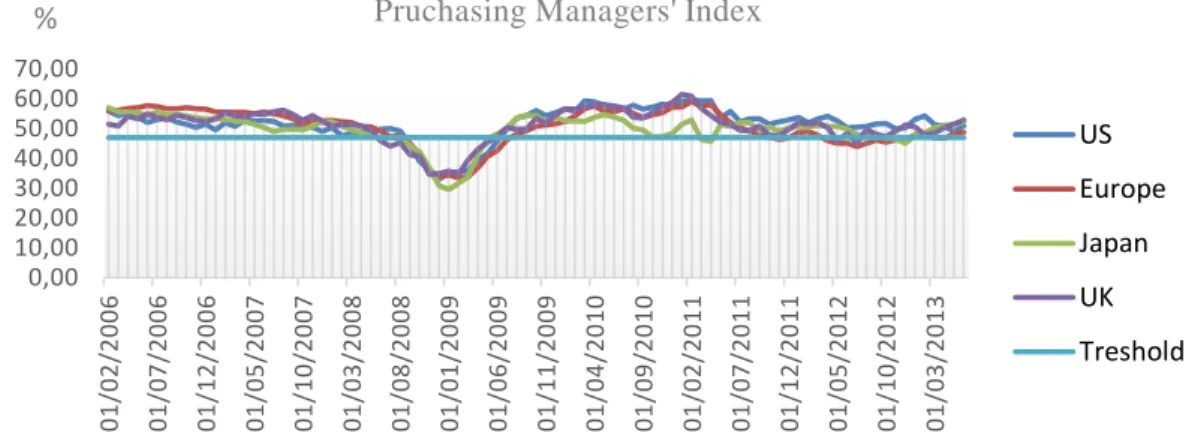
Purchasing Managers’ Index (PMI)
PMI’s ability to predict changes in the manufacturing output and in the real economy as a whole makes it crucial for our model of bank excess returns. Although manufacturing is not a large component of GDP, it is in that sector where we actually see the first signals about recession and recovery. In general, manufacturing PMI values above and below 47, signal expansion periods and recession periods, respectively – see figure 2. It has proved to be a valuable tool for tracking the health of the economy.
Figure 2 – Purchasing Managers’ Index. Data source: Bloomberg.
7 Ireland should also be included in the group of the countries that suffered the most severe CDS widening. However, due to data unavailability, this country was not taken into account when computing the arithmetic average. 0,00 10,00 20,00 30,00 40,00 50,00 60,00 70,00 0 1 /0 2 /2 0 0 6 01/07/2006 01/12/2006 01/05/2007 01/1 0 /2 0 0 7 01/03/2008 01/08/2008 01/01/2009 01/06/2009 01/11/2009 01/04/2010 01/09/2010 01/02/2011 01/07/2011 01/12/2011 01/05/2012 01/10/2012 01/03/2013
Pruchasing Managers' Index
US Europe Japan UK Treshold %
13
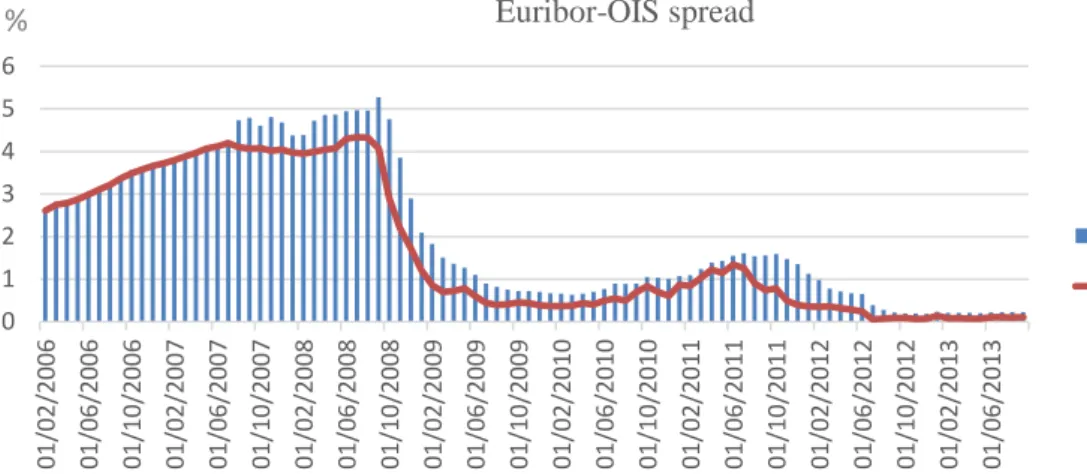
Euribor – OIS spread (OIS spread)
The 3-month Euribor OIS spread indicates how much trust banks place on each other. When looking at historical OIS values, one is able to infer about the rising and falling of credit risk in the markets – see figure 3. This explanatory variable of banking system’s stress is illustrating short-term funding conditions8.
Figure 3 - Euribor-OIS spread. Data source: Bloomberg.
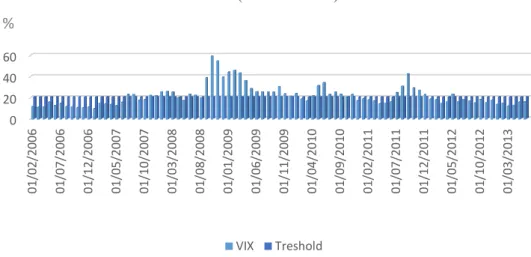
Volatility Index (VIX)
The Volatility Index measures the level of volatility based on S&P 500. It is widely known as the “fear gauge”, once it expresses the investors’ predictions of market volatility and risk in the near future. Often, when it exceeds 20% we are facing dismissing and uncertain times. On the other hand, values below 20% correspond to more complacent periods; see figure 4.
8 According to Chan-Lau, Liu and Schmittmann (2012), we could also have included the Option Adjusted Spread (OAS) for Eurobonds issued by global banks to account for long-term funding conditions. Once again, data unavailability has prevented us to include such variable or other alternative to stand for funding costs in the long-run.
0 1 2 3 4 5 6 01/02/2006 01/06/2006 01/10/2006 01/02/2007 01/06/2007 01/10/2007 01/02/2008 01/06/2008 01/10/2008 01/02/2009 01/06/2009 01/10/2009 01/02/2010 01/06/2010 01/10/2010 01/02/2011 01/06/2011 01/10/2011 01/02/2012 01/06/2012 01/10/2012 01/02/2013 01/06/2013 Euribor-OIS spread EURIBOR OIS %
14
Figure 4 - Volatility Index. Data source: Bloomberg.
Industrial Production (IP)
As a proxy for GDP, we added to our model the explanatory variable Industrial Production (expressed at constant prices of 2010). The goal is to study the impact of the economic conditions in bank returns. From the investor´s perspective, changes in the level of this economic indicator are associated with similar changes in the gross domestic output (GDP).
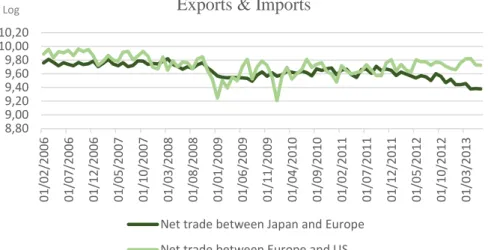
Net exports (TradeJapan_EU and TradeEU-US)
In order to measure the commercial balance health, I decided to introduce the variable Net Exports. It indicates the net balance between each two regions. Hence, we include two different variables: Net Exports Japan-Europe (net balance of exports from Japan to Europe and Imports to Japan from Europe) and the Net Exports Europe-US (reflecting the net balance of exports from Europe to US and Imports to Europe from US) – see figure 5. The decision to exclude the variable of trade between US and Japan is related to the fact that it does not add any explanatory power to the model.
0 20 40 60 01 /02 /20 06 01/07/2006 01/12/2006 01/05/2007 01/10/2007 01/03/2008 01/08/2008 01/01/2009 01/06/2009 01/11/2009 01/04/2010 01/09/2010 01/02/2011 01/07/2011 01/12/2011 01/05 /20 12 01/10/2012 01/03/2013 VIX (US DOLARS)
VIX Treshold
15
Figure 5 – Net trade. Data source: Bloomberg
Dummies: Financial Crisis and European Sovereign Debt Crisis
Since the major purpose of the model is to test if there was a structural change in returns of the banking system due to the impact of the European Sovereign Debt Crisis in recovering from the Financial Crisis, we introduce two dummies to personate these two periods.
The first dummy associated with the Financial Crisis takes the value 1 from August 2008 onwards. The decision of the starting date was due to the fact that it was at that time that the collapse (or risk of collapse) of major financial institutions has set in. Although the bubble burst earlier, it was in the mid-2008 that global stock markets began to suffer large losses.9
Regarding the European Sovereign Debt Crisis, the starting date to “turn the dummy active” was defined in May 2010. Even though rumours of problems with the Greek debt
9 In March 2008 the investment bank Bear Streams was rescued, and only six months later, in September, the Lehman Brothers failure strongly hit stock markets.
8,80 9,00 9,20 9,40 9,60 9,80 10,00 10,20 01/02/2006 01/07/2006 01/12/2006 01/05/2007 01/10/2007 01/03/2008 01/08/2008 01/01/2009 01/06/2009 01/11/2009 01/04/2010 01/09/2010 01/02/2011 01/07/2011 01/12/2011 01/05 /20 12 01/10/2012 01/03/2013 Exports & Imports
Net trade between Japan and Europe Net trade between Europe and US
16
began to emerge in 2009, it was only in 2010 that such problems have become public10. When looking at figure 1, it is evident that the impact of the debt difficulties was mainly from May onwards.
Extended Model – International Help Dummy
For the purpose of lengthening the analysis, a second model was created. As in the previous case, the Arellano-Bond GMM panel-data estimator was used. The difference is that this second model takes into account the distinction between countries that have received rescue packages and the countries that have not.
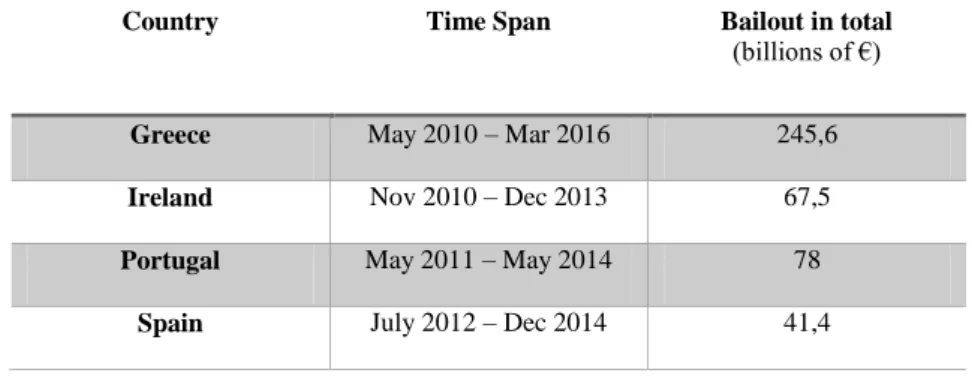
The first step consisted in identifying the EU-members that received rescue packages: Greece, Ireland, Portugal and Spain (see Table 1).
Country Time Span Bailout in total
(billions of €)
Greece May 2010 – Mar 2016 245,6
Ireland Nov 2010 – Dec 2013 67,5
Portugal May 2011 – May 2014 78
Spain July 2012 – Dec 2014 41,4
Table 1 – EU Emergency Measures.
For each country, the dummy External_help assumes the value 1 in different dates, depending on the data in which the country under consideration asked for financial help.
10 In 2009 Greece recognized its problems with debt payment and refinancing. At the time, Greek budget deficit was around 13% of total GDP (against the 3% limit stated by the European Union). Several rating downgrades took place, driving up interest rates.
17
4 Results
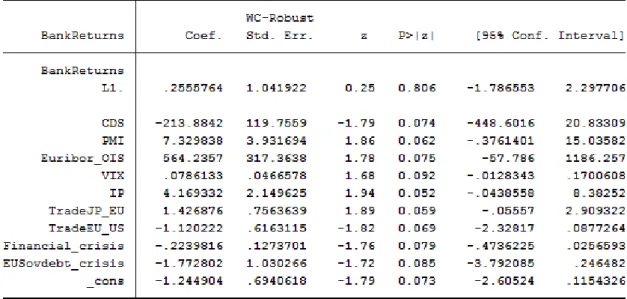
Table 2 - Panel-model estimation; output from STATA.
Table 2 provides the results from the Arellano-Bond Dynamic Panel Data estimation, using robust standard errors. As aforementioned, all independent variables are included in first differences. Most of the explanatory variables included are statistical significant, with the exception of the lag of the dependent variable (BankReturnsL1). CDS, PMI, OIS, VIX, IP, TradeJP_EU, TradeEU_US, Financial_crisis and EUSovdebt_crisis are all statistically significant at a 10% significance level. Also, when looking at the Wald test, it allows us to conclude for the overall significance of the regressors considered. Therefore, the negative impact of both the financial and the European sovereign debt crisis in the excess returns of the banking system worldwide is evident. Moreover, when
18
comparing the statistical significance of both crises’ coefficients, we may say that the European sovereign debt crises seems to be affecting equity bank returns in a stronger way than the previous financial crisis of 2008.
The unemployment rate was also included in the initial model, as a way of illustrating the economic cycle. Unfortunately, this variable was omitted due to collinearity problems. One possible explanation behind the collinearity of unemployment may be the fact that its information is also expressed in other variables that measure the economic cycle (namely Industrial Production). Below I will analyse in detail all the significant variables of our model.
CDS
Since our panel data model is related with banks’ excess returns, the CDS variable seems to be of most importance. As previously mentioned, this variable is measuring sovereign risk, so a negative sign was expected. In fact, what the model tells us is that a higher sovereign stress/risk in the countries that experienced the most severe CDS widening according to Chan-Lau, Liu and Schimttmann (2012) (such as Greece, Italy, Portugal, Spain and Belgium) affects negatively banks’ equity returns. Possible interpretations might be that creditworthiness deterioration impairs bank returns in general, since it implies losses on banks’ holdings of public debt and therefore harms banks’ balance sheets, reduces the value of collateral of those banks, and also leads to rating downgrades for banks situated in troubled countries11 (Poeck and Wijffelaars, 2012).
11 Poeack and Wijffelaars (2012) found that what matters in banks’ stock prices reduction is not as much the holding government debt of a trouble country but the residence of banks in that trouble country.
19
PMI
The Purchasing Managers Index is positively related with banks’ excess returns. This happens because PMI is known for its ability to predict real GDP growth, not only in the manufacturing sector but in the economy as a whole. In this way, a positive change of this variable is associated with positive growth in real economic activity, thus improving banks’ equity returns.
Euribor – OIS spread
Surprisingly, results show a positive relationship between our measure of short term funding conditions and bank returns. As previously mentioned, Euribor-OIS spread indicates how banks view the creditworthiness of other banks. The higher the spread, the more expensive it is for banks to borrow from each other. Thus, higher values are related with uncertainty times (see figure 3), since a positive change of this variable tells us that credit market risk is increasing, setting more pressure on the banking system and jeopardizing banks’ excess returns. That is why we would expect rather a negative relationship. Possible explanations to the unexpected positive sign may be related with several factors, like the inclusion of variables in our model that may already capture the same signals as the Euribor-OIS spread does.
VIX
In what concerns investor sentiment, its coefficient is very low and somehow surprising, due to its positive sign. Actually, a negative coefficient was expected, since this contrarian indicator usually has an inverse relationship with the market. As explained before, a high VIX is related with investor fear, whereas a low VIX reflects a market that is rallying.
20
One possible explanation for the positive coefficient achieved may be the fact that higher volatility often reflects higher returns.
IP
Our measure of economic wealth, the Industrial Production, shows a positive coefficient relation with bank returns. Since IP is a useful tool when assessing economic performance for a given country, it is not surprising that positive changes would affect positively bank’s excess returns. One potential explanation is related with the fact that increases in Industrial Production lead to increases of the economic activity, therefore resulting in higher earnings or profits. Hereupon, investors start to revaluate stock returns (in a more favourable way), resulting in higher returns (Young, 2006).
TradeJP_EU, TradeEU_US
In what concerns the coefficient of the net trade between Japan and Europe (i.e., exports from Japan to Europe minus imports to Japan from Europe), our model suggests a positive relationship with this variable and banks’ excess returns. When looking at figure 5, one may see that there is no sudden rise or fall of the net trade in the crises periods. Thus, we cannot infer deep conclusions about how this variable affects bank returns.
The other variable concerning the net trade (TradeEU_US) is related with exports from Europe to US minus imports to Europe and from the US. Likewise the previous case, one cannot reach significant conclusions from the negative sign of the coefficient. When looking at figure 5, it seems that there is no clear relationship between that variable and bank equity returns.
21
Financial Crisis
The so called Great Recession of the modern times (2008 Financial Crisis) severely weakened the whole economy, with higher emphasis on the profitability of the banking system. Therefore, and as expected, the Financial Crisis dummy shows a negative relationship with our dependent variable. Furthermore, the statistical significance of this dummy reinforces the theory that there was in fact a structural change in the performance of bank returns in the outbreak of the financial crisis.
As the main drivers of trouble conditions, one can highlight the irresponsible mortgage lending (firstly in the United States, enhancing the growth of the housing bubble), easy credit provisions, weak and fraudulent underwriting practices, and incorrect pricing of risk. Moreover, low interest rates created incentives for both banks and investors to look for riskier assets that offered higher and seductive returns.
European Sovereign Debt Crisis
The statistical significance of the dummy associated with the European Sovereign Debt Crisis reflects the second structural change in the banking system performance. Although in 2009 Greece began to have serious debt problems, one may say that the official crisis started only in 2010, clearly affecting bank stock returns in a more severe way in October of that year. Actually, banking crises are often preceded by the rapidly rising of indebtness (Reinhart am Rogoff, 2011). As expected, the sovereign debt crisis has been affecting strongly and negatively bank equity returns through many different channels. This reinforces our theory that after the 2008 financial crash, bank returns worldwide started recovering, with the exception of Europe, due to the burst of the debt crisis.
22
In situations of debt problems, when the dummy assumes the value 1, governments have no alternative other than fiscal consolidation (through either high taxes or lower public spending). Thus, non-performing loans rise whereas asset price fall, both worsening the asset quality and capitalization of banks (Poeck and Wijffelaars, 2012). There is clear evidence that the financial crisis had evolved into a sovereign debt crisis.
Extended Model – Financial Help
Table 3- Extended panel-model estimation; Output from STATA.
Table 3 provides the extended model, embodying the dummy variable related with countries that received external help. The results show a statistical significance (at a 10% significance level) of all the variables in this new model, keeping the same signals of their coefficients. Also, the Wald test confirms the overall significance of the model.
23
The statistical significance of the dummy External_help gives emphasis to the theory that asking for financial help had impact on banks’ equity returns of the countries who did it. Although the coefficient is low, there is a clear distinction between countries that receive EU Emergency Measures and the countries that had not. Actually, when looking at the sign of the dummy coefficient, one may say that the impact of the rescue programs had in fact contributed to bank returns recovery.
5 Conclusions
This article’s objective is to study if there was a structural change in equity returns of the banking system due to the outbreak of the European Sovereign Debt Crisis, supporting the tightening nexus between banks and sovereigns.
To carry out my analysis, I performed a GMM Arellano-Bond panel model estimation using Bank’s excess returns as the dependent variable and taking into consideration several other variables that may affect the performance of the banking sector worldwide. The sample under analysis covers eleven countries (9 EU member-states, Japan and United States) and ranges from January 2006 to June 2013.
The main conclusions of the regression model rely on the fact that there was indeed a structural change in bank returns performance due to recent crises’ impact. This is expressed by the statistically significance of the two dummies included (each related with each crisis). Actually, from 2010 onwards stock markets worldwide began to recover from the 2008 Financial Crisis, with the exception of Europe, which was hit by problems in repaying and refinancing its debt. The statistical significance of the explanatory variables included (namely CDS spread, EURIBOR-OIS spread and VIX) reinforces the importance of restoring market confidence.
24
In what concerns the extended model (the one accounting for the distinction between countries who asked for financial help and countries that did not) we can infer three main conclusions. First, rescue packages had a significant impact on the banking returns of the countries who had implemented it. Second, and as expected, the impact is positive, reflecting that such measures have contributed to improve the performance of the banking system in countries who had implemented them. Third, since those countries are still presenting bank weaknesses, we may conclude that the financial support given was not enough to restore complete confidence in the market.
Finally, our analysis remits us to the importance of risk management in the banking activity. Effective management of risk protects economies and investors from sudden shocks and unwelcome surprises. One of the top priorities is to break the link between banks and sovereigns, preventing spillover effects in turmoil periods.
Moreover, it is crucial to have authorities capable of ensuring that rules are correctly observed. Otherwise, no rescue plan will be efficient in improving the whole health of the banking sector.
References
Alter, Adrian and Andreas Beyer. 2013. “The Dynamics of Spillover effects during the European Sovereign debt turmoil.” Working Paper Series No 1558.
Arezki, Rabah, Bertrand Candelon and Amadou N. R. Sy. 2011. “Sovereign Rating News and Financial Markets Spillovers: Evidence from the European Debt Crisis.” IMF Working Paper No 68.
25
Beltratti, Andrea and René M. Stulz. 2009. “Why did some banks perform better during the credit crisis? A cross-country study of the impact of governance and regulation.” NBER Working Paper No 15180.
Cameron, A. Colin and Pravin K. Trivedi. 2010. Microeconometrics using Stata, revised edition. Texas: Stata Press.
Chan-Lau, Jorge A., Estelle X. Liu and Jochen M. Schmittmann. 2012. “Equity Returns in the Banking Sector in the Wake of the Great Recession and the European Sovereign Debt Crisis.” IMF Working Paper No 174.
Duffie, Darrel. 2010. “The Failure Mechanisms of Dealer Banks.” Journal of Economic Perspectives. 24: 51-72.
Gordon, Gary B. and Andrew Metrick. 2010. “Securitized Banking and the Run on Repo.” Journal of Financial Economic.
Poeck, André Van and Maartje Wijffelaars. 2012. “Banking crises and sovereign debt build-up: implications for debt sustainability”. 30th SUERF Colloquium “States, Banks, and the Financing of the Economy.”: 7-8.
Reinhart, Carmen M. and Kenneth S. Rogoff. 2010. “From Financial Crash to Debt Crisis.” NBER Working Papers No 15795.
Ureche-Rangau and A. Burietz. 2012. “One crisis, two crises…the subprime crisis and the European sovereign debt problems.” Journal Economic Modelling, 35: 2-14; 19-25.
Young, Peter. 2006. “Industrial production and stock returns”. Project on Global Asset and Wealth Management MBA Program, Simon Fraser University.