1
Testing Classic Theories of Migration in the Lab#
Catia Batista, Nova School of Business and Economics, Universidade Nova de Lisboa David McKenzie, Development Research Group, The World Bank
April 13, 2018
Abstract
We use incentivized laboratory experiments to investigate how potential migrants make decisions between working in different destinations in order to test the predictions of different classic theories of migration. We test theories of income maximization, migrant skill-selection, and multi-destination choice and how the predictions and behavior under these theories vary as we vary migration costs, liquidity constraints, risk, social benefits, and incomplete information. We show how the basic income maximization model of migration with selection on observed and unobserved skills leads to a much higher migration rate and more negative skill-selection than is obtained when migration decisions take place under more realistic assumptions. Second, we find evidence of a home bias, where simply labelling a destination as “home” causes more people to choose that location. Thirdly, we investigate whether the independence of irrelevant alternatives (IIA) assumption holds. We find it holds for most people when decisions just involve wages, costs, and liquidity constraints. However, once we add a risk of unemployment and incomplete information, IIA no longer holds for about 20 percent of our sample.
Keywords: Migrant Selection, Destination Choice, Lab Experiment JEL Codes: F22, O15, C91.
# We thank Rui Mascarenhas and Matteo Ruzzante for excellent field coordination work in organizing and running
the lab sessions and data collection in Lisbon, and David Clarance and his team at the Busara Center for their collaboration on this work in Nairobi. Steven Stillman and participants at the AFD-World Bank Conference on Migration and Development and at the Rosenzweig Symposium provided helpful comments.
2
1. Introduction
Income differences across countries around the world are enormous, so that international migration provides the opportunity for those who move to dramatically increase their incomes (McKenzie et al. 2010; Clemens et al., forthcoming). Yet only 3.3 percent of the world’s population live outside their country of origin.1 Moreover, those who do migrate are positively selected on education from almost every sending country, despite returns to skill being higher in many developing countries than in OECD destinations (Grogger and Hanson, 2011). These patterns of low levels of migration and positive sorting on skills present a challenge to classic theories of migration decisions such as the income maximization approach of Sjaastad (1962) and the Roy-model selection approach of Borjas (1987).
The theoretical literature on migration choice has since evolved from a simple consideration of the income gained from moving to the cost of this move to also incorporate liquidity constraints, risk and uncertainty, imperfect information, and choices between multiple destinations. Different assumptions about how potential migrants trade-off these different factors can then give rise to different predictions as to how many individuals will move and to where. Empirically testing these theories is however difficult, given that these attributes are not distributed randomly across destinations or individuals.
We use incentivized laboratory experiments to test how potential migrants trade-off different location attributes and use this to distinguish between competing migration theories. We work with samples in Lisbon and Nairobi to examine how sensitive our results are to the study population. We randomly assign observed and unobserved skill levels, and endowments to potential migrants, and then have them make choices between destinations with different returns to skills. We vary the risk of unemployment, whether or not liquidity constraints bind, whether or not there is full information, and the number of destinations. Using the basic Sjaastad/Borjas model we would predict extremely high migration rates, with negative self-selection. Adding additional real world features like risk, liquidity constraints, and incomplete information dramatically lowers migration rates and makes selection less negative. We also document a home bias effect, where simply labelling a destination as home without changing the payoffs reduces migration to other destinations. Finally, we can directly investigate the independence of
3
irrelevant alternatives (IIA) assumption often made in modelling multi-destination migration decisions. We find IIA holds for most people when migration decisions just involve wages, costs, and possible liquidity constraints, but starts to break down for some individuals when risk and incomplete information are added. In the sample taken in Nairobi, we also find evidence to suggest some people make migration decisions based on cost minimization rather than income maximization. Taken together, we believe the results demonstrate the need to move beyond classic theories in order to explain the patterns we see in global migration.
This paper contributes to a literature that uses experimental methods to learn about migration (McKenzie and Yang, 2012; McKenzie 2015). Almost all of these experiments have involved policy experiments which vary migrant access to particular services such as financial education, bank accounts, or communication services (e.g. Ashraf et al., 2015; Batista and Narciso, 2018), or which attempt to facilitate migration (Bryan et al., 2014; Beam et al., 2016). This paper adds to a much more nascent literature that uses lab experiments. The first example comes from Baláž et al. (2014), who asked Slovak university students to make non-incentivized choices between destinations, to investigate how individuals trade-off economic attributes (wages and living costs) against non-economic factors (climate, crime levels, language difficulty, and personal freedom), varying whether individuals had full or incomplete information. They find that wages and costs are the most important attributes, but that these non-economic factors also matter. Barnett-Howell (2017) used a migration video game in a lab experiment to see how individuals make choices over destination search, finding a role for imperfect information in explaining lack of movement. Lagakos et al. (2017) use discrete choice experiments to examine how Bangladeshis trade-off wages, housing conditions, employment, and frequency of family visits. They find the quality of housing at destination to be an important determinant of the willingness to move internally. This literature complements our findings by highlighting the importance of looking beyond a simple comparison of wages and costs for understanding migration.
The remainder of the paper is structured as follows: Section 2 discusses our sample and the game set-up; Section 3 our key results for testing classic theories in the two destination version of the game; and Section 4 results when multiple migration destinations are available. Section 5 concludes.
4
2. Sample and Game Set-up
The peak age of international emigration from developing countries is between 22 and 24 years (McKenzie, 2008), with more educated individuals more likely to emigrate (Grogger and Hanson, 2011). We therefore choose for our lab experiments to focus on tertiary educated students in their final year of study. This gives us a sample of individuals who are among those with the highest likely of making international migration decisions in the near future. Within these criteria, we work with samples from two countries: Portugal and Kenya.
2.1 Lisbon Sample
The experimental subjects in the Lisbon sample were recruited in April and May 2017, and were final-year undergraduate students from the Nova School of Business and Economics. Recruitment took place through emails announcing the possibility to participate in a study about career prospects. These emails were sent directly by the school administration to all potential participants. Students are mostly Portuguese, with just over five percent from Lusophone Africa. Nova encourages students to study abroad for a semester in their fourth or fifth semester, and half the sample has spent six months or more outside of Portugal.
Table 1 summarizes some basic characteristics of the 154 students who took part in our lab experiments. The sample is 45 percent female, and ranges in age from 19 to 25, with a mean of 20.7. 58 percent are economics majors. At the time of participating, a few months before graduation, 19 percent had received a job offer for a post-graduation job, with 6 percent having a job offer outside of Portugal. This is a sample with high interest in migration, with 53 percent saying they would prefer to work outside of Portugal after graduation.
We gave participants a short test of 10 questions designed to measure basic mathematical skills (e.g. 37+0.5×64), and 10 questions designed to ensure they were able to calculate expected values (e.g 40% chance of winning 100€, 40% chance of winning 50€, 20% chance of winning 20€). The means were 9.6 and 9.3 out of 10, showing this group is comfortable making calculations that might be required in deciding between different destinations when risk is involved.
2.2 Nairobi Sample
The second sample consists of 265 final year students from Strathmore University and the University of Nairobi who took part in lab sessions conducted by the Busara Center in September and October 2017. These students majored predominantly in economics, management
5
studies, statistics and computer science. Nearly all students were born in Kenya, and only twelve percent has spent six months or more outside of the country. Table 1 summarizes some basic characteristics. As in the Lisbon sample, 45 percent of the Nairobi sample is female. Students tend however to be older, with a mean age of 22.7, ranging from 19 to 32. 32 percent are economics majors. At the time of participating, 19 percent had received a job offer for a post-graduation job (exactly the same proportion as in the Lisbon sample), although only 2 percent had a job offer outside of Kenya. This is also a sample with a relatively high interest in migration, although lower than in the Lisbon sample: 32 percent of subjects in the Nairobi sample say they would prefer to work outside of Kenya after graduation. They perform similarly to the Lisbon sample on the simple mathematical skills test (mean of 9.6 out of 10), but perform considerably worse on the expected values test (mean of 4.0 out of 10).
2.3 Game Set-up
Sessions took place in experimental labs, in twenty sessions of between two and thirteen students per session in Lisbon, and in 14 sessions ranging from five to thirty-five students in Nairobi. All games were programmed in z-tree. The session began with a short questionnaire to collect basic background information about each participant. They then played games on chance and probability to measure risk and ambiguity preferences (see Appendix 1). Then the main part of the session involved migration decisions. Participants were given the following instructions to motivate the choices they would be asked to make in the game:
We are interested in learning how people make decisions between different places to work. Imagine that you have just accepted a job offer from a multinational company which has branches around the world. Your employer has told you that you need to accept a company transfer to a different country for a year, but is offering you the choice between destinations. You should assume that everything else about the job and living conditions will be the same across destinations, apart from the information the employer tells you.
Some of the decisions will be very simple, since the only thing that will vary across the destinations will be the wage you are offered and the cost of moving. Others will be more complicated, since there will be chances of unemployment, you might not be able to afford the moving costs, or you might need to decide whether to pay to get all the information you need about the destination.
6
You will start the game with a certain endowment. You can use this money to pay the costs of moving, or to acquire information. This is reset for each decision. If we end up playing a game for real, any amount left from your endowment that you do not spend will be added to your game winnings.
You should make each decision as seriously as you can, since at the end of the game we will randomly choose one of your choices to play for real money (using an exchange rate of 1000 lab Euros to 10 real Euros).2
Each participant was randomly assigned a skill level s uniformly from {1, 2, 3}. This can be thought of as education, or observed skill in standard migration models. Then, as in Borjas (1987), individuals also have unobserved skills ed that additionally affect how they are paid in different migration destinations d. These are randomly drawn from {-200, 0, 200} and are assumed to be perfectly positively correlated for the same individual across destinations for most versions of the games, with the exception of a variant where they are set to zero, and one where they are perfectly negatively correlated. Individuals are also given a random endowment of wealth which is drawn as {50, 100}*s. This captures the empirical regularity that more educated people tend to also be wealthier on average.
Games were grouped into three blocks, each of nine games. Block 1 involved making choices between two different destinations, Block 2 choices among three different destinations, and Block 3 among five different destinations. The ordering of the blocks was randomized, as was the ordering and labelling of each destination within each game. Appendix Table 1 confirms that the programming successfully randomized the assignment of skill, endowment, unobserved skill, and module order.
In each game, participants must choose which destination to work in based on the wage w offered at that destination (which depends in turn on their observed and unobserved skill levels), the cost of moving to that destination, the risk of being unemployed, any social insurance paid if they are unemployed (which can be broadly understood as including any type of formal or informal support individuals receive from their network when unemployed), and whether or not their endowment is sufficient to cover the costs of moving. In some of the games there is
2 In Kenya we multiplied all the Euro numbers by 100 and then presented them in terms of Kenyan shilling
7
incomplete information, with participants only being told the distribution of possible unemployment and social insurance rates, but having the option to pay to have full information. In other variants the risk of unemployment is endogenous, depending on how many other people in the same lab session also decide to migrate to a destination. Table 2 describes the key parameters of the nine games in the block with just two destinations. We discuss these more in detail in the next section.
2.4 Testing Home Bias
We designed the games thinking of destination 1 as “home”, and other destinations as migration choices. However, we were concerned that the mere labelling of a destination as “home” might affect choices, regardless of pay-offs, and so in games 1 through 27 we referred to destinations as “destination 1”, “destination 2”, etc., randomizing at the individual level the ordering of which destination was labelled with each number in each game. In a final game, we explicitly tested for home bias by telling participants “now the multinational corporation allows you to continue working in your home country, while also giving an option to move to a destination abroad”. We set the cost of moving to be zero, and the monthly wage to be the same in both destinations. If labelling a destination as “home” had no effect on decisions, we would expect individuals to be invariant between the two destinations, and so choices to be equally split between the two3. However, we find that 58.4 percent of the Lisbon sample and 63.8 percent of the Nairobi sample chose the home destination, which t-tests show to be significantly different from 50 percent (p=0.0357 and p<0.0001 respectively). Moreover, we find choices in this game to be strongly correlated with their professed desire to work abroad after graduating in the baseline questionnaire: 32.1 percent of those who say they want to work abroad chose the home destination, versus 87.7 percent of those who say they want to remain in Portugal (p<0.0001). Likewise, 40 percent of those who want to work abroad in the Nairobi sample chose the home destination, versus 75 percent of those who say they want to remain in Kenya (p<0.0001). This shows the importance of not using the “home” label in our main game choices, but also suggests that choices in this last game may be predictive of actual future migration decisions – something we plan to test once we collect follow-up data to see whether individuals migrate.
3 Recall that order bias is not a concern here, since participants were randomly assigned to be asked “home or
8
3. Testing Classic Theories of Income Maximization and Migrant Self-Selection
We begin by examining how classic migration theories predict migration behavior in the two destination case. For participant i with randomly assigned skill level si, unobserved skill at destination 1 of e1i, and unobserved skill at destination 2 of e2i, the wages available at the two destinations were specified as:
𝑤1𝑖 = 500 + 300𝑠𝑖 + 3𝑒1𝑖 (1)
𝑤2𝑖 = 1000 + 100𝑠𝑖 + 𝑒2𝑖 (2)
As noted, we consider destination 1 as the home destination. There is thus no cost of moving to this destination and the participant always has full information about this destination and no risk of unemployment. Destination 2 has a higher base wage rate, but a lower return to both observed and unobserved skills. This mirrors the setting in many migrant countries of origin, where the returns to skill are greater at home, but base income levels are higher abroad. The cost of moving to destination 2 is set to be the same for all participants, and in particular, does not vary with skill level. We made clear to participants that this was a one period decision, so that although the wage was presented as a monthly wage to make it comparable to their real life framing, the cost of moving should also be thought of as a monthly equivalent. We then define migration as the decision to choose destination 2 instead of destination 1.
Participants were not told their s and e, but were instead told their endowment and the costs involved, and then presented with wage offers in both destinations. As a result, they did not have to calculate the wage they would earn given their observed and unobserved skill levels, but just make decisions based on wages and costs. A summary screen also summarized the key parameters for the decision (Appendix 2 provides example screenshots).
3.1 Income Maximization and Migrant Self-Selection
In the simplest classic theory of migration, individuals make a comparison of the benefits and costs of migrating (Sjaastad, 1962). In this view, the driving force behind migration is income maximization. In our first three games, this should be the only factor driving decisions, since there is full information, no liquidity constraints, and no risk of unemployment. In Lisbon, out of the 462 decisions made across the three games, 446 (96.5 percent) choose the income-maximizing option. However, more deviations from income maximization occurred in the Nairobi sample, where only 610 (76.7 percent) of the 795 decisions made across the three games were the income-maximizing choice.
9
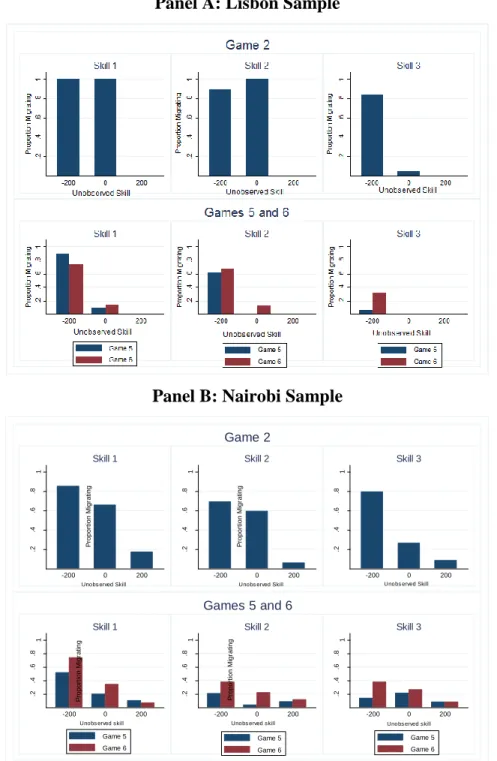
In game 1, there is no unobserved skill, and the cost of moving is 50 euros.4 Theory would then predict that all of those with skill levels 1 and 2 should migrate, while none of those with skill level 3 should. That is, there should be negative self-selection by skill. The top left panel of Figure 1 plots the actual migration rates in the Lisbon sample of 96.5% of those assigned skill level 1, 88.6% of those assigned skill level 2, and 1.9 percent of those assigned skill level 3. In Nairobi, the rates are 68.1% of those assigned skill level 1, 51.1% of those assigned skill level 2, and 10.7% of those assigned skill level 3. Borjas (1987) introduced the importance of also considering self-selection on unobserved skills. The remaining games allow for this possibility, and equations (1) and (2) show that the return to unobserved skills is also higher at home than at destination. In game 2, the unobserved skills are perfectly correlated at home and abroad, while in game 3 they are perfectly negatively correlated.5 In both cases, the migration predictions are the same: the high return to unobserved skills at home should induce those with observed skill level 1 or 2 who have high unobserved skills not to migrate, while inducing those with low unobserved skills to migrate from skill level 3. This is seen in Figure 2. If we look at the impact on self-selection with regard to observed skills, the top middle and top right panels of Figure 1 show that there is less migration than was the case in game 1, and that it is less negatively selected, with maximum migration rates occurring in the middle of the observed skill distribution.
3.2 Why aren’t some people income maximizing?
Income maximization holds for almost all the Portuguese sample. However, one quarter of the decisions made in the first three games for the Nairobi sample do not show income maximization. This is particularly notable in Game 1, where 31 percent do not income maximize. Faced with this pattern, we randomly chose 41 individuals who had not maximized income in one of their choices in our later sessions in Nairobi, and did a qualitative debrief with them to ask why. Almost all these participants said that a desire to avoid costs was their reason for their choice. For example, one noted “as I am a student you make sure you avoid costs, you don’t know what can come from them”. This idea of cost-minimization as the key reason for not
4
For simplicity of exposition, we discuss payoffs for the Euro framing in the text: in Nairobi these were all multiplied by 100 and presented as Kenyan Shilling amounts.
5 The difference is in where the individuals end up in the destination wage distribution. Game 3 is an example of
Borjas’ refugee sorting, in which migrants are negatively selected from the home country wage distribution in terms of unobservable characteristics, but end up positively selected relative to the destination country wage distribution.
10
maximizing income is supported by the data. Out of the 84 individuals who did not maximize income in Game 1, 75 of those assigned skill levels 1 and 2 did so by choosing to avoid the higher wage destination 2 that involved a moving cost, while only 9 of those assigned skill level 3 did not maximize income by choosing to pay the cost and go to destination 2, even though destination 1 would have maximized income.6 Taken together, this qualitative and quantitative evidence supports the idea that non-income-maximization was the desired choice, and not simply the result of participants making random choices or hitting the wrong button.
3.3 Introducing Liquidity Constraints and Risk
There are no liquidity constraints in either Sjaastad (1962) or Borjas (1987), with all those who wish to migrate able to do so. We introduce liquidity constraints in Game 4 by increasing the cost of moving to 100, and otherwise keeping the game the same as in Game 2. Recall that endowments are randomly assigned as {50, 100}*s. Therefore, all of those with skill level 1 that receive an endowment of 50 are not able to migrate, even though they would not like to. This halves the migration rate of those in the Lisbon sample with skill level 1 from 72% in Game 2 to 35% in Game 4 (p<0.001); and also halves the rate in the Nairobi sample from 56% in Game 2 to 27% in Game 4 (p<0.001) The higher cost also lowers the return to migration, so that individuals with skill level 2 and unobserved skill 0 are now indifferent between the two destinations. This lowers the migration rate in Lisbon of skill level 2 from 70% in Game 2 to 52% in Game 4 (p=0.019), and in Nairobi from 42% in Game 2 to 30% in Game 4 (p=0.016). In contrast, it should not affect the migration decisions of those with skill level 3, and indeed the migration rate for them is similar in Game 4 (28%) and Game 2 (32%) in Lisbon (p=0.16), although the rate is slightly lower in Game 4 (30%) than in Game 2 (37%) in Nairobi (p=0.057). The overall result is that liquidity constraints have lowered migration rates, and made migration less negatively selected than the standard Borjas model would predict.
The Sjaastad and Borjas models also contain no risk of unemployment. Harris and Todaro (1970) introduced the risk of unemployment, and model individuals as choosing whether to migrate or not on the basis of maximizing expected earnings. In Game 5, we introduce a 30 percent chance of unemployment at destination 2, with those who are unemployed receiving unemployment
6 We also examined whether non-game characteristics of individuals help predict this behavior by running a probit
of not maximizing income as a function of the characteristics in Table 1. We cannot reject that these characteristics are jointly orthogonal to whether or not someone does not maximize income (p=0.501).
11
insurance of 200 (this could be thought of as informal insurance from family and network members in situations where migrants are not eligible for formal benefits). 92.2 percent of participants in Lisbon and 77.0 percent in Nairobi then maximize expected earnings in the resulting game. This chance of unemployment lowers the attractiveness of migration relative to Game 2, and should make it more negatively selected with respect to both observed and unobserved skill. We see this in Figures 1 and 2. In the Lisbon sample, the migration rate has fallen from 72% to 35% for skill level 1, from 70% to 25% for skill level 2, and from 32% to 2% for skill level 3. Almost all the migration comes from low-skilled individuals with low unobserved skills. In Nairobi, the migration rate falls from 56% to 26% for skill level 1, from 42% to 11% for skill level 2, and from 37% to 13% for skill level 3.
An alternative way to allow for the risk of unemployment is to make it endogenous. Let N be the number of people in the lab session. In game 6, we fixed the number of jobs J available at destination 2,7 and participants were told that if more than J out of the N people in the lab chose to move to destination 2, the jobs would be randomly assigned and the remainder would be unemployed. Figure 2 shows this endogenous unemployment setting leads to a similar pattern of negative selection on unobserved skill as in Game 5, except in inducing some individuals with skill level 3 and the lowest unobserved skill level to migrate. This makes the overall migrant selection on skills in Figure 1 less negative than in Game 5.
We elicit from participants how many people they think will move to destination 2, and use this to calculate expected earnings. Only 65.6 percent in Lisbon and 64.9 percent in Nairobi maximize expected earnings in this version of the game. In Lisbon, 92 percent of those not maximizing expected earnings are choosing not to migrate, even though they expect positive gains from doing so; while in Nairobi this is the case for 69 percent of those not maximizing expected earnings.
3.4 Risk Preferences and Risky Migration Decisions
The “new economics of labor migration” theory notes that once risk is introduced into migration decision-making, risk-preferences should also matter (Stark and Bloom, 1985; Rosenzweig and Stark, 1989). We take the sub-sample of participants in Games 5 and 6 for whom risk
7 We varied J according to the size of the session: J was set as 2 if N≤5; J=3 for N between 6 and 10; J=4 for N
between 11 and 15; J=5 for N between 16 and 20; J=6 for N between 21 and 25; J=7 for N between 26 and 30; and K=8 for N>30
12
preferences should in theory enter into their migration decisions8, and in Table 3 estimate probit models to test whether measures of risk preferences help predict which individuals choose to migrate. In Lisbon, all three measures of risk-seeking preferences are positively associated with migrating in Game 5, with two out of the three significant, as is the first principal component of all three measures. In contrast, migration behavior is more difficult to predict in Game 6 (with endogenous unemployment), and although the first principal component of the risk preference measures is positive, it is smaller in size than for Game 5, and not statistically significant. The Dohmen et al. (2011) risk preference measure is significant at the 5 percent level in the Lisbon sample, and is the only risk preference measure correlated with behavior in the Nairobi sample. 75 percent in Lisbon and 84 percent in Nairobi of those who do not migrate in Game 6, even though they have positive expected returns from doing so, are risk averse according to the Dohmen et al. measure.
3.5 Introducing Incomplete Information
All of these different models about migration discussed so far assume that individuals have full information when calculated expected returns from migration. However, it is difficult and costly to acquire information about destinations abroad, and there is evidence that migrants in different contexts can have incorrect information (McKenzie et al, 2013; Shrestha, 2017; Batista and Bah, 2018). Game 7 introduces this element of incomplete information into migrant decision-making by adding uncertainty over the chance of unemployment at destination 2, and over the unemployment insurance that would be received in case of unemployment. Participants can then pay to acquire information about the actual odds. In particular, they are told that the chance of unemployment is either 10%, 30%, or 50%; and that unemployment insurance will either be 100, 200, or 300. They can either make their migration decision without paying for this information, or pay 25 for each piece of information they want and then make their decision. The endowment for this game is set at 100*s for everyone, so that all players can pay both the cost of moving and the costs of acquiring all available information if they so wish.
It is not optimal for individuals with unobserved skills of 200, or with unobserved skill 0 and skill levels 2 or 3, to pay for information, yet we find 6.6 percent of them in Lisbon do and 42.4 percent in Nairobi do. In Lisbon, 82.1 percent of the remaining participants pay for some
8 In these games it is strictly dominant for those with unobserved skill level of 200 to never migrate, and this is also
13
information: 78 percent for the unemployment risk, and 41 percent to learn the amount of unemployment insurance. In Nairobi, 55.8 percent pay for some information: 47 percent for the unemployment risk and 35 percent to learn the amount of unemployment insurance. We measured ambiguity-aversion (see Appendix 1) and test whether this predicts who pays for information among the subsample for which paying for information can be optimal. In Lisbon, 84.1 percent of the ambiguity-averse pay for information, compared to 79.4 percent of those not ambiguity-averse, but this difference is not statistically significant (p=0.599). Likewise the difference is not statistically significant in Nairobi (57.1 percent for the ambiguity averse compared to 54.7 percent for those not ambiguity-averse (p=0.789)).
The bottom left panel of Figure 1 then shows how the addition of incomplete information changes the scale and skill distribution of migrants. In Lisbon, the overall migration rate is 31.8 percent, compared to only 20.1 percent in Game 5 which had the same expected change of unemployment and same expected insurance rate. In Nairobi the overall migration rate rises from 17.0 percent in Game 5 to 22.7 percent in Game 7. The ability to pay for information allows some individuals to find out if they will be lucky and experience a lower chance of unemployment or higher benefits, thereby inducing more to migrate. This is particularly important for the high-skilled (skill level 3), of whom only 1.9 percent migrated in Game 5 in Lisbon, compared to 20.8 percent in Game 7. In Nairobi, it rises from 13.1 percent in Game 5 to 20.5 percent in Game 7. This makes migration less negatively selected.
3.6 Putting it all together
Games 8 and 9 then combine all the different elements that cause real-life migration decisions to deviate from the basic income maximization model of Sjaastad that was played in Game 1. Game 8 adds the possibility of liquidity constraints to Game 7, by returning the endowment to {50,100}*s, so that those with skill level 1 and endowment of 50 cannot afford to purchase information if they wish to migrate. This lowers the migration rate from 31.8 percent in Game 7 to 27.3 percent in Game 8 in Lisbon, and from 22.7 percent in Game 7 in Nairobi to 17.1 percent in Game 8, and increases the degree of intermediate skill-selection.
Game 9 adds the possibility of liquidity constraints to Game 6 (endogenous unemployment), by raising the cost of moving to 100 instead of 50. This halves the migration rate from 24.0 percent in Game 6 to 12.3 percent in Game 9 in Lisbon, with the largest impacts for skill levels 1 and 2.
14
This makes migration less negatively selected. In Nairobi, the fall is more modest, from 27.9 percent migration in Game 6 to 23.4 percent in Game 9.
As noted in the introduction, a key puzzle for basic migration theories is why so few people migrate, and why migrants are not more strongly negatively selected on skill from many countries. Through adding more and more realistic features to our migration decision games, we see why. In Lisbon, migration rates for the low-skilled were 97 percent in Game 1, and have fallen to 10.5 percent in Game 9, and the resulting skill pattern of migration is much more of an intermediate skill-selection. In Nairobi, the migration rate for the low-skilled fell from 68.1 Percent in Game 1 to 23.1 percent in Game 9.
4. Testing Multi-Destination Choice
In practice migrants make choices among multiple possible destinations in many cases. This raises two key issues in the literature. The first is how they sort across destinations, as in Dahl’s (2002) multidimensional Roy model. Grogger and Hanson (2011) find positive sorting on skill within OECD countries, with countries with higher returns to education attracting more educated workers on average. The second issue is how the addition of more destinations affects the choice between the original two destinations. Many studies in the literature (e.g. Grogger and Hanson, 2011) have made the independence of irrelevant alternatives (IIA) assumption. This assumption requires that adding a third (or more) destination does not affect the relative odds of choosing between the first two destinations. Bertoli and Fernández-Huertas Moraga (2013) question this assumption, arguing instead that migration rates between a dyad represented by an origin and a destination country do not depend solely on the attractiveness of both, but also on how this relates to the opportunities to move to other destinations. We test these ideas in our second and third game blocks, by adding additional destinations.
4.1 Three Destinations
The second block of games repeats games 1 through 9, with the addition of a third destination. Wages at destination 3 are determined by:
𝑤3𝑖 = 200 + 400𝑠𝑖 + 4𝑒3𝑖 (3)
We set 𝑒2𝑖 = 𝑒3𝑖 so that unobserved skills are the same in both migrant destinations. Note then that this third destination has a higher return to observed and unobserved skills than either destination 1 (home) or destination 2, but a lower base wage rate than either. The cost of moving to destination 2 is also higher (100)
15
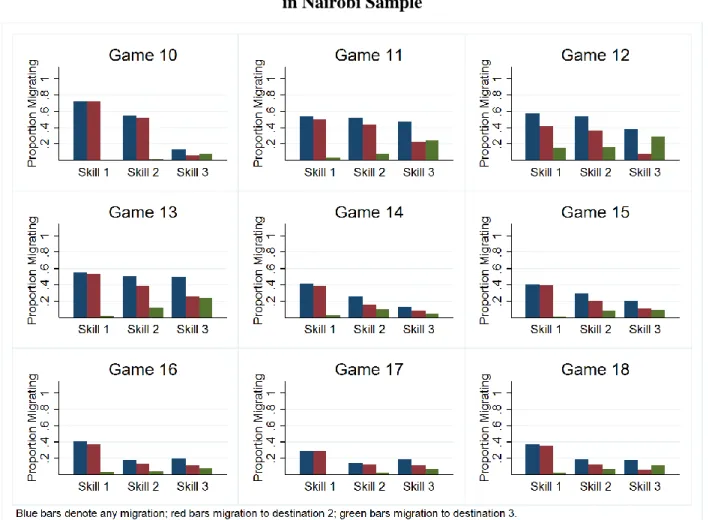
Figures 3a and 3b shows the resulting migration choices across the nine games for the Lisbon and Nairobi samples respectively. We consider both whether or not the individual chooses to migrate at all (blue bars), as well as where they choose to migrate (red and green bars). We see a number of similarities with the two destination case: high rates of migration and negative skill-selection in the basic game, with the migration rates then falling and more intermediate skill-selection on observed skills as we add additional real-life features to the migration decision. We see positive sorting amongst destinations in the way predicted by basic theory – higher-skilled individuals are relatively more likely to migrate to destination 3, which has the highest return to skill. Unlike in the case of Game 2 vs Game 3, we do see very different migration patterns in Game 11 vs Game 12 in the Lisbon sample. In Game 11, with perfect positive correlation between unobserved skill at home and abroad, we see that only those with high observed skill level 3 migrate to destination 3. In contrast, in Game 12, the negative correlation between unobserved skill at home and abroad combined with the high return to unobserved skill at destination 3 leads to more migration to destination 3 from all skill categories. In Game 13, adding liquidity constraints to Game 11, migration to the more expensive destination 3 is reduced for those with lower skill levels (and hence lower endowments on average). The Nairobi sample shows qualitatively similar results, although, as with the two destination version, with more deviations from income maximization, which seem to reflect the desire of some individuals to minimize costs.
4.2 Five Destinations
The third block of games adds destinations 4 and 5 with wages determined by:
𝑤4𝑖 = 900 + 100𝑠𝑖+ 𝑒4𝑖 (4)
𝑤5𝑖 = 100 + 400𝑠𝑖 + 4𝑒5𝑖 (5)
Where the cost of moving to destination 4 is 50, and to destination 5 is 100; and 𝑒2𝑖 = 𝑒3𝑖 =
𝑒4𝑖 = 𝑒5𝑖. Note that destination 4 then costs the same to migrate to as destination 2, and always
pays a wage of 100 less; and destination 5 costs the same to migrate to as destination 3, and always pays a wage of 100 less. The only reason to choose either destination will then be in games with a risk of unemployment, if the risk of being unemployed is lower in one of these destinations, or the unemployment insurance higher.
Figures 4a and 4b show the resulting migration choices across the five locations in each of the nine games. We again see both the scale of migration and the skill selectivity pattern vary across
16
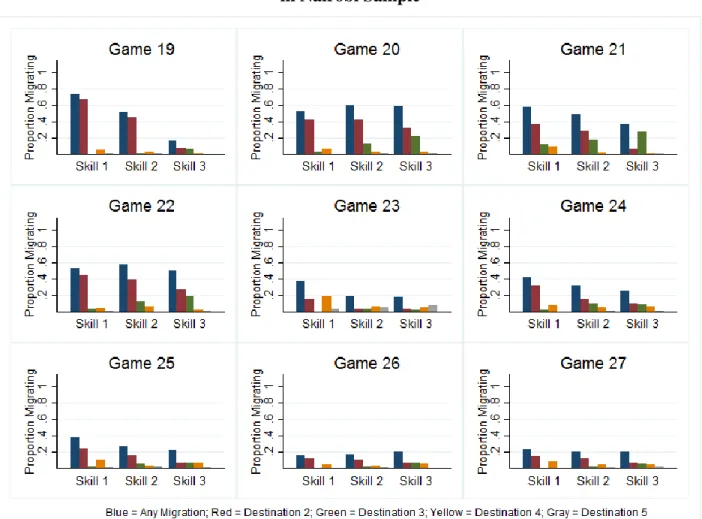
games. The decisions in Games 19 to 22 look similar to those in Games 10 to 13, suggesting that the addition of two irrelevant destinations did not change migration choices. We test this formally in the next sub-section. In Game 23 the unemployment rate in destination 4 is set at 20%, which is lower than the 30% in destination 2, so here we do see switching of destinations compared to Game 14. In Game 24, we see some strategic choices, where some participants choose the lower wage destination 4 instead of 2, believing that less people will move there and so the chance of unemployment will be lower. This increases the overall migration rate in the Lisbon sample in Game 24 to 38.3 percent, compared to 28.6 percent in Game 15. In Nairobi the increase is smaller, from 30.2 percent in Game 15 to 33.2 percent in Game 24.
In Game 25 there are potentially 8 pieces of information individuals can pay to acquire (the unemployment rate and unemployment insurance amount for each of the four destinations). The endowment was set to 100*s+200 for this game, so that all participants could afford to purchase full information if they wish, and still have enough money left to move to their destination choice. However, only 55 percent in Lisbon and 58 percent in Nairobi purchase any information. Not a single individual in Lisbon purchases full information: the maximum is 5 pieces of information, and the median, conditional on purchasing, is 2 pieces. In contrast, 7.9 percent in Nairobi purchase all 8 pieces of information, and the median conditional on purchasing is 3 pieces of information. The most common piece of information purchased was the unemployment rate in destination 2 (46 percent in Lisbon and 35 percent in Nairobi purchased this), followed by the unemployment rate in destination 4 (35 percent in Lisbon and 31 percent in Nairobi purchased this), with fewer than 2 percent in the Lisbon sample purchasing any information about destination 5 (although 23 percent in Nairobi purchased some information about destination 5). This shows not all individuals are able to filter out irrelevant choices when deciding where to acquire information about migration destinations.
4.3 Which Features Matter Most for Changing the Level and Skill Selectivity of Migration?
We stack the migration decisions of individuals across the 27 games and then run a probit to investigate which features of the games are most associated with lowering the level of migration from the high rates seen in Game 1, and for changing the skill selectivity. Table 4 reports the results. We see qualitatively similar results across the two samples, although some of the magnitudes are larger in the Lisbon sample given that the Nairobi sample was migrating less to begin with in Game 1.
17
The feature that reduces migration levels most is adding either an exogenous or endogenous risk of unemployment in the migration destination. This lowers the migration rate by more than 40 percentage points for the Lisbon sample, and by 19 (endogenous risk) to 26 (exogeneous risk) percentage points in the Nairobi sample. Liquidity constraints lower migration rates by 6 to 10 percentage points, and migration rates decrease with observed and unobserved skill levels in our game, reflecting the higher returns to skill at home than abroad. Notably both the risk of unemployment and liquidity constraints lower migration more for the low-skilled than for high-skilled individuals, making migration less negatively skill-selected.
In contrast, we see migration rates are higher when there are more destinations to choose amongst. Incomplete information acts to increase the migration rate in the Lisbon sample, because individuals have the opportunity to pay the costs of overcoming this lack of information and discovering that the odds of unemployment are lower than the 30 percent average rate specified in our complete information setting.
4.4 Testing IIA
Independence of irrelevant alternatives requires that if destination 2 is preferred over destination 1 in the two-destination game, then introducing additional destination choice 3 (or choices 3, 4 and 5) should not make destination 1 preferable to destination 2. We examine whether IIA holds in Figure 5, plotting the proportion of individuals choosing to migrate to destination 2 in each game out of all those choosing either destination 1 or destination 2; and in Table 5, which summarizes the proportion of individuals who change their relative ranking of destination 1 versus destination 2 when more destinations are added.
We see from the top row of Figure 5 and from the first three columns of Table 5 that IIA holds for almost everyone in the basic Sjaastad and Borjas games in the Lisbon sample: 95 to 99 percent of participants do not change their migration decision between destinations 1 and 2 when a third, or a third, fourth, and fifth, destination is added. Adding liquidity constraints and an exogenous risk of unemployment still results in IIA holding for 90 to 95 percent of participants in variants of Games 4 and 5 in Lisbon. In contrast, we see 12 to 22 percent of participants violating IIA in these simple settings in the Nairobi sample. These violations of IIA are linked to individuals being inconsistent in choosing cost minimization over income maximization.
IIA starts to break down for some people in Lisbon under two of our settings. The first is when the risk of unemployment is endogenous. Here, adding a third or more destinations raises the
18
possibility that others who would have migrated to destination 2 now migrate to destination 3, 4, or 5, thereby reducing the risk of unemployment at destination 2. This results in 12-14 percent of participants changing their ranking of destination 1 versus destination 2 in Games 15 and 24 versus Game 6, and in Game 24 versus Game 15. 17-18 percent of participants in Nairobi also change their ranking here, but this is no higher than it was in the simpler games. The second factor is the addition of incomplete information. We see approximately 20 percent of participants in Lisbon changing their choice of destination 1 versus destination 2 when more destinations are added to Games 7 and 8. One reason for this is that the addition of more destinations with incomplete information causes individuals to change whether or not they decide to pay to acquire information about destination 2: 19 percent of individuals made a different choice as to whether to pay to know what the unemployment rate was in destination 2 when they faced a choice of five destinations versus two destinations. In Nairobi, 16-22 percent of participants change their rankings in these games with incomplete information.
We investigate what predicts violation of IIA by estimating probits where the outcome is coded as one if the destination choice between destinations 1 and 2 switches in either the 3- or 5-destination version of the game compared to the 2-5-destination version, and zero if it stays the same. We stack the data to form a panel of choices for each individual, and then cluster standard errors at the individual level. Column 1 of Table 6 then shows that the probability of IIA being violated in Lisbon does not significantly increase when we add liquidity constraints to the basic game, but does when we add risk (either endogenous or exogenous), and incomplete information. Column 2 then controls for the assigned skill and unobserved skill levels of the participant. Since the return to skill is higher at destination 1 than destination 2, those with higher skill levels are less likely to want to migrate at all, so less likely to violate IIA by choosing migration in at least one game. Column 3 adds non-game attributes of the individual: we see that violation of IIA is not correlated with gender, desire to migrate, ambiguity aversion or risk preferences. Finally, column 4 restricts to skill levels 1 and 2, who have the most incentives to migrate, with results similar for this sample, except for weakly significant evidence that ambiguity-averse individuals are more likely to violate IIA.
Columns 5 to 8 repeat the same analysis for the Nairobi sample. Here we see that introducing liquidity constraints in the game does reduce violations of IIA. This occurs because it physically prevents some individuals from choosing the migration option, so there is no possibility for them
19
to change this decision when an additional (irrelevant) destination is added. This differs from the Lisbon case because there were so few violations of IIA in the basic game in Lisbon for liquidity to effect. In contrast to Lisbon, adding exogenous risk reduces violations of IIA in Nairobi. The reason here seems less about the complexity of the decision being made, but rather than adding exogenous risk made migration less appealing, so that people would be more strongly attached to destination 1. We do again see that adding incomplete information leads to more violations of IIA. We do not find any correlation between violations of IIA and non-game attributes of the individual. In particular, we noted that one difference between the two samples was much worse performance on expected value questions in Nairobi. However, it is not the case that those who are better at such calculations are less likely to violate IIA.
5. Conclusions
The preliminary results suggest the promise of laboratory experiments to help us better understand migration-decision making behavior. We have four key results:
1) Adding real world features which take account of liquidity constraints, risk and uncertainty, and incomplete information to the Sjaastad/Borjas model makes a huge difference in terms of predicting the rate of migration and the selection pattern. The largest impact comes from adding risk (of unemployment) to the migration outcome. 2) Simply labelling a destination as “home” makes individuals more likely to choose it,
holding wages and costs constant. This is particularly the case for individuals who say they are not interested in migrating. In principle this might be used in follow-up games to back out the value individuals place on home, and as a predictor of whether individuals will migrate in real life.
3) The independence of irrelevant alternatives (IIA) assumption which underlies many models of multi-destination migration choices holds well for simple migration decisions that just involve comparisons of costs and wages in a developed country setting, but even in these simple cases, violations occur for 14-21 percent of our sample in Nairobi. Moreover, when the risk of unemployment and incomplete information are added, IIA no longer holds for 20 percent of people in our game in Lisbon.
20
4) Even in the simplest settings, people do not always make the destination choice which maximizes net income. Instead, cost minimization seems to be a key decision factor in the migration decision for individuals in the Nairobi sample.
In addition to improving our understanding of the factors affecting migration decisions, these results also shed light on why observed migration is lower than could be expected. The implications are important for the design of migration policies: they highlight that it cannot be simplistically assumed that physical or legal barriers to migration are the only impediments to migration, and more comprehensive approaches are required to influence migration behavior. This is ongoing work. Follow-up surveys of the participants will help determine whether migration decisions in the lab games are predictive of real-life migration behavior.
21
References
Ashraf, Nava, Diego Aycinena, Claudia Martínez A. and Dean Yang (2015) “Savings in Transnational Households: A Field Experiment among Migrants from El Salvador”, Review of Economics and Statistics, 97(2): 332-351.
Bah, Tijan, and Catia Batista (2018). “Understanding the Willingness to Migrate Illegally: Evidence from a Lab in the Field Experiment”. Mimeo, NOVAFRICA, Universidade Nova de Lisboa.
Baláž, Vladimir, Allan Williams and Elena Fifeková (2014) “Migration decision making as complex choice: eliciting decision weights under conditions of imperfect and complex information through experimental methods”, Population, Place and Space 22: 36-53.
Barnett-Howell, Zach (2017) “Should I stay or should I go? Microeconomic determinants of migration”, Mimeo. University of Wisconsin.
Batista, Catia, and Gaia Narciso (2018). “Migrant Remittances and Information Flows: Evidence from a Field Experiment”, World Bank Economic Review, 32 (1): 203–219.
Beam, Emily, David McKenzie and Dean Yang (2016) “Unilateral Facilitation Does Not Raise International Labor Migration from the Philippines”, Economic Development and Cultural Change, 64(2): 323-68
Bertoli, Simone and Jesús Fernández-Huertas Moraga (2013) “Multilateral resistance to Migration”, Journal of Development Economics 102: 79-100.
Borjas, George (1987) “Self-selection and the earnings of immigrants”, American Economic Review 77: 531-53.
Bryan, Gharad, Shyamal Chowdhury, and Ahmed Mushfiq Mobarak (2014). “Underinvestment in a Profitable Technology: The Case of Seasonal Migration in Bangladesh”, Econometrica, 82: 1671-1748.
Clemens, Michael, Claudio Montenegro and Lant Pritchett (forthcoming) “Bounding the Price Equivalent of Migration Barriers”, Review of Economics and Statistics.
Dahl, Gordan (2002) “Mobility and the return to education: testing a Roy model with multiple markets”, Econometrica 70(6): 2367-2420.
22
Dohmen, Thomas, Armin Falk, David Huffman, Uwe Sunde, Jürgen Schupp and Gert Wagner (2011) “Individual risk attitudes: measurement, determinants and behavioral consequences”, Journal of the European Economic Association 9 (3), 522–550.
Eckel, Catherine and Philip Grossman (2002) “Sex differences and statistical stereotyping in attitudes toward financial risk”, Evolution and Human Behavior 23 (4), 281–295.
Gneezy, Uri and Jan Potters (1997) “An experiment on risk taking and evaluation periods” Quarterly Journal of Economics 112 (2), 631–645.
Grogger, Jeffrey and Gordon Hanson (2011) “Income Maximization and the Selection and Sorting of International Migrants”, Journal of Development Economics 95(1): 42-57.
Harris, John and Michael Todaro (1970) “Migration, Unemployment, and Development: a Two-sector Analysis”, American Economic Review 60(1): 126-42.
Lagakos, David, Mushfiq Mobarak and Michael Waugh (2017) “The Welfare Effects of Encouraging Rural-Urban Migration”, Mimeo. Yale.
McKenzie, David (2008) “A Profile of the World’s Young Developing Country International Migrants”, Population and Development Review 34(1): 115-135.
McKenzie, David (2015) “Learning About Migration Through Experiments”, pp. 68-82 in Christian Dustmann (ed.) Migration: economic change, social challenge. Oxford University Press, Oxford, UK.
McKenzie, David, John Gibson and Steven Stillman (2010) “How Important is Selection? Experimental vs. Non-Experimental Measures of the Income Gains from Migration.” Journal of the European Economic Association 8 (4) : 913–45.
McKenzie, David, John Gibson and Steven Stillman (2013) “A land of milk and honey with streets paved with gold: Do emigrants have over-optimistic expectations about incomes abroad?”, Journal of Development Economics 102: 16-127.
McKenzie, David and Dean Yang (2012) “Experimental Approaches in Migration Studies”, in Carlos Vargas-Silva ed. Handbook of Research Methods in Migration. Edward-Elgar.
Rosenzweig, Mark and Oded Stark (1989) “Consumption smoothing, migration, and marriage: Evidence from rural India”, Journal of Political Economy 97(4): 905-26.
Shrestha, Maheshwor (2017) “Get rich or die tryin’: Exploiting imperfect information to estimate the value of statistical life of potential work-migrants from Nepal”, Mimeo. World Bank.
23
Sjaastad, Larry A (1962) “The Costs and Returns of Human Migration.” Journal of Political Economy, 70(5): 80–93.
Stark, Oded, and David E. Bloom (1985) “The New Economics of Labor Migration.” American Economic Review: Papers and Proceedings, 75(2): 173–178.
24
Figure 1: Rate of Migration and Migration Skill-Selection in Two Destination Games in Lisbon Sample (Blue) and Nairobi Sample (Red)
Notes: the return to observed and unobserved skills are held constant across the nine games. Game 1 is the basic Sjaastad (1962) migration decision; positively correlated (Game 2) and negatively correlated (Game 3) unobserved skills at home and abroad are introduced in Games 2 and 3 as in Borjas (1987); Game 4 incorporates the possibility of liquidity constraints; Game 5 introduces the chance of unemployment at the migration destination; Game 6 includes endogenous unemployment which depends on how many others move; Game 7 has the risk of unemployment with incomplete information about this risk , but the possibility of paying to know what the risk is; Game 8 adds the possibility of liquidity constraints to Game 7; and Game 9 adds the possibility of liquidity constraints to Game 6. .2 .4 .6 .8 1 P ro p o rt io n M ig ra ti n g
Skill 1 Skill 2 Skill 3
Game 1 .2 .4 .6 .8 1 P ro p o rt io n M ig ra ti n g
Skill 1 Skill 2 Skill 3
Game 2 .2 .4 .6 .8 1 P ro p o rt io n M ig ra ti n g
Skill 1 Skill 2 Skill 3
Game 3 .2 .4 .6 .8 1 P ro p o rt io n M ig ra ti n g
Skill 1 Skill 2 Skill 3
Game 4 .2 .4 .6 .8 1 P ro p o rt io n M ig ra ti n g
Skill 1 Skill 2 Skill 3
Game 5 .2 .4 .6 .8 1 P ro p o rt io n M ig ra ti n g
Skill 1 Skill 2 Skill 3
Game 6 .2 .4 .6 .8 1 P ro p o rt io n M ig ra ti n g
Skill 1 Skill 2 Skill 3
Game 7 .2 .4 .6 .8 1 P ro p o rt io n M ig ra ti n g
Skill 1 Skill 2 Skill 3
Game 8 .2 .4 .6 .8 1 P ro p o rt io n M ig ra ti n g
Skill 1 Skill 2 Skill 3
25
Figure 2: Borjas Selection on Unobserved Skills with and without Unemployment Risk Panel A: Lisbon Sample
Panel B: Nairobi Sample
Notes: Unobserved skill at home and abroad is perfectly positively correlated, and is randomly assigned at the individual level as one of -200, 0, or 200. Game 2 is a basic migration decision between two destinations with positively correlated unobserved skills at home and abroad as in Borjas (1987). The return to both observed and unobserved skills is higher at home than abroad. Game 5 introduces a 30% chance of unemployment at the migrant destination, with social benefit 200, compared to Game 2 where there is no unemployment. Game 6 makes the unemployment rate endogenous, depending on how many other individuals in the lab session also choose to migrate.
.2 .4 .6 .8 1 P ro p o rt io n M ig ra ti n g -200 0 200 Skill 1
Unobs erved Skill
.2 .4 .6 .8 1 P ro p o rt io n M ig ra ti n g -200 0 200 Skill 2
Unobs erved Skill
.2 .4 .6 .8 1 P ro p o rt io n M ig ra ti n g -200 0 200 Skill 3
Unobs erved Skill
Game 2 .2 .4 .6 .8 1 P ro p o rt io n M ig ra ti n g -200 0 200 Skill 1 Game 5 Game 6
Unobs erved skill
.2 .4 .6 .8 1 P ro p o rt io n M ig ra ti n g -200 0 200 Skill 2 Game 5 Game 6
Unobs erved skill
.2 .4 .6 .8 1 P ro p o rt io n M ig ra ti n g -200 0 200 Skill 3 Game 5 Game 6
Unobs erved skill
26
Figure 3a: Rate of Migration and Migration Skill-Selection in Three Destination Games in Lisbon Sample
Notes: Games are similar to those in Games 1 to 9, with the addition of a third destination (destination 3), that has a lower base wage, but higher return to observed and unobserved skills than migrant destination 2. The return to observed and unobserved skills are held constant across the nine games. Game 10 is the basic Sjaastad (1962) migration decision; positively correlated (Game 11) and negatively correlated (Game 12) unobserved skills at home and abroad are introduced in Games 11 and 12 as in Borjas (1987); Game 13 incorporates the possibility of liquidity constraints; Game 14 introduces a known chance of unemployment at the migration destination, which is randomly drawn from {10%, 30%, 50%} for each player for each destination; Game 15 includes endogenous unemployment which depends on how many others move to each destination; Game 16 has the risk of unemployment with incomplete information about this risk, but the possibility of paying to know what the risk is; Game 17 adds the possibility of liquidity constraints to Game 16; and Game 18 adds the possibility of liquidity constraints to Game 15 and incomplete information about unemployment insurance which participants can choose to purchase.
27
Figure 3b: Rate of Migration and Migration Skill-Selection in Three Destination Games in Nairobi Sample
Notes: Games are similar to those in Games 1 to 9, with the addition of a third destination (destination 3), that has a lower base wage, but higher return to observed and unobserved skills than migrant destination 2. The return to observed and unobserved skills are held constant across the nine games. Game 10 is the basic Sjaastad (1962) migration decision; positively correlated (Game 11) and negatively correlated (Game 12) unobserved skills at home and abroad are introduced in Games 11 and 12 as in Borjas (1987); Game 13 incorporates the possibility of liquidity constraints; Game 14 introduces a known chance of unemployment at the migration destination, which is randomly drawn from {10%, 30%, 50%} for each player for each destination; Game 15 includes endogenous unemployment which depends on how many others move to each destination; Game 16 has the risk of unemployment with incomplete information about this risk, but the possibility of paying to know what the risk is; Game 17 adds the possibility of liquidity constraints to Game 16; and Game 18 adds the possibility of liquidity constraints to Game 15 and incomplete information about unemployment insurance which participants can choose to purchase.
28
Figure 4a: Rate of Migration and Migration Skill-Selection in Five Destination Games in Lisbon Sample
Notes: Games are similar to those in Games 10 to 18, with the addition of destination 4 (that pays less than destination 2), and destination 5 (which pays less than destination 3). The return to observed and unobserved skills are held constant across the nine games. Game 19 is the basic Sjaastad (1962) migration decision; positively correlated (Game 20) and negatively correlated (Game 21) unobserved skills at home and abroad are introduced in Games 20 and 21 as in Borjas (1987); Game 22 incorporates the possibility of liquidity constraints; Game 23 introduces a known chance of unemployment at the migration destination, which is 30% at destination 2, 20% at destinations 3 and 4, and 10% at destination 5; Game 24 includes endogenous unemployment which depends on how many others move to each destination; Game 25 has the risk of unemployment (randomly drawn from {10%, 30%, 50%} for each player at each destination) with incomplete information about this risk, but the possibility of paying to know what the risk is; Game 26 adds the possibility of liquidity constraints to Game 25; and Game 27 adds the possibility of liquidity constraints to Game 24 and incomplete information about unemployment insurance which participants can choose to purchase.
29
Figure 4b: Rate of Migration and Migration Skill-Selection in Five Destination Games in Nairobi Sample
Notes: Games are similar to those in Games 10 to 18, with the addition of destination 4 (that pays less than destination 2), and destination 5 (which pays less than destination 3). The return to observed and unobserved skills are held constant across the nine games. Game 19 is the basic Sjaastad (1962) migration decision; positively correlated (Game 20) and negatively correlated (Game 21) unobserved skills at home and abroad are introduced in Games 20 and 21 as in Borjas (1987); Game 22 incorporates the possibility of liquidity constraints; Game 23 introduces a known chance of unemployment at the migration destination, which is 30% at destination 2, 20% at destinations 3 and 4, and 10% at destination 5; Game 24 includes endogenous unemployment which depends on how many others move to each destination; Game 25 has the risk of unemployment (randomly drawn from {10%, 30%, 50%} for each player at each destination) with incomplete information about this risk, but the possibility of paying to know what the risk is; Game 26 adds the possibility of liquidity constraints to Game 25; and Game 27 adds the possibility of liquidity constraints to Game 24 and incomplete information about unemployment insurance which participants can choose to purchase.
30
Figure 5a: Testing IIA in the Lisbon Sample: Proportion of those Choosing Either Destination 1 or 2 Who Choose to Migrate to Destination 2 by Game
Notes: Sample restricted to those answering destination 1 or 2 for each of the three destination choices in a game variant. Under IIA proportion migrating to 1 versus 2 should be the same regardless of how many destinations are in the Game. Games 1, 10, and 19 are the basic Sjaastad (1962) income maximization decision; Games 2, 11, and 20 are the Borjas (1987) selection game with positively correlated unobserved skills; Games 3, 12, and 21 are the Borjas selection game with unobserved skills in destination 1 negatively correlated with those in other destinations; Games 13, and 22 add the possibility of liquidity constraints (Game 4 is omitted because the moving cost was set higher in this game); Games 5, 14, and 23 add an exogenous risk of unemployment at destination 2; Games 6, 15, and 24 add an endogenous risk of unemployment at destination 3; Games 7, 16, and 25 have an uncertain risk of unemployment at destination 2 that individuals can pay to find out; Games 8, 17, and 26 add the possibility of liquidity constraints along with uncertainty; and Games 9, 18, and 27 add the possibility of liquidity constraints to Games 6, 15, and 24.
31
Figure 5b: Testing IIA in the Nairobi Sample: Proportion of those Choosing Either Destination 1 or 2 Who Choose to Migrate to Destination 2 by Game
Notes: Sample restricted to those answering destination 1 or 2 for each of the three destination choices in a game variant. Under IIA proportion migrating to 1 versus 2 should be the same regardless of how many destinations are in the Game. Games 1, 10, and 19 are the basic Sjaastad (1962) income maximization decision; Games 2, 11, and 20 are the Borjas (1987) selection game with positively correlated unobserved skills; Games 3, 12, and 21 are the Borjas selection game with unobserved skills in destination 1 negatively correlated with those in other destinations; Games 13, and 22 add the possibility of liquidity constraints (Game 4 is omitted because the moving cost was set higher in this game); Games 5, 14, and 23 add an exogenous risk of unemployment at destination 2; Games 6, 15, and 24 add an endogenous risk of unemployment at destination 3; Games 7, 16, and 25 have an uncertain risk of unemployment at destination 2 that individuals can pay to find out; Games 8, 17, and 26 add the possibility of liquidity constraints along with uncertainty; and Games 9, 18, and 27 add the possibility of liquidity constraints to Games 6, 15, and 24.
32
Table 1: Sample Characteristics for Lisbon and Nairobi Samples
Mean S.D. Min. Median Max. Mean S.D. Min. Median Max.
Female 0.45 0.50 0 0 1 0.45 0.50 0 0 1
Age 20.7 1.0 19 20 25 22.7 1.7 20 22 32
Economics Major 0.58 0.49 0 1 1 0.32 0.47 0 0 1
Grade Point Average 15.0 1.4 11 15 18 67.9 9.3 49 67 100
Born abroad 0.06 0.25 0 0 1 0.01 0.09 0 0 1
Spent 6 months or more outside of country 0.52 0.50 0 1 1 0.12 0.32 0 0 1
Would prefer to work outside of country after graduating 0.53 0.50 0 1 1 0.32 0.47 0 0 1
Has a job offer 0.19 0.40 0 0 1 0.19 0.39 0 0 1
Has a job offer outside of country 0.06 0.24 0 0 1 0.02 0.15 0 0 1
Money available as moving costs (Euros/Ksh) 2467 3002 0 1500 20000 182497 253662 0 100000 2000000
Math score (out of 10) 9.55 0.64 7 10 10 9.62 0.73 6 10 10
Expected value question score (out of 10) 9.31 1.51 1 10 10 4.00 4.23 0 2 10
Ambiguity Averse 0.49 0.50 0 0 1 0.49 0.50 0 0 1
Share of a Windfall that would put in a fair gamble 0.30 0.29 0 0.2 1 0.32 0.29 0 0.2 1
Risk-seeking Choice in Eckel and Grossman (2002) risk game 4.10 1.94 1 4 7 3.00 1.82 1 3 7
Point at which switch in Dohmen et al. (2011) risk game 10.19 6.06 1 11 20 7.25 7.35 1 2 21
Sample Size 154 265