Ciência Rural, v.48, n.12, 2018.
Milk composition of Holstein cows: a retrospective study
Caracterização da composição do leite de vacas Holandesas: estudo retrospectivo
Carlos Bondan1 Jéssica Aneris Folchini2 Mirela Noro3 Daniel Lazzari Quadros4 Karine Martini Machado4 Félix Hilário Diaz González5
ISSNe 1678-4596
Received 02.19.18 Approved 10.17.18 Returned by the author 11.16.18 CR-2018-0123.R1
INTRODUCTION
Milk composition analysis is used as a routine measure throughout the world in order to monitor hygienic, nutritional and health aspects of dairy herds (AULDIST et al. 1998). Hygiene is an important quality parameter in milking procedure and in milk preservation that has been used as payment criterion by dairy industry, but in spite of its importance, it is not addressed in the present research. We emphasized on chemical and cellular composition of milk. Many factors can affect chemical and cellular components of milk, leading to a range of variations
that must be considered for an adequate interpretation of milk analysis. Season of the year, stage of lactation, feed management and number of calving are considered among the main factors affecting milk composition (NORO et al. 2006, HECK et al. 2009, LAMBERTZ et al. 2014).
Both milk volume and milk composition (fat, protein, lactose, total solids, and somatic cell count) play an important role, as they serve as a point of reference for the estimation of quality and for the price paid for the raw material (DÜRR et al. 2004). Milk components are crucial for industrialization process, because a difference of only 0.5% of total
1Programa de Pós-graduação em Agronomia (PPGAGRO), Serviço de Análises de Rebanhos Leiteiros (SARLE), Universidade de Passo Fundo
(UPF), 99052-900, Passo Fundo, RS, Brasil. E-mail: [email protected]. *Corresponding author.
2Programa de Pós-graduação em Agronomia (PPGAGRO), Universidade de Passo Fundo (UPF), Passo Fundo, RS, Brasil. 3Curso de Medicina Veterinária, Universidade Federal do Pampa (Unipampa), Uruguaiana, RS, Brasil.
4Universidade de Passo Fundo (UPF), Passo Fundo, RS, Brasil.
5Faculdade de Veterinária, Universidade Federal do Rio Grande do Sul (UFRGS), Porto Alegre, RS, Brasil.
ABSTRACT: Worldwide, milk analysis is an satisfactory measurement of milk quality on dairy farms. Milk composition is the base for payment systems, so knowledge of its characteristics at different periods is essential for modern dairy producer. The aim of the study was to evaluate the effects of year, season, stage of lactation, and lactation number on variations in milk yield and composition of Holstein cows (n=148,604). Milk yield estimated by multiple regression was 25,50L/cow/day. Winter was the season with the highest milk yield and the highest protein and lactose content. Milk fat was highest in the fall, in cows in late lactation and also in primiparous cows. Lactating cows from 6 to 60 days in lactation and those in 2nd or 3rd lactation showed the highest milk yield. Lactose concentration was positively correlated
with milk yield. Somatic cell score was negatively correlated with milk yield and with lactose concentration. Most important variations in milk characteristics occur among seasons, lactation stages and parities. Mammary gland health is yet the greatest challenge to be overcome.
Key words: milk quality, lactation number, seasonality, stage of lactation.
RESUMO: A determinação da qualidade do leite nas fazendas é um parâmetro mundialmente aceito e utilizado como base para os sistemas de pagamento. Os produtores modernos utilizam o conhecimento das características do leite para adotar medidas que visam melhorar produtividade e qualidade. O objetivo do estudo foi avaliar os efeitos do ano, estação, estágio de lactação e número de lactação sobre as variáveis produção e composição do leite de vacas Holandesas (n=148,604). A produção de leite estimada por regressão múltipla foi de 25,50L/vaca/dia. O inverno foi à estação com a maior produtividade e os maiores teores de proteína e lactose. A gordura de leite foi maior no outono em vacas primíparas e no final da lactação. As vacas com estágio de lactação entre 6 a 60 dias e aquelas que se encontram na segunda ou terceira lactação apresentaram a maior produtividade. A concentração de lactose correlacionou-se positivamente com a produção de leite. O escore das células somáticas correlacionou-se negativamente com a produtividade e com a concentração de lactose. As variações mais importantes nas características do leite ocorrem entre estações, estágios de lactação e número de partos. A saúde da glândula mamária ainda é o maior desafio a superar.
Palavras-chave: qualidade do leite, número de lactações, sazonalidade, estágio de lactação.
Ciência Rural, v.48, n.12, 2018. solids may amount 5 tons of powder milk for every
one million liters of processed milk (FONSECA and SANTOS, 2000). Thus, it is of paramount importance that a database containing individual information on yield, milk composition, somatic cell count (SCC) and lactation-related events must be maintained in order to determine the causes and consequences of variations on milk yield and milk composition. Programs of milk record are broadly known and used worldwide, helping dairy farms in taking decisions and good practices, thus contributing to the maintenance and improvement of production traits (DÜRR et al. 2011). Therefore, milk record data are
essential for ensuring the quality and self-sufficiency
of milk production, providing information for a good herd management. Accordingly, the aim of the present study was to assess variations in milk yield and in milk composition of Holstein cows in relation to season, stage of lactation and parity number.
MATERIALS AND METHODS
The study protocol was approved by the Animal Research Ethics Committee of the Universidade Federal do Rio Grande do Sul (project nº 22666). This retrospective study was carried out using information from 115 herds located in the Northern and Northwestern regions of the state of Rio Grande do Sul, Southern Brazil, using dairy herd management data obtained by the Division of Dairy Herd Analysis of Universidade de Passo Fundo (UPF). A total of 148,604 individual data on Holstein cows was collected for the period between January 2008 and December 2013. Milk record consisted of monthly collections of individual data on all lactating cows and lactation-related events, in addition to sampling of milk produced within a 24-hour time frame. Daily milk yield was measured in L/ cow/day and recorded onto a spreadsheet previously handed out by SARLE. Milk samples were collected
in 40-mL flasks containing bronopol, preserved at
room temperature until they were sent to SARLE, where they were kept under refrigeration at 5ºC until analysis, which took place within 48h after collection. Broponol (2-brome-2-nitropropane-1,3-propanediol) is indicated as preservative of raw refrigerated milk samples designed for chemical and cellular analysis. Besides the use of this preservative, it is crucial that refrigeration and execution of the analyses must be done within at a maximum of 3 days for maintaining the integrity of the milk sample in order to obtain reliable results (MONARDES et al.1995).
The following variables were analyzed: milk yield, milk composition (fat, protein, lactose, and total solids), somatic cell count (SCC), and fat-to-protein ratio (F:P ratio). The data on each animal
were classified by year, stage of lactation, season of
the year, and parity (Table 1). Stage of lactation was
classified into four categories according to days in
milk (DIM): 6 to 60, 61 to 120, 121 to 220, and over 220 DIM, excluding those cows with DIM between 0
and 5. Seasons of the year were classified as follows:
summer (December 22 to March 21), fall (March 22 to June 21), winter (June 22 to September 21) and spring (September 22 to December 21). Parity was
classified as follows: 1 for primiparous cows (n =
49,589); 2-3 for cows that calved twice and three
times (n = 49,592); and ≥ 4 for cows that calved more than four times (n=49,423). Milk composition was
analyzed by automated near-infrared spectroscopy (Bentley 2000, Bentley Instruments). Somatic cells
were counted by flow cytometry (Somacount 300,
Bentley Instruments).
Statistical analysis
For the statistical analysis, the following
intervals of the variables were considered: fat ≥2 and ≤5%; protein ≥2 and ≤5%; lactose ≥3.5 and ≤5.6%; total solids ≥9.5 and ≤16.1%; and milk
yield greater than or equal to 8L/cow/day. The statistical analysis was performed by the IBM SPSS
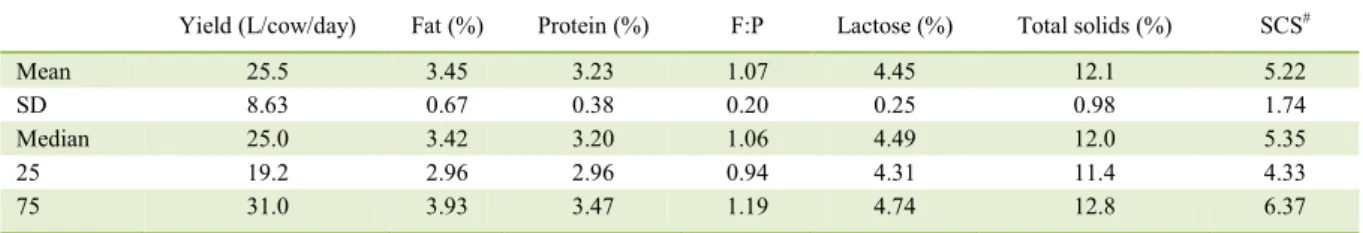
Table 1 - Mean, standard deviation (SD), median, and percentiles of milk yield, chemical composition, somatic cell score (SCS) and fat to protein (F:P) ratio of Holstein cows (N= 148,604).
Yield (L/cow/day) Fat (%) Protein (%) F:P Lactose (%) Total solids (%) SCS#
Mean 25.5 3.45 3.23 1.07 4.45 12.1 5.22
SD 8.63 0.67 0.38 0.20 0.25 0.98 1.74
Median 25.0 3.42 3.20 1.06 4.49 12.0 5.35
25 19.2 2.96 2.96 0.94 4.31 11.4 4.33
75 31.0 3.93 3.47 1.19 4.74 12.8 6.37
#Somatic cell score: Log
Ciência Rural, v.48, n.12, 2018. 19.0 software. Descriptive statistics and
Shapiro-Wilk normality test were performed for milk yield, composition, and somatic cell count (SCC). As SCC was the only variable which did not show normality, it was expressed as a log-transformed somatic cell score (SCS). All parameters were further evaluated as continuous outcomes using analysis of variance (ANOVA), analyzing their differences between year, season of the year, and parity. Milk yield, parity, days in milk, milk composition, and SCS was correlated using linear regression and Pearson’s
correlation coefficient. For all statistical analysis P<0.05 was considered a significant effect and P≤0.1 as a tendency.
RESULTS
The main predictor of milk yield was the stage of lactation, followed by season of the year, lactation number, and year. Cows in early lactation (6 to 60 DIM) had the highest milk yields (+2.71L/ cow/day), decreasing linearly as lactation progress. Milk yield was higher in winter (+1.69L/cow/day), decreasing gradually in spring, summer and fall. Lactation number had quadratic effect in milk yield;
thus, cows in first lactation had the lowest yield
(-1.99L/cow/day), while cows in second and third lactations had the highest production (+1.27L/cow/ day), and cows in fourth or more lactations decreased milk yield (Table 1).
The milk yield was affected by the year: between 2008 and 2010 milk yield decreased
progressively; however, between 2010 and 2013 milk yield had an increase of 3.41% (Table 2). The fat concentration had a quadratic effect due to the stage of lactation. The lowest fat content was detected in 6 to 60 and 61 to 120 DIM, while the highest fat content was observed in cows with over 220 DIM (Table 3). However, the lactation number reduced the fat content in milk. The season of year affected the fat milk: fat content was highest in fall, followed by winter, spring, and summer. A positive linear effect on fat milk content was observed between 2008 and 2013.
The lactation stage was the predictor that presented the highest variations for milk protein concentration (Table 4). Milk protein increased as lactation progressed, being lowest in cows between 61 and 120 DIM, and highest in cows with over 200 DIM. The lactation number affected the milk
protein: protein content was highest in first lactation,
followed by second and third lactation, and in cows with four or more lactation. Milk protein content was impacted by season: in winter and fall the milk protein concentration was highest, decreasing in summer and spring. The year affected the milk protein concentration: between 2009 and 2012 milk protein concentration increased linear and progressively.
The F:P ratio decreased linearly associated with an increase stage of lactation (days in milk) (Table 5). Lactation number affected the F:P ratio;
cows in first-lactation had the highest F:P ratio,
compared with cows with more than four lactations. The F:P ratio was affected by the season of year and
Table 2 - Annual means (± standard deviation) of milk yield, chemical composition, SCS, and F:P ratio between January 2008 and December 2013 in dairy herds.
Year
N
Yield
(L/cow/day) Fat (%) Protein (%) F:P
* Lactose (%) Total solids (%) SCS#
2008
24698 26.2±9.08
b
3.37±0.65d 3.18±0.38d 1.06±0.19d 4.43±0.25c 11.9±0.94d 4.95±2.01e
2009
24403 25.2±8.41
d 3.38±0.66d 3.17±0.37e 1.07±0.20c 4.41±0.26d 11.9±0.94d 5.26±1.87b
2010
26213 24.6±8.14
f 3.40±0.68c 3.23±0.35c 1.05±0.20e 4.46±0.25b 12.1±1.02c 5.45±1.61a
2011
24514 25.0±8.21
e 3.50±0.67b 3.26±0.37b 1.07±0.19b 4.46±0.25b 12.2±1.01b 5.30±1.61b
2012
23635 25.5±8.53
c 3.50±0.69b 3.28±0.39a 1.07±0.20c 4.46±0.25b 12.2±0.99b 5.14±1.70d
2013
25141 26.8±8.63
a 3.52±0.67a 3.24±0.38c 1.09±0.19a 4.49±0.25a 12.2±0.95a 5.19±1.58c
*F:P fat to protein ratio; #SCS: Somatic cell score: Log
10 of somatic cell count. Different letters among years indicate significant
Ciência Rural, v.48, n.12, 2018. by year. Fall, followed by spring, winter, and summer,
was the season with the highest F:P ratio and the F:P ratio was highest in 2013 and 2011, and smallest in 2008 and 2010.
Lactation number was the more important predictor of milk lactose concentration. Lactose concentrations decreased linearly as the lactation number increased (Table 5). Similarly, milk lactose concentration was affected linear and negatively by the stage of lactation. Lactose concentration was highest in cows between 61 and 120 DIM, 6 and 60 DIM, decreasing gradually between 121 and 220 DIM, and over 220 DIM. Lactose concentration was higher in winter decreased linearly in the spring, fall, and summer. No difference was observed in lactose concentrations in 2010, 2011 and 2012, but the levels were higher in 2013 while the lowest lactose concentrations were observed in 2008 and 2009.
Total solids showed the same trend of milk protein (Table 4), increasing as lactation progressed, being highest in cows with over 220 DIM (+0.34%), and lowest in cows between 61 and 120 DIM (-0.23%). Lactation number had linear and negative effect on total solids concentrations. Total solids in milk were affected by the season of the year, the highest level was observed in winter and fall, decreasing linearly between spring and summer. Total solids were affected by the year: between 2008 and 2013 they increased gradually.
Lactation number and stage of lactation were the principal predictors for somatic cell score (SCS). The SCS increased linearly as parity and days in milk augmented (Table 4 and 5). The SCS was higher in fall, and summer, followed by winter, and the lowest SCS was observed in spring. The year affected the SCS: 2010 and 2011 had the highest SCS, while 2008 and 2012 had the lowest.
Table 3 - Means (± standard deviation) of milk yield, chemical composition, SCS, and F:P ratio in different seasons of the year in dairy herds.
Season of the year
N
Yield
(L/cow/day) Fat (%) Protein (%) F:P
* Lactose (%) Total solids (%) SCS#
Winter
40296 27.3±9.16
a 3.48±0.69b 3.27±0.36a 1.07±0.20c 4.48±0.25a 12.2±0.98a 5.20±1.71b
Spring
36438 25.8±8.68
b 3.40±0.66c 3.17±0.36c 1.07±0.19b 4.46±0.25b 12.0±0.98b 5.16±1.78c
Summer
33821 24.2±7.8
d 3.37±0.65d 3.18±0.35b 1.06±0.20d 4.42±0.25d 11.9±0.95c 5.27±1.78a
Fall
38049 24.4±8.48
c 3.53±0.68a 3.28±0.88a 1.08±0.20a 4.43±0.26c 12.2±0.98a 5.26±1.69a
*F:P fat to protein ratio; #SCS: Somatic cell score: Log
10 of somatic cell count. Different letters among seasons indicate significant
differences (P< 0.05).
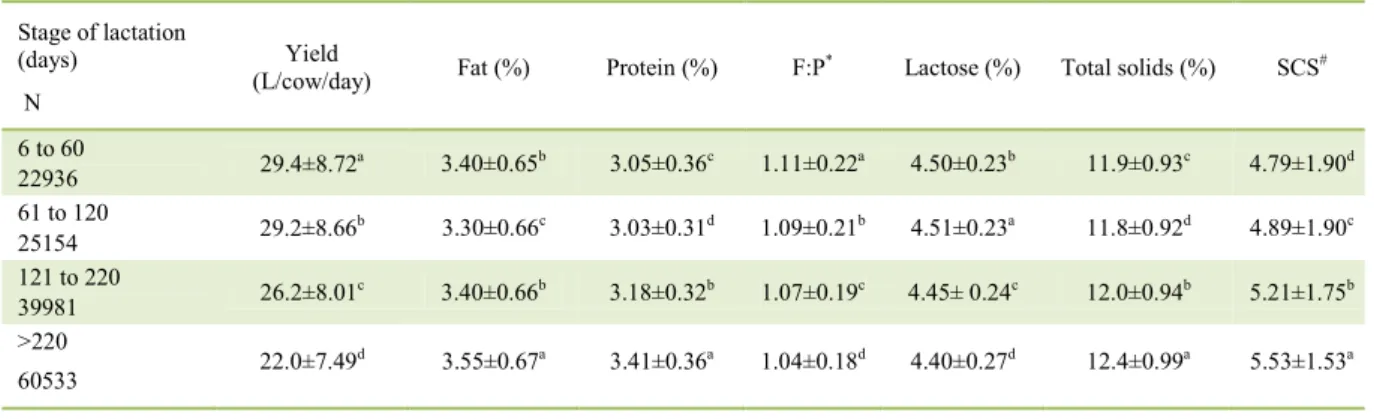
Table 4 - Means (± standard deviation) of milk yield, chemical composition, SCS, and F:P at different stages of lactation in dairy herds.
Stage of lactation (days)
N
Yield
(L/cow/day) Fat (%) Protein (%) F:P
* Lactose (%) Total solids (%) SCS#
6 to 60
22936 29.4±8.72
a 3.40±0.65b 3.05±0.36c 1.11±0.22a 4.50±0.23b 11.9±0.93c 4.79±1.90d
61 to 120
25154 29.2±8.66
b 3.30±0.66c 3.03±0.31d 1.09±0.21b 4.51±0.23a 11.8±0.92d 4.89±1.90c
121 to 220
39981 26.2±8.01
c 3.40±0.66b 3.18±0.32b 1.07±0.19c 4.45± 0.24c 12.0±0.94b 5.21±1.75b
>220
60533 22.0±7.49
d
3.55±0.67a 3.41±0.36a 1.04±0.18d 4.40±0.27d 12.4±0.99a 5.53±1.53a
*F:P fat to protein ratio; #SCS: Somatic cell score: Log
10 of somatic cell count. Different letters among stages indicate significant
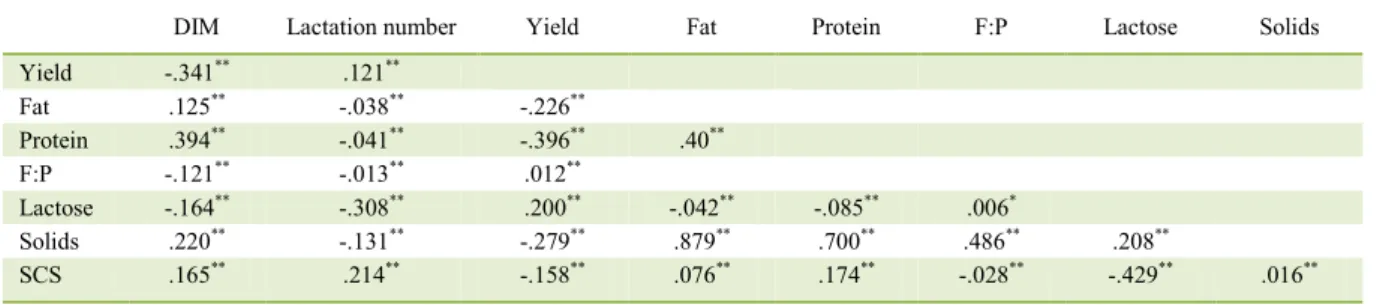
Ciência Rural, v.48, n.12, 2018. Milk yield was positively correlated with
lactose, parity, and the F:P ratio, and negatively correlated with stage of lactation, protein, total solids, fat, and SCS (Table 6). Milk fat was positively correlated with protein, total solids, SCS, and stage of lactation; and negatively correlated with milk yield, lactose, and lactation number. Protein content was positively correlated with fat, total solids, SCS, and stage of lactation, and negatively correlated with milk yield, lactose, and lactation number. The F:P ratio was negatively correlated with SCS, parity, and stages of lactation. Lactose was negatively correlated with SCS, stages of lactation, lactation number, fat, and protein. Total solids were negatively correlated with lactation number and yield.
DISCUSSION
This study presents an evaluation of the effects of year, season, stage of lactation and number of lactation on the variations in milk production and composition of Holstein cows for 115 herds located in the Northern and Northwestern regions of the state of Rio Grande do Sul, southern Brazil. The milk yield estimated by multiple regression
was 25,50L/cow/day between January 2008 and December 2013. Obviously this is a global mean obtained from data of individual cows and it must be considerable differences among herds, but this was not the aim of this study. Several studies on milk composition of dairy cows carried out in different
Brazilian regions revealed similar findings to those
observed in the present study. RIBAS et al. (2004) reported means of 3.69% of fat, 3.24% of protein, 4.55% of lactose and 12.34% of total solids in raw milk collected from 32,590 dairy farms in the states of Santa Catarina, Paraná, and São Paulo. In Brazilian northeastern states, RIBEIRO NETO et
al. (2012) reported means of fat = 3.66%, protein = 3.16%, lactose = 4.41%, total solid = 12.10 and SCC= 564,950sc/mL of milk obtained from 116.989
samples of bulk tank milk. The mean concentrations of the components of milk produced in Brazil are
lower than those observed in New Zealand (fat = 4.80%, protein = 3.61% and lactose = 4.97%), Canada (fat = 4.68 and protein = 3.35%), Germany (fat = 4.19% and protein = 3.42%), and France (fat = 4.06% and protein = 3.35%) (RIBAS et al. 2004).
Studies conducted by HECK et al. (2009) attribute these variations to stage of lactation, nutrition, health status, genetic factors, and seasonal interferences.
Table 5 - Means (± standard deviation) of milk yield, chemical composition, SCS, and F:P ratio, according to the lactation number in dairy herds.
Lactation number Yield (L/cow/day) Fat (%) Protein (%) F:P* Lactose (%) Total solids (%) SCS#
1 23.9±7.72c 3.47±0.67a 3.24±0.37a 1.08±0.19a 4.54±0.23a 12.2±0.97a 4.83±1.73c
2-3 26.9±9.09a 3.43±0.68b 3.23±0.38b 1.07±0.20c 4.43±0.24b 12.1±0.98b 5.31±1.72b
≥4 26.1±8.86b 3.41±0.67c 3.19±0.37c 1.07±0.20b 4.32±0.26c 11.9±0.97c 5.84±1.62a
*F:P fat to protein ratio; #SCS: Somatic cell score: Log
10 of somatic cell count. Different letters among parities indicate significant
differences (P< 0.05).
Table 6 - Correlations among milk yield, days in milk (DIM), parity, milk components and somatic cell score (SCS) in dairy herds.
DIM Lactation number Yield Fat Protein F:P Lactose Solids
Yield -.341** .121**
Fat .125** -.038** -.226**
Protein .394** -.041** -.396** .40**
F:P -.121** -.013** .012**
Lactose -.164** -.308** .200** -.042** -.085** .006*
Solids .220** -.131** -.279** .879** .700** .486** .208**
SCS .165** .214** -.158** .076** .174** -.028** -.429** .016**
Ciência Rural, v.48, n.12, 2018. Differences in the productivity were
observed along the periods. From 2008 to 2010 the productivity diminished while from 2011 to 2013 a gradual increment of productivity was observed, which can be explained by the relationship between milk price and cost of production (MONTOYA et al. 2014). The purchasing price of raw milk in that period was historically higher compared to the production cost, rendering attractive investments that improved the productivity of cows (MONTOYA et al. 2014).
By comparing the findings of NORO et al. (2006) in
Rio Grande do Sul State with the means obtained in the present study, milk yield increased by 27.19%, protein content went up 1.57% and the SCS increased by 1.65%, whereas fat and lactose concentrations decreased by 3.59% and 1.55%, respectively. Milk yield increases were not accompanied by milk quality improvement during 2008 to 2013, mainly referred to somatic cell count. Productivity increases emanate from strategic planning. Milk recording is essential for increasing both milk volume and milk quality (DÜRR et al. 2011). It should be noted that this could only be achieved by raising the awareness of dairy farmers and dairy industries.
Winter was the season of the year in which milk yield and lactose concentration were highest,
followed by spring, verifying the finding of NORO
et al. (2006), who attributed this increase to the better quality of forage grasses during winter in southern Brazil in terms of energy and protein. BRODERICK (2003) perceived that lactose concentration increases with a higher dietary energy content. Temperate
forage grasses contain higher neutral detergent fiber
(NDF) in late fall and winter and in early spring in southern Brazil and a higher soluble carbohydrate
concentration than tropical forage grasses, influencing
cows’ productivity (FONTANELI et al. 2009). The highest fat and protein contents were observed in fall and winter. However, in fall, unlike winter, milk yield was lower, even though solids concentrations did not differ from those detected in winter. A decrease in milk volume may increase solids concentration, especially fat and protein, owing to the concentration effect of milk (WEISS et al. 2002). Certainly, temperate forage grasses provide a better nutritional balance, which partly explains the higher yield and the larger concentrations of fat, protein, lactose, and total solids in winter.
HECK et al. (2009) assessed the variations in milk composition in the Netherlands and concluded that such variations resulted from seasonal factors. Consistent with our study, fat content showed the largest variation, followed by protein content. Lactose
was the component that had the smallest variation compared to protein and fat. HECK et al. (2009) attributed the reduction in fat content during summer to a fresh grass-based diet, which concentrates trans
unsaturated fatty acids compared to preserved foods fed to cows in winter in the Netherlands. The trans
fatty acids interfere with the enzymatic activity of
Δ9- desaturase, in charge of the synthesis of
short-chain and medium-short-chain fatty acids in the mammary gland, contributing to the de novo synthesis. Unlike
the findings of HECK et al. (2009), milk yield, fat,
protein, lactose, and total solids concentrations increased in the season of the year in which cows are fed more digestible and nutritious forages. Thermal comfort also interferes with milk yield and composition. LAMBERTZ et al. (2014) concluded that cows under thermal stress in summer reduce milk yield and fat and protein contents, and increase the SCS, which is consistent with the results obtained in the present study, in which fall and summer yielded the highest SCS.
The highest milk volumes were detected in our study between 6 and 60 DIM, gradually decreasing up until dry off. AULDIST et al. (1998) detected lower lactose levels and, consequently, lower milk yield, with the increase of DIM. Cows with over 220 DIM had the highest milk fat and protein levels in the present study. SCHUTZ et al. (1990) assessed the effects across the stages of lactation and observed lower milk fat and protein up to 50 days postpartum with a later gradual increase, with largest values in late lactation. The F:P ratio has been used as an indicator of body fat mobilization in cows with negative energy balance (NEB). As the increase in free fatty acids, produced by the adipose tissue, contributes to the increase in milk fat, it has been suggested that an F:P ratio greater than 1.25 in cows up to 60 DIM indicates moderate NEB (DE ROOS et al. 2007). In the present study, the mean F:P ratio for cows between 6 and 60 DIM was 1.11, from which
25.72% had a ratio ≥1.25. CUCUNUBO et al. (2013) and DUFFIELD et al. (1997) reported low specificity
and sensitivity in the use of an F:P ratio of 1.25 as indicator of NEB and/or ketosis. When the ratio was
adjusted to ≥1.50, yielding higher specificity and
sensitivity, the percentage of cows with NEB and/or ketosis was equal to 5.15%.
Ciência Rural, v.48, n.12, 2018. multiparous cows, causing the concentration effect of
milk (WEISS et al 2002). Gradual increase in SCS, with greater length of the stage of lactation observed in the present study, is similar to that described by BODOH et al. (1976) and CUNHA et al. (2008). SCHULTZ (1977) attributed this increase to the loss of milk-secreting epithelial cells and to the higher chance of infections in cows with more days in milk. In the present study, larger yields occurred in the second and third lactations, declining from the fourth lactation onward. Maximum milk yield of a cow occurs when its mammary gland is fully developed, which is observed in the third lactation of Holstein cows (SCHUTZ et al. 1990).
In our study, milk yield was positively correlated with lactose level and parity and negatively with SCS. Lactose increases milk osmolarity and, consequently, the water uptake by alveolar cells, producing a higher yield (LARSON, 1995). The increase in SCS had a negative impact on milk yield, lactose, and F:P ratio. HAGNESTAM-NIELSEN et al. (2009) detected lower milk yield in primiparous and multiparous cows with a high SCS. Losses were estimated at 1.9 and 5.2% for primiparous and multiparous cows, respectively. The same authors reported that largest losses in milk yield occurred as lactation progressed, with the most negative regression
coefficients between weeks 33 and 44, regardless of parity. These findings are consistent with those obtained
in our study, which indicated that SCS increases and milk yield declines as lactation advances. However, we observed that cows with less parity had lower SCS. Reduction of lactose levels in cows with high SCS was also observed by PRADA e SILVA et al. (2000), according to whom 34% of lactose losses were caused by an increment in SCS. The SCS was positively correlated with milk fat, protein, and solids, with DIM, and with parity, but was negatively correlated with milk yield. SCHUTZ et al. (1990) and CUNHA et al. (2008) found positive correlations between SCS and milk fat and protein levels. MILLER et al. (1983) assessed milk yield per cow and MITCHELL et al. (1986) analyzed bulk tank milk and observed an increase in fat content in milk with high SCC. There is no consensus agreement in the literature concerning the increase in total protein in cows with a high SCC (AULDIST&HUBLE, 1998). KITCHEN (1981) and MUNRO et al. (1984) advocate that the increase in serum protein in cows with subclinical mastitis is likely attributable to the increase in the vascular permeability
produced by the inflammatory process. In our study,
the correlation between SCS and lactose was equal to -0.429 (P<0.01) suggesting a deleterious effect of
subclinical mastitis on lactose synthesis. NORO et al. (2006) and CUNHA et al. (2008) described the same effects of SCS on milk yield and composition, indicating it must be a persistent problem that affects milk yield and quality.
CONCLUSION
Seasonality does play a role in milk yield and compositions, as the largest milk volume as well as fat, protein and lactose content are detected in winter. In the case of southern Brazil this is attributable to the better forage composition in this season. In contrast, summer is the season with the highest somatic cell count and lowest fat and protein content. Cows in early lactation (6 to 60 DIM) and those with two and three lactations are the most productive. One-quarter of the cows may be in negative energy balance as the F:P ratio in milk reveals (>1.25). Primiparous cows have the greatest values of fat and lactose and also the lowest values of somatic cell count. The biggest challenge to be overcome yet is the reduction of the number of somatic cells negatively correlated with milk yield and with lactose level.
DECLARATION OF CONFLICT OF INTEREST
The authors declare no conflict of interest. The founding sponsors had no role in the design of the study; in the collection, analyses, or interpretation of data; in the writing of the manuscript, and in the decision to publish the results.
ACKNOWLEDGEMENTS
All authors contributed equally for the conception and writing of the manuscript. All authors critically revised the manuscript and approved of the final version.
REFERENCES
AULDIST, M.J. & HUBBLE I.B. Effects of mastitis on raw milk and dairy products. Austral J. Dairy Technol. 53: 28-36, 1998.
AULDIST, M.J., et al. Seasonal and lactational influences on bovine milk composition in New Zealand. J. Dairy Res. 65: 401-411. 1998.
BODOH G.W. et al. Variation in somatic cell counts in dairy herd improvement milk samples. J. Dairy Sci. 59:1119-1123. 1976. Available from: <https://www.journalofdairyscience.org/article/S0022-0302(76)84331-7/abstract>. Accessed: Jul. 23, 2011. doi: 10.3168/jds. S0022-0302(76)84331-7.
Ciência Rural, v.48, n.12, 2018.
CUCUNUBO L.G. et al., Use of Blood, Urine and Milk Samples in the Diagnosis of Subclinical Ketosis and Negative Energy Balance in Grazing Dairy Cows. Rev. Cient. FCV-LUZ. (23): 111-119. 2013.
CUNHA R.P.L. et al., Subclinical mastitis and the relationship between somatic cell count with number of lactations, production and chemical composition of the milk. Arq. Bras. Med. Vet. Zoot. 60:19-24. 2008. Available from: <http://www.scielo.br/ scielo.php?script=sci_arttext&pid=S0102-09352008000100003>.
Accessed: Sept. 22, 2018. doi: 10.1590/S0102-09352008000100003.
DE ROOS A.P. et al., Screening for subclinical ketosis in dairy cattle by Fourier transform infrared spectrometry. J. Dairy Sci. 90:1761-1766. 2007. Available from: <https://www.ncbi.nlm.nih. gov/pubmed/17369216>. Accessed: Sept. 22, 2018. doi: 10.3168/ jds.2006-203.
DUFFIELD T.F. et al., Use of test day milk fat and milk protein to detect subclinical ketosis in dairy cattle in Ontario. Can. Vet. J. 38:713-718. 1997.
DÜRR J.W. Programa nacional de melhoria da qualidade do leite: uma oportunidade única. In: DÜRR J. W., CARVALHO M. P. & SANTOS M. V., editors. O compromisso com a qualidade do leite no Brasil. Passo Fundo: Editora da Universidade de Passo Fundo. 38-55. 2004.
DÜRR J.W et al. Milk recording as an indispensable procedure to assure milk quality. Rev. Bras. Zoot. 40:76-81. 2011.
FONSECA L. F. L. & SANTOS M. V. Qualidade do leite e controle da mastite. São Paulo: Lemos Editorial. 2000. 175p.
FONTANELI R. S., SANTOS H.P. & FONTANELI R. S.
Forrageiras para integração lavoura-pecuária-floresta na
região sul-brasileira. Passo Fundo: EmbrapaTrigo.2009. 340p.
HAGNESTAM-NIELSEN C., et al. Relationship between somatic cell count and milk yield in different stages of lactation. J. Dairy Sci. 92:3124-3133. 2009. Available from: <https://www.researchgate.net/ publication/26294104_Relationship_between_somatic_cell_count_ and_milk_yield_in_different_stages_of_lactation>. Accessed: Sept. 22, 2018. doi:10.3168 / jds.2008-1719.
HECK J.M., VAN et al., Seasonal variation in the Dutch bovine raw milk composition. J. Dairy Sci. 92:4745-4755. 2009. Available: <https://www.journalofdairyscience.org/article/S0022-0302(09)70804-5/abstract>. Accessed: Sept. 22, 2018. doi: 10.3168/jds.2009-2146.
KITCHEN B. J. Review of the progress of dairy science: bovine mastitis: milk compositional changes and related diagnostic tests. J. Dairy Res. 1981. 48:167-188.
LAMBERTZ C., SANKER C. & GAULY M. Climatic effects on milk production traits and somatic cell score in lactating Holstein-Friesian cows in different housing systems. J. Dairy Sci. 97:319-329.2014. Available: <https://bia.unibz.it/bitstream/handle/10863/236/2014_Lambertzetal. Climaticeffectsonmilkproductiontraitsinlactatingcows_JDairySci. pdf?sequence=2>. Accessed Sept. 22, 201. doi: 10.3168 / jds.2013-7217.
LARSON, B.L. Biosynthesis and cellular secretion of milk. In: Larson BL, editor. Lactation. Ames: Iowa State University Press. 129-163. 1995.
MILLER R.H. et al. Relationships of milk somatic cell counts to daily milk yield and composition. Acta Agric. Scand. 33:209-223. 1983.
MITCHELL G.E et al., The relationship between somatic cell count, composition and manufacturing properties of bulk milk. 2. Composition of farm bulk milk. Austral J. Dairy Technol. 41:9-12. 1986.
MONARDES H.G. et al. Preservation and storage mechanisms for raw milk samples for Use in Milk-Recording Schemes. Journal of Food Protection. 59(2):151-154.1995.
MONTOYA M.A. et al. Panorama da produção leiteira no Rio Grande do Sul: perspectivas e gestão nas propriedades no Corede Produção. In: Fontes de crescimento da produção de leite: um enfoque no Corede. Passo Fundo: Editora da Universidade de Passo Fundo. 25-38. 2014.
MUNRO G.L. et al., Effects of mastitis on milk yield, milk composition, processing properties and yield and quality of milk products. Austral J. Dairy Technol. 39:7-16. 1984.
NORO G., et al. Fatores ambientais que afetam a produção e a composição do leite em rebanhos assistidos por cooperativas no Rio Grande do Sul. Rev. Bras. Zoot. 35:1129-1135. 2006.
PRADA e SILVA L. F. et al. Effects of somatic cell levels on milk components. II. Lactose and total solids. Braz. J. Vet. Res. Anim. Sci. 37:330-333.2000. Available: <https://www.ncbi.nlm.nih.gov/pmc/articles/ PMC3626830/>. Accessed: Sept. 22, 2018. doi: 10.1186/1746-6148-9-67.
RIBAS N.P., et al., Milk Total Solids in Bulk Tank Samples of Paraná, Santa Catarina and São Paulo States Rev. Bras. Zootec. 33:2343-2350. 2004. Available: <http://www.scielo.br/scielo. php?pid=S1516-35982004000900021&script=sci_abstract>.
Accessed: Jul. 22, 2018. doi: 10.1590/S1516-35982004000900021.
RIBEIRO Neto A.C et al. Quality of bulk tank milk with federal in-spection from the dairy industry in the Brazilian Northeast. Arq. Bras. Med. Vet. Zoot. 2012, 64:1343-1351. Available: <http://www.scielo. br/scielo.php?script=sci_arttext&pid=S0102-09352012000500035>.
Accessed: Sept. 22, 2018. doi: 10.1590/S0102-09352012000500035.
SCHUTZ M.M. Variation of milk, fat, protein and somatic cells for dairy cattle. J. Dairy Sci. 73:484-493. 2012. Available: <https:// www.journalofdairyscience.org/article/S0022-0302(90)78696-1/ fulltext>. Accessed: Sept. 22, 2018. doi: 10.3168/jds.S0022-0302(90)78696-1.
SCHULTZ L.H. Somatic cells in milk physiological aspects and rela-tionship to amount and composition of milk. J. Food Protec. 40:125-131. 1977. Available from: <http://www.scielo.br/scielo.php?script=sci_ arttext&pid=S0100-736X2007000100002>. Accessed: Sept. 23, 2018.
doi: 10.1590/S0100-736X2007000100002.