COFFEE POWDER REUSED AS A COMPOSITE MATERIAL
A STEP IN THE RIGHT DIRECTION
PORTO, 30th SEPTEMBER, 2016 VASCO JOSÉ GUIMARÃES CANAVARRO
COFFEE POWDER REUSED AS A COMPOSITE MATERIAL
A STEP IN THE RIGHT DIRECTION
DISSERTATION ADVISED BY DOCTOR BÁRBARA RANGEL
DISSERTATION CO-ADVISED BY DOCTOR JORGE LINO
O JÚRI
PRESIDENTE
Doutora Teresa Duarte
PROFESSORA AUXILIAR DA FACULDADE DE ENGENHARIA DA UNIVERSIDADE DO PORTO
ORIENTADOR
Doutora Bárbara Rangel
PROFESSORA AUXILIAR DA FACULDADE DE ENGENHARIA DA UNIVERSIDADE DO PORTO
ARGUENTE
Doutor Demétrio Ferreira Matos
P RO F E S SO R A D J U N TO D O I N S T I T U TO P O L I T É C N I CO D O C ÁVA D O E D O AV E
19
08.11.2016I dedicate this work to my Father, who passed away in 2015, during my first year as a student at this Master’s Degree and one of his last wishes was that I completed the course.
Esta é para ti, Pai.
José Júlio Xavier Canavarro
[1948 – 2015]
RESUMO
Este estudo tem como objetivo confirmar a possibilidade de utilização de resíduos de café na criação de objetos de Design, bem como documentar e descrever o tipo de aplicações que existem hoje, em diferentes áreas, para a reutilização desta substância e que estratégias são praticadas atualmente na produção de materiais criados com base no pó de café, com a capacidade de serem usados por meio de moldagem ou fabrico aditivo. A relevância deste estudo é justificada pelas características sui generis do café, tais como odor, aparência visual ou textura, assim como pela enorme abundância desta matéria-prima em potencialidade que é, normalmente, descartada após cumprir a sua principal função. Portanto, aqui são apresentados dados estatísticos relativamente aos resíduos em geral, com foco especial no café. Esta informação destina-se a mostrar a sua evidente abundância.
Também é demonstrado por trabalho experimental, qual o aglutinante ideal para a criação do material desejado e que métodos foram utilizados na execução desta tarefa.
Com base na pesquisa feita, são apresentadas algumas propostas de Design com base no material desenvolvido ao longo deste estudo, com aplicações em diferentes áreas e uma proposta de fabrico por moldagem das peças desenvolvidas.
Palavras-chave
ABSTRACT
This study aims to confirm the possibility of using coffee waste to create design objects as well as to document and describe the type of applications that exist today, in different areas, for re-use of this substance and what strategies are carried out currently in the production of materials created based on coffee grounds, with the ability to be used by means of moulding or additive manufacture.
The relevance of this study is justified by the coffee sui generis characteristics, such as odor, visual appearance or texture, as well as the huge abundance of this raw material in capability, which is normally discarded after serving its primary function. Therefore, here is presented statistical data regarding the waste in general, with special focus on coffee. This information is intended to show its obvious affluence.
It is also demonstrated by experimental work, which is the ideal binder for the creation of the desired material and which methods were used in performing this task.
Based on the research done, some design proposals based on the material developed throughout this study are presented, with applications in different areas and a manufacturing proposal by moulding of the developed parts.
Keywords
ACKNOWLEDGEMENTS
With the completion of this stage of my life, I want to thank the contributions that allowed this study to take place. I want to thank first of all to the classmates, whom in one way or another supported me, especially the two that started this project with me, Ricardo Pinto and José Pedro Ferreira.
I gratefully acknowledge the funding of Project NORTE-01-0145-FEDER-000022 - SciTech - Science and Technology for Competitive and Sustainable Industries, co-financed by Programa Operacional Regional do Norte (NORTE2020), through Fundo Europeu de Desenvolvimento Regional (FEDER).
I would also like to thank my Advisor, Doctor Barbara Rangel and my Co-adviser, Doctor Jorge Lino, for their contribution to this work in several areas and also by the support they have given me over the two-year course. Without them, the realization of this thesis would not be possible.
I cannot help but show my gratitude for the INEGI staff, Mister Sertório and Engineer Bártolo for the assistance provided in the construction of moulds and for sharing with me some of their precious knowledge.
Finally I would like to thank my mother, for the support given to me throughout this whole adventure.
In short, I thank everyone that somehow was available to assist me in any way and turned this project into what it is. To all, thank you very much.
TABLE OF CONTENTS
RESUMO ... 9 ABSTRACT ... 11 ACKNOWLEDGEMENTS ... 13 TABLE OF CONTENTS ... 15 LIST OF FIGURES ... 17 LIST OF TABLES ... 19SYMBOLS AND ABBREVIATIONS... 20
CHAPTER I / INTRODUCTION ... 23
1.1. Background ... 23
1.2. Goals ... 24
1.3. Methodology ... 24
1.4. Dissertation’s Structure ... 25
CHAPTER II / STATISTICAL DATA ... 27
2.1. Waste ... 28
2.2. Coffee Statistics and Data ... 39
CHAPTER III / STATE OF THE ART ... 47
3.1. Reuse Strategies for Coffee... 49
3.2. Reuse Solutions for Coffee in Additive Manufacturing ... 53
3.3. Design Applications for Coffee Waste ... 59
3.4. PLA + Spent Coffee Grounds Tests ... 63
CHAPTER IV / EXPERIMENTAL WORK ... 69
4.1. Epoxy Resin ...72
4.2. Starch ...75
4.3. Pine Resin ...79
4.4. Pine Resin and Wax ... 80
4.5. PLA (Polylactide) ... 81
5.1. Main Project ... 92
5.2. Prototype ... 95
5.3. Other Design Possibilities ... 100
5.4. Construction Proposal ... 107
CHAPTER VI / CLOSING REMARKS... 110
6.1. Conclusions ... 110
6.2. Future Perspectives ...111
REFERENCES ... 112
APPENDIX I / BIRESIN CR83 DATA SHEET ... 116
APPENDIX II / PINE RESIN YT321 DATA SHEET ... 120
APPENDIX III / PLA INGEO 3251D DATA SHEET ... 121
APPENDIX IV / PLA DESCRIPTION CES EDUPACK 2016 ... 125
APPENDIX V / SILICONE RUBBER VTX 950 DATA SHEET ... 127
APPENDIX VI / COST REPORT SIMULATION ... 129
LIST OF FIGURES
01. Projected waste generation by region (millions of tonnes per day) up to the year 2100 ... 29
02. Total agricultural production vs. food wastage volumes (million tonnes) in 2007 ... 30
03. Food wastage volumes, at world level by phase of the food supply chain (million tonnes) ... 31
04. Development of waste treatment in the EU-28 (million tonnes) ... 34
05. Municipal waste generation and treatment in the EU (refers to EU27, excluding Croatia, for the years 1995 to 2006 and to EU28 from 2007 onwards) in kg per person ... 35
06. Number of dumpsites accepting different combinations of waste types... 36
07. Average annual growth rate (million bags) in global coffee consumption since 2011 ... 39
08. Coffee production by continent in million bags ... 40
09. Composition of world consumption ...41
10. Top 5 Countries by Sheer Tonne Coffee Consumption ... 43
11. Source of caffeine for individuals 22 years and over in milligrams. Daily intake: 300.7 milligrams... 44
12. Daily consumption of coffee by the U.S. population in 2009 ... 44
13. Graphical Abstract ... 50
14. Salt ... 53
15. The Utah Tea Set... 54
16. Sawdust Screen ... 54
17. Agridust ... 55
18. Hoop by Francesco Pacelli ... 56
19. Wound Up ... 56
20. 3D Printer, property of FEUP (left). 3D printed octopus using 3Dom coffee filament ...57
21. HIFA Coffee System ... 59
22. GroCycle ... 60
23. Kaffeeform ... 60
24. Eco Sleeve Maker ...61
25. decafé by Raúl Laurí ... 62
26. Mass loss of PLA, PLA/20%SCG and PLA/40%SCG as a function of incubation time in soil ... 64
27. Percent mass gain due to the absorption of water for PLA, PLA/20%SCG and
PLA/40%SCG ... 64
28. Torque values as a function of mixing time for the PLA/SCG composite ... 66
29. The effects of SCG content on the tensile strength at failure are shown for the PLA/SCG composites ... 66
30. PLA food packaging (Mathilde 2013). ... 70
31. Starch experiments showing signs of moisture with the appearance of mold. ... 78
32. Deteriorated coffee/starch mixture after being submerged in cold water. ... 78
33. Pine resin experiment results. ... 79
34. Pine resin and wax experiment results. ... 80
35. Initial PLA experiment results. ... 83
36. Experiments with PLA/coffee on a silicone mould. ... 84
37. Sample after being machine washed. ...85
38. Sample with hot coffee. ...85
39. Creation of a second, bigger mould for the cups. ...88
40. Explanatory sketch for the main design project. ... 92
41. 3D renderization of the main project. Proposed use. ...93
42. 3D renderization of the main project. ... 94
43. Prototype parts. ... 97
44. Prototype ... 97
45. General dimensions for the cup and legs/handles parts. ... 98
46. General dimensions for the wooden tray... 99
47. Other design possibilities creative sketch. ... 100
48. Plant pots possibility. ... 102
49. Plant pots possibility with plants. ... 102
50. Containers for appetizers and cup for cold beverages. ... 103
51. Different sized bowls and plates for various purposes. ... 103
52. Proposal for the plates... 104
53. Possibility for using the material as a shade. ... 105
54. Aspect of the shade against a light source. ... 105
55. Set of all the design proposals for the developed material. ... 106
56. Injection Moulding Machine ... 107
LIST OF TABLES
01. Global waste generation ... 28
02. Examples of potential impacts of food losses and waste on the sustainability of food systems ... 32
03. Costs of inaction towards waste management. ... 37
04. 12 Principles of Green Engineering ... 37
05. Total production by all exporting countries in thousand 60kg bags ... 40
06. Disappearance (consumption) in selected importing countries in thousand 60kg bags ...41
07. World coffee consumption in thousand 60kg bags ... 42
08. 14 Genius Ways To Recycle Used Coffee Grounds. ... 49
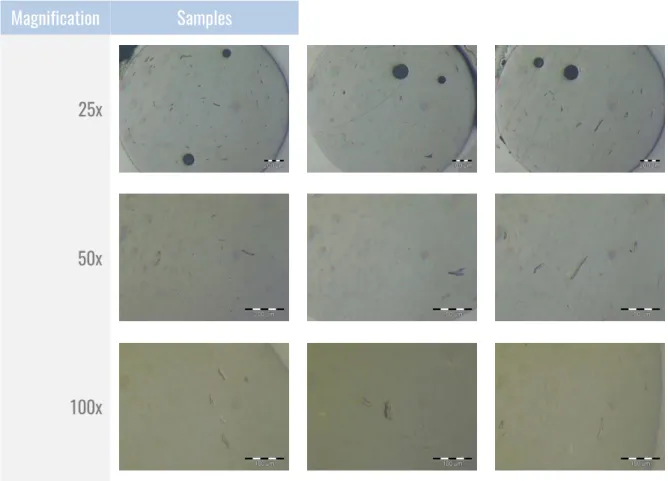
09. Microscopic analysis from 3Dom coffee filament. ... 58
10. Degradation of PLA and PLA/20%SCG as a function of incubation time in soil ... 63
11. The effects of SCG content on the thermal properties of PLA/SCG composites ... 65
12. Method of experimentation with the epoxy resin. ...72
13. Epoxy resin experiments results. ... 73
14. Method of experimentation with starch. ...75
15. Starch experiments results. ... 77
16. Method of experimentation with PLA. ... 81
17. Moulded samples with formulas. ... 84
18. Samples of various formulas PLA/coffee without being moulded. ... 85
19. Samples of various formulas of PLA/coffee using a mould. ... 88
20. Samples with high transparency. ... 90
21. Prototype creation description. ... 95
22. Plastic industrial Colour Mixer 300kg Blender Machine ... 108
SYMBOLS AND ABBREVIATIONS
Abbreviations
2D Two-Dimensional 3D Three-Dimensional AM Additive Manufacturing CAD Computer Aided Design CAGR Compound Annual Growth Rate COL I Type I Collagen
DGEBA Diglycidyl Ether Of Bisphenol A DSC Differential Scanning Calorimetry DWG Drawing File format
ESCG Extract Of Spent Coffee Grounds EU European Union
Eurostat Statistical Office of the European Union E-Waste Electronic Waste
FAEE Fatty Acid Ethyl Ester FAME Fatty Acid Methyl Ester
FAO Food and Agriculture Organization of the United Nations FBAUP Faculdade de Belas Artes da Universidade do Porto FDA Food and Drug Administration
FDM Fused Deposition Modelling
FEUP Faculdade de Engenharia da Universidade do Porto FFAs Free Fatty Acids
FLW Food Loss And Waste GHG Greenhouse Gas
HLPE Panel of Experts on Food Security and Nutrition ICO International Coffee Organization
IHC Immunohistochemistry
INEGI Institute of Science and Innovation in Mechanical and Industrial Engineering ISWA International Solid Waste Association
MDIP Master’s Degree in Product and Industrial Design MMPs Matrix Metalloproteinase
MSW Municipal Solid Waste PLA Polylactic Acid / Polylactide PMHS Polymethylhydrosiloxane
SCAA Specialty Coffee Association of America SCG Spent Coffee Grounds
SOFC Solid Oxide Fuel Cell STL Stereolithography U.S. United States of America UK United Kingdom
UNEP United Nations Environment Programme USA United States of America
UV Ultra-Violet WM Waste Management
Symbols
% Percent CO2 Carbon Dioxide g Gram Hf Heat of Fusion kg Kilogram km3 Cubic Kilometre mg Milligram ml Millilitre mm millimetre MPa Megapascal Nm Newton Metre ºC Centigrade Degree oz. Ounce
Tg Glass transition Temperature Tm Melting Point
CHAPTER I
/ INTRODUCTION
INTRODUCTION
1.1. Background
This work is carried out within the structure of the Master’s Degree in Product and Industrial Design (MDIP), at the Faculty of Engineering (FEUP) and Faculty of Fine Arts (FBAUP) from the University of Porto.
This chapter aims at presenting the Master's thesis titled "Coffee Reused as a Composite Material – A Step in the Right Direction". Here is a brief introduction to the subject’s framework done within this project and the goals to be achieved, the methodology used and a description of the dissertation’s structure.
With the technological and industrial development, many products have toxicity problems and the rate at which people consume new raw materials has become unsustainable. The markets have been undergoing changes and manufacturing materials tends to be more affordable, but they still have problems related with pollution and other ecological concerns. The impact that mankind’s hunger for consumption, has upon nature and how that contributes to the slow end of natural resources, is well known. For this reason, alternative processes concentrate upon the reuse of waste.
This theme has emerged as a way to combat this problem of great environmental impact through design. From this point of view, this thesis aims to present a composite material from reused ground coffee leftovers. Because at the moment it is treated mostly as junk, it may therefore be used as an innovative material for the production of several objects.
1.2. Goals
The main goal to be achieved within this research is to obtain a mouldable material, formed by the coffee grounds and a suitable binder found through experimentation and study. It is also intended that the material created is both durable and washable, with prospects of extending the number of ways in which it can be used.
To validate this, it is intended the creation of a set of products made from the developed material, which can be extended to numerous areas of Design, from simple kitchen utensils to lamps.
From the point of view of sustainability the idea is to extend the life cycle of coffee, eliminating the waste phase, to which it is largely subjected nowadays, after consumption.
1.3. Methodology
During the course of this work, an in-depth research was done on the type of use that is given today to this type of waste, from furniture applications, fertilizer, fuel, or even materials with 3D printing capabilities. This research focused on scientific articles, books and even dissertations, as well as websites related to the objectives of this work. At the same time, a study has been done to try to understand the statistical data of waste, with a special focus on coffee.
In a more detailed way and trying to direct the research towards this thesis, it was tried to realize in which stage is the evolution of coffee grounds as a material with the ability to be moulded or extruded through 3D printing and what kind of progress, if any, is being made in that direction.
Completed the research phase, all the relevant information was analysed to allow for knowledge development and broaden understanding about the chosen topic.
During the entire process of knowledge gathering and information collection, some experiments with mixtures between the coffee waste, and a variety of binders were made, both biological and man-made, to realize what could work best for achieving the desired, physical and visual characteristics, thus reaching the expected and wanted material.
Later, from the standpoint of design, some products were developed with the aid of CAD software and the respective prototypes were created, with the ability to be tested in real circumstances in order to finally be validated.
So, in order to summarize this study, it is divided into three major parts. The first one being the investigation work, the second is the experimentation and finally the Design process.
1.4. Dissertation’s Structure
This dissertation is divided into six chapters.
The first chapter concerns the introduction, which in turn is divided into four parts. Here can be found the historical justification and framework of this study, the objectives intended to be achieved, the adopted methodology and the structure of the dissertation.
In the second chapter there is access to statistical data that provides information relative to waste in general and coffee in particular, as global or specific countries consumptions with relevance to the study. The state of the art is presented in chapter three and is divided into four sections. The first is on the coffee reuse strategies, the second deals with the theme of coffee reuse solutions in additive manufacturing, the third section shows the kind of products that are being created based on this reuse in the area of Design and last some tests made to a composite material made between PLA and spent coffee grounds are presented. Chapter four shows all the experimental work done within the development of this thesis. It is divided by the materials used and describes them as well as the procedures used in each experiment. It also shows the
results of those experiments and an analytical description of them, with a greater emphasis on the chosen binder.
The Design proposal appears in the sixth chapter with a main project, from which a prototype was made. Then, other design possibilities for the developed material appear and finally a production proposal is presented.
In the seventh and final chapter of this document, conclusions are taken from what has been done and what kind of future prospects exist in this area of study, for the developed material.
CHAPTER II
/ STATISTICAL DATA
STATISTICAL DATA
For further understanding on the grandiosity of the problem faced with material waste, biological or artificial and to contextualize this study, this chapter will focus on showing some data relative to this issue. It is intended to demonstrate waste numbers, regarding waste in general, food waste (from which coffee is a part of) and what type of treatment is given to it, in an attempt to show why this is a problem and that many wasted substances can and should be reused at the end of their life cycle.
Additionally, it tries to confirm through statistical data, that coffee is one of the best substances to be reused, by its sheer abundance and characteristics.
2.1. Waste
According to Eurostat (Statistical Office of the European Union), Portugal generated in 2012, 14.184.456 tons of waste (Eurostat 2015b). On the other hand, Europe (28 Countries) ended the same year with 2.514.220.000 tons and in the United States are generated daily 624.700 tons of solid waste and the forecast made by The World Bank Organization through the document "What a Waste" (Bhada-Tata 2012, 83) is that by 2025 it will be 701.709 tons.
Table 1 - Global waste generation. Adapted from "Global Waste Generation Clock” (Atlas 2016).
On Table 1, the global waste generation by hour, day, month and year is shown and we are told by the same source that the current annual Municipal Solid Waste (MSW) generation is estimated to 1.9 billion tonnes with almost the 30% of it to remain uncollected. As for the collected MSW, 70% is led to landfills and dumpsites, 19% is recycled or recovered and 11% is led to energy recovery facilities. The number of people that lacks access even to the most elementary Waste Management (WM) services is estimated to at least 3.5 billion. If we continue with a “Business as Usual” practice, the situation seems to worsen significantly, with forecasts to estimate that the population that will have no access to WM services in 2050 will be around 5.6 billion (Atlas 2016).
As further demonstrated by Daniel Hoornweg, Perinaz Bhada-Tata and Chris Kennedy in their publication for Nature magazine, "Waste production must peak this century", the amount of waste generated globally shows a growth tendency up to the year 2100 (Figure 1), with Sub-Saharan African countries taking the leadership (Daniel Hoornweg 2013, 616). It can, therefore, be recognized that waste generation by the human being will hardly decrease in the next years and one of the solutions to this decrease might be in its reuse or recycling. Quantity Tons/hour 182.65 – 228.31 Tons/day 4.38 – 5.48 million Tons/month 133.33 – 166.67 million Tons/year 1.6 – 2.0 billion
Figure 1 - Projected waste generation by region (millions of tonnes per day) up to the year 2100. Adapted from "Waste production must peak this century" (Daniel Hoornweg 2013).
Food Waste
In their article, “Determinants of consumer food waste behaviour: Two routes to food Waste”, Violeta Stancu, Pernille Haugaard and Liisa Lahteenmaki conclude that there are two routes to food waste behaviour, the intentional one and the routinized one. Their findings suggest that food-related routines (i.e. planning, shopping and leftovers reuse) are main drivers of food waste in addition to perceived behavioural control. Among the routines, the leftovers reuse routines were the most important contributors to food waste but were closely followed by shopping routines. Planning routines contributed only indirectly through shopping routines (Violeta Stancu 2016).
In regards to food waste, which coffee is a part of, the Food and Agriculture Organization of the United Nations (FAO) says that the global volume of food wastage is estimated at 1.6 billion tonnes of "primary product equivalents". Total food wastage for the edible part of this, amounts to 1.3 billion tonnes. Food wastage's carbon footprint is estimated at 3.3 billion tonnes of CO2 equivalent of greenhouse gas (GHG) released into the atmosphere per year. The total volume of water used each year to produce food that is lost or wasted (250km3) is equivalent to the annual flow of Russia's Volga River, or three times the volume of Lake Geneva. Similarly, 1.4 billion hectares of land - 28 percent of the world's agricultural area - is used
0 1 2 3
2010 2040 2070 2100
Sub-Saharan Africa East Asia ans Pacific Europe and Central Asia South Asia
Latin America and the Caribbean Middle East and North Africa High-income and OECD countries Linear (Sub-Saharan Africa)
annually to produce food that is lost or wasted. A low percentage of all food wastage is composted: much of it ends up in landfills, and represents a large part of municipal solid waste. Methane emissions from landfills represent one of the largest sources of GHG emissions from the waste sector. Home composting can potentially divert up to 150 kg of food waste per household per year from local collection authorities. Developing countries suffer more food losses during agricultural production, while in middle- and high-income regions, food waste at the retail and consumer level tends to be higher. The direct economic consequences of food wastage (excluding fish and seafood) run to the tune of $750 billion annually (Nations 2016).
Next, some food wastage volumes, provided by FAO in their 2013 report “Food Wastage Footprint – Impact on Natural Resources”, will be shown and interpreted.
In Figure 2 it is observed that the global volume of food wastage in 2007 was estimated at 1.6 gigatonnes of “primary product equivalents”. The total food wastage for the edible part of food only was 1.3 gigatonnes. This amount can be weighed against the sum of the domestic agricultural production of all countries, which is about 6 gigatonnes (this value includes also agricultural production for other uses than food).
Figure 2 - Total agricultural production vs. food wastage volumes (million tonnes) in 2007. Adapted from “Food wastage footprint - Impacts on natural resources” (Nations 2013).
0 500 1000 1500 2000 2500 Cereals (excluding beer) Starchy roots Oil crops and pulses Fruits (excluding wine)
Meat Fish and
seafood
Milk and egs
Vegetables
The same report shows the amounts of food wastage along the food supply chain. Agricultural production, at 33%, is responsible for the greatest amount of total food wastage volumes. Upstream wastage volumes, including production, post-harvest handling and storage, represent 54% of total wastage, while downstream wastage volumes, including processing, distribution and consumption, are 46%. Thus, on average, food wastage is balanced between the upstream and downstream of the supply chain (Figure 3).
Figure 3 - Food wastage volumes, at world level by phase of the food supply chain (million tonnes). Adapted “Food wastage footprint - Impacts on natural resources” (Nations 2013).
On the other hand, the High Level Panel of Experts on Food Security and Nutrition (HLPE) tries to demonstrate the potential impacts of food losses and waste on the sustainability of food systems (Table 2). Regarding economic impacts to food chain actors and to consumers, different actors/agents suffer different economic impacts and net costs (or even gains), which depend on their position in the food system. Any effect of price increase, due to food loss and waste (FLW), is different for net sellers versus net buyers of food. Also, depending on their market or purchasing power, and/or on their position and capacity of coordination in the production chain, some agents may suffer less from FLW and “push” the costs of inefficiency to less well-positioned agents. In non-competitive markets, most likely the consumer ultimately pays for the inefficiency and economic losses in the production process. In markets where there is greater competition, economic losses can be assumed by subaltern agents that under contract must submit to the
510 360 185 195 340 0 100 200 300 400 500 600 Agricultural Production Postharvest handling and storage
Processing Distribution Consumption
standards imposed by the "chain coordinator" (often a major supermarket company, a trader or even a processing industry). However, even in those cases where there is competition, the inefficiency of the food systems always translates into a higher price of food for consumers, everything else being equal. Large amounts of FLW lead, everything else being equal, to proportionally less efficient outcomes of public resources used for productive programmes for agriculture, capacity building, training and subsidies.
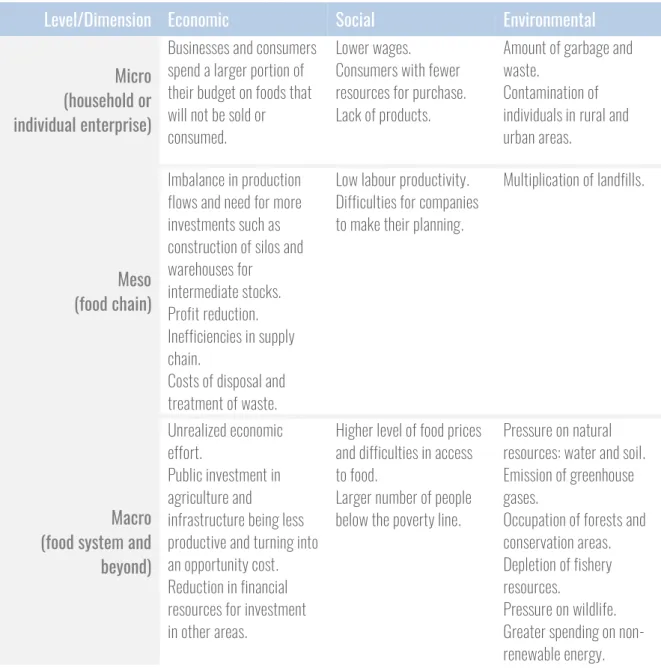
Table 2 - Examples of potential impacts of food losses and waste on the sustainability of food systems. Adapted from “Food losses and waste in the context of sustainable food systems” (Security 2014).
Level/Dimension Economic Social Environmental
Micro (household or individual enterprise)
Businesses and consumers spend a larger portion of their budget on foods that will not be sold or consumed.
Lower wages. Consumers with fewer resources for purchase. Lack of products.
Amount of garbage and waste.
Contamination of individuals in rural and urban areas.
Meso (food chain)
Imbalance in production flows and need for more investments such as construction of silos and warehouses for
intermediate stocks. Profit reduction. Inefficiencies in supply chain.
Costs of disposal and treatment of waste.
Low labour productivity. Difficulties for companies to make their planning.
Multiplication of landfills.
Macro (food system and beyond)
Unrealized economic effort.
Public investment in agriculture and
infrastructure being less productive and turning into an opportunity cost. Reduction in financial resources for investment in other areas.
Higher level of food prices and difficulties in access to food.
Larger number of people below the poverty line.
Pressure on natural resources: water and soil. Emission of greenhouse gases.
Occupation of forests and conservation areas. Depletion of fishery resources.
Pressure on wildlife. Greater spending on non-renewable energy.
With regards to social impacts, the high volume of losses in agriculture in developing countries ends up impacting also on labour productivity (marketable output per worker) and therefore on wages, which in turn can slow down the expansion of the consumer market, which would have boosted the producers for the acquisition of new technologies. From the social point of view, this is a vicious cycle that reduces the availability of resources both in the hands of producers and consumers. It is challenging to exit this cycle. Production cost is an important decision element at micro level.
Relatively to environmental impacts, FLW entails both a needless use of resources used to produce the food lost and wasted, and the impact of putting waste at disposal, with emissions of methane, a potent GHG (Security 2014).
Waste treatment
Some of the conclusions from the paper “Waste – Investing in energy and resource efficiency” (Modak 2011), written for Green Economy magazine, are that the increasing volume and complexity of waste is posing threats to ecosystems and human health, but opportunities do exist to green the waste sector. These opportunities come from the growing demand for improved waste management and for resource and energy recovery from waste. This change in demand is driven by cost savings, increased environmental awareness and increasing scarcity of natural resources.
The growth of the waste market is a reflection of the underlying demand for greening the sector, especially the new paradigm of linking waste to resource use across the life-cycle of products. Different countries face different waste related challenges, but the path to greening the waste sector shares common milestones. Prevention and reduction of waste at source is essential for all countries, although this is particularly important in developing countries given their higher level of population growth and increasing material and resource consumption. The absolute growth of population and income implies that the absolute volume of waste is unlikely to decline. Greening the sector is therefore the only way to go.
Concerning waste treatment, Eurostat tells that in 2012, some 2 302 million tonnes of waste were treated in the EU-28; this includes the treatment of waste imported into the EU and the reported amounts are therefore not directly comparable with those on waste generation (Eurostat 2016) .
Figure 4 shows the development of waste treatment in the EU-28 for each of the main treatment categories during the period from 2004 to 2012. The quantity of waste treated by disposal in 2012 was slightly (0.4 %) lower than it had been in 2004. The quantity of waste recovered (excluding energy recovery) grew from 890 million tonnes in 2004 to 1 053 million tonnes in 2012, and increased by 18.3 %. As a result, the share of recovery in total waste treatment rose from 42.1 % in 2004 to 45.7 % by 2012. Waste incineration (including energy recovery) saw an overall increase between 2004 and 2012 of 27.4 % (Eurostat 2016).
Their News release from 2015 goes even further as to demonstrate the Municipal waste generation and treatment in the EU from 1995 to 2013 (Figure 5).
Figure 4 - Development of waste treatment in the EU-28 (million tonnes). Adapted from "Waste statistics" (Eurostat 2016). 0 500 1000 1500 2000 2500 2004 2008 2010 2012
Incineration/energy recovery Recovery (excluding energy recovery) Disposal (excluding incineration)
Figure 5 - Municipal waste generation and treatment in the EU (refers to EU27, excluding Croatia, for the years 1995 to 2006 and to EU28 from 2007 onwards) in kg per person. Adapted from "Generation of waste by economic activity" (Eurostat 2015a).
“In the European Union (EU), the amount of municipal waste generated per person in 2013 amounted to 481 kg, down by 8.7% compared with its peak of 527 kg per person in 2002. Since 2007, the generation of municipal waste per person has constantly decreased in the EU to below its mid-1990s level. Of the 481 kg of municipal waste generated per person in the EU in 2013, 470 kg per person were treated. This treatment followed different methods: 31% was landfilled, 28% recycled, 26% incinerated and 15% composted. The share of municipal waste recycled or composted in the EU has steadily increased over the time period, from 18% in 1995 to 43% in 2013” (Eurostat 2015a). It is possible to see an obvious increase in recycled or composted waste from 1995 to 2013 and can only hope that it continues like this.
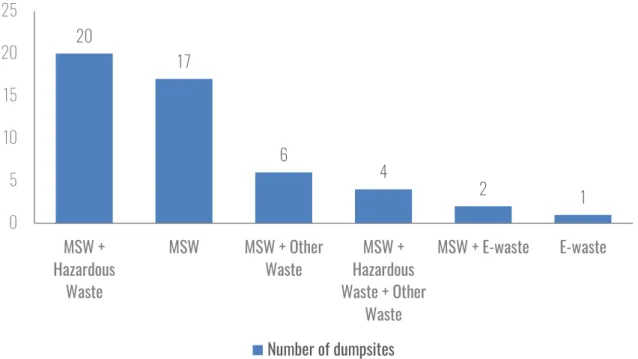
Figure 6 displays the number of dumpsites accepting different combinations of waste types around the world, as can be found on the 2014 report “Waste Atlas – The World’s 50 Biggest Dumpsites” (Atlas 2014). Almost all cases accept mixed municipal solid waste (MSW); and in almost half (24 out of 50) co-disposal of hazardous waste is practiced. Co-co-disposal of E-Waste is also common (6 out of 50), whereas in a few cases indescribable (other waste) find their way there.
0 100 200 300 400 500 600 95 96 97 98 99 00 01 02 03 04 05 06 07 08 09 10 11 12 12
Figure 6 - Number of dumpsites accepting different combinations of waste types. Adapted from “Waste Atlas - The World's 50 Biggest Dumpsites” (Atlas 2014).
So, there is undoubtedly action, towards waste management, being taken around the world. However, there is still a long road for it to be perfect or even positive in a noticeable way.
Table 3 shows a glimpse at what the costs of this inaction can be, based the document from 2012, “Global Waste Management Outlook - Summary for Decision-Makers”, by David C. Wilson and others, integrated in the United Nations Environment Programme (UNEP) and with the cooperation of the International Solid Waste Association (ISWA)
The same source alerts for the fact that proper waste management makes economic sense but still has a financial cost, since affordability is a major challenge in developing countries, even the poorest will pay something when they can see and raising finance for investment in modern facilities continues to be a challenge in all countries.
The benefits are, nevertheless, substantial. Making less that goes to waste saves business money on raw material, energy and labour costs and the estimated savings to business worldwide are in the hundreds of billions of dollars per year (David C. Wilson 2012).
20 17 6 4 2 1 0 5 10 15 20 25 MSW + Hazardous Waste MSW MSW + Other Waste MSW + Hazardous Waste + Other Waste MSW + E-waste E-waste Number of dumpsites
Table 3 - Costs of inaction towards waste management. Adapted from “Global Waste Management Outlook - Summary for Decision-Makers” (David C. Wilson 2012).
Areas of Impact Costs of Inaction
Public health impacts of uncollected waste
Gastrointestinal and respiratory infections, particularly in children.
Blocked drains aggravate floods and spread infectious disease.
Environmental impacts of open dumping and burning
Severe land pollution and freshwater, groundwater and sea pollution.
Local air pollution and climate change.
Costs to society exceed the financial costs per capita of proper waste management by a factor of 5-10
Health care. Lost productivity. Flood damage.
Damage to businesses and tourism.
Because this dissertation is directed towards Product and Industrial Design, these 12 principles of green engineering are presented (Table 4) from the authors Paul Anastas and Julie Zimmerman (2003). It is sometimes said that small steps can be giant leaps in the direction of achieving greater things. Maybe these twelve steps can be the beginning of something in the right direction.
Table 4 - 12 Principles of Green Engineering. Adapted from "Through the 12 Principles - Green Engineering." (Paul T. Anastas 2003).
Principles Description
1 Designers need to strive to ensure that all material and energy inputs and outputs are as inherently non-hazardous as possible. 2 It is better to prevent waste than to treat or clean up waste after it is formed.
3 Separation and purification operations should be designed to minimize energy
consumption and materials use.
4 Products, processes, and systems should be designed to maximize mass, energy, space, and time efficiency. 5 Products, processes, and systems should be “output pulled” rather than “input pushed” through the use of energy and materials.
6 Embedded entropy and complexity must be viewed as an investment when making design choices on recycle, reuse, or beneficial disposition. 7 Targeted durability, not immortality, should be a design goal.
8 Design for unnecessary capacity or capability (e.g., “one size fits all”) solutions should be considered a design flaw. 9 Material diversity in multicomponent products should be minimized to promote disassembly and value retention. 10 Design of products, processes, and systems must include integration and interconnectivity with available energy and materials flows. 11 Products, processes, and systems should be designed for performance in a
commercial “afterlife”.
2.2. Coffee Statistics and Data
Having in mind that coffee becomes a waste at the end of its life cycle and trying to contextualize this study even further, some figures are presented next.
According to data from the International Coffee Organization (ICO), it’s estimated that its global consumption in 2014 was 149.8 million 60 kg bags (Organization 2015b).
In Portugal, in the same period, the consumption amounted to 823.000 bags and the consumption per capita was around 4.7 kg (Organization 2015d).
As stated by the same source, the annual coffee consumption from 2011 to 2014 has suffered an increase of 2.4% (Figure 7). It is also clear that this is a gradual increase as it happened yearly. We can therefore assume that it will continue to exist in the near future.
Figure 7 - Average annual growth rate (million bags) in global coffee consumption since 2011. Adapted from "The Current State of the Global Coffee Trade" (Organization 2015b).
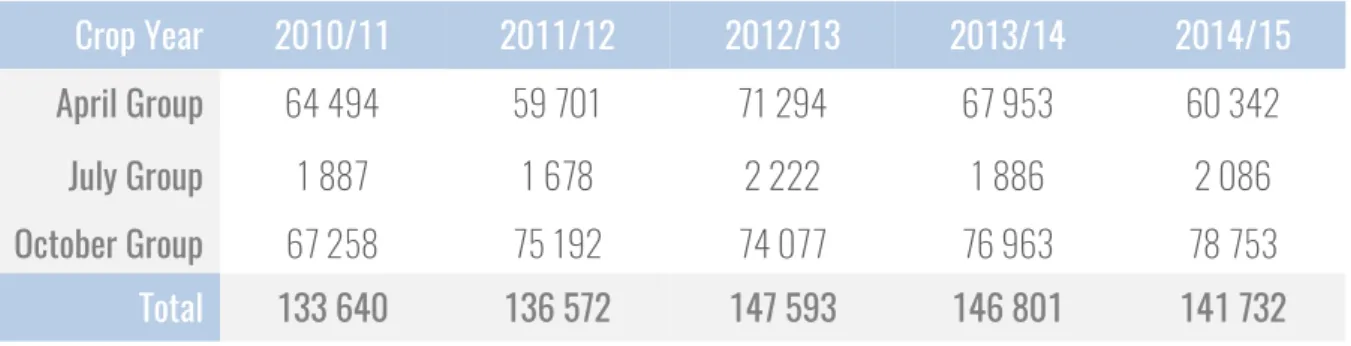
From 2010 to 2015 there was an increase in total production of coffee by all exporting countries by almost 100 thousand 60kg bags and the October group of nations was always on the lead, being the July group the less productive (Table 5).
80 80 82 84 120 122 124 125 140 145 148 152 0 20 40 60 80 100 120 140 160 2011 2012 2013 2014
Table 5 - Total production by all exporting countries in thousand 60kg bags. Adapted from “Total production by all exporting countries” (Organization 2015e).
Crop Year 2010/11 2011/12 2012/13 2013/14 2014/15
April Group 64 494 59 701 71 294 67 953 60 342
July Group 1 887 1 678 2 222 1 886 2 086
October Group 67 258 75 192 74 077 76 963 78 753
Total 133 640 136 572 147 593 146 801 141 732
Figure 8 provides information on coffee production by continent from 2012 to 2014. The values remain similar from one crop year to the other, but there is, however, an evident aggrandizement from South America where production achieves greater numbers.
Figure 8 - Coffee production by continent in million bags. Adapted from “Annual Review 2013-2014 Strengthening the global coffee sector through international cooperation” (Organization 2015a).
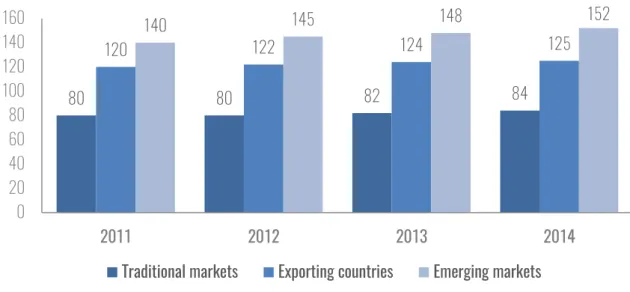
By analysing the composition of world consumption (Figure 9), it becomes evident that although the traditional markets are still on the lead, their leadership is also decreasing while emerging markets kept growing for the last 20 years and as ICO explains in their annual review 2013/14 (Organization 2015a), a particularly strong growth has been observed in East and Southeast Asia, such as Indonesia, Vietnam and South Korea. Traditional consuming markets have registered more modest growth rates of around 1.3% per annum. Coffee demand in the European Union has stagnated somewhat recently, although consumption in
16,5 45,3 18,5 67,1 16,2 46,6 16,8 67,2 0 20 40 60
Africa Asia & Oceania Mexico & Central
America South America
total, but this percentage share is diminishing, and the strongest potential for further growth can be found in emerging markets.
On Table 6, the consumption of selected importing countries from 2004 to 2014 is revealed, where it is easily understood that consumption in total has been rising as well and there is a clear difference in numbers between the European Union and the USA relatively to the other regions.
Figure 9 - Composition of world consumption. Adapted from “Annual Review 2013-2014 Strengthening the global coffee sector through international cooperation” (Organization 2015a).
Table 6 - Disappearance (consumption) in selected importing countries in thousand 60kg bags. Adapted from “Disappearance (consumption) in selected importing countries” (Organization 2015c).
Year 2004 2006 2008 2010 2012 2014 European Union 41 743 41 586 40 700 41 207 41 018 41 648 Japan 7 117 7 268 7 065 7 192 7 131 7 494 Norway 709 721 715 746 723 729 Switzerland 722 932 1 149 1 012 1 047 1 028 Tunisia 263 200 317 301 421 460 Turkey 403 497 484 610 681 929 USA 20 973 20 667 21 652 21 783 22 232 23 761 Total 71 930 71 872 72 082 72 851 73 252 76 049 67% 12% 21% 58% 16% 26% 50% 19% 31% 0% 10% 20% 30% 40% 50% 60% 70% 80% 90% 100%
Traditional markets Emerging markets Exporting countries
If, on the other hand, one wants to see how coffee consumption has been between continents from 2011 to 2014, Table 7 displays exactly this. On the right column is the compound growth rate (constant rate of return over a time period) where there is an obvious raise in consumption all over, except for Central America and Mexico, with the most apparent rise coming from Africa.
Table 7 - World coffee consumption in thousand 60kg bags. Adapted from “World coffee consumption” (Organization 2015f) Year 2011 2012 2013 2014 CAGR World Total 139 483 143 140 147 113 149 823 2.4% Africa 9 170 10 081 10 624 10 809 5.6% Asia & Oceania 26 452 28 014 29 159 30 446 4.8% Central America & Mexico 4 974 5 035 5 030 4 979 0.0% Europe 49 311 49 461 50 493 51 109 1.2% North America 25 618 25 730 26 931 27 674 2.6% South America 23 958 24 820 24 875 24 807 1.2%
Specialty Coffee Association of America (SCAA) also affirms that the consumption in the five leading importing countries (France, Germany, Italy, Japan, and the United States) bounced to about 37.3 million bags during the period January to September 2010, as compared to with 36.5 million bags for the same period the previous year. While traditionally viewed as an export crop, coffee consumption in coffee producing countries on the rise, increased by 3.9% between 2004 and 2008. Many experts predict that Brazil will displace the United States as the single largest coffee consuming market in the world within the next few years, somewhere from 2014 to 2016. Emerging markets (considered those outside of the EU, US, and Japan) are another source of growth, with consumption increasing 4.7% between 2004 and 2008. The United States imported more than 21.5 million bags during the 2008/09 coffee year, accounting for more than one quarter of global coffee (un-roasted) imports, making it the world’s largest single buyer. Brazil, Colombia, and Vietnam account for 21%, 19%, and 11% of those imports, respectively. Drip coffee sales
improved to 4.7% in the 4th quarter of 2010 compared to up 3.5% in the 3rd quarter. Espresso grew 4.1% in the 4th quarter, fairly similar to the 3rd quarter. In recent years, there has been a huge surge in Arabica coffee demand from large, emerging markets including Brazil, India, and China. These countries have growing middle classes which been providing high demand for good coffee and they are competing with the United States to purchase these gourmet coffee beans. Coffee preparation at home is up 4 percentage points with 86% of past-day coffee drinkers reporting that they made coffee at home (America 2012). As can be seen by the information provided on Figure 10, the USA is still the top coffee consuming country, followed closely only by Brazil. For this reason, the next two figures show data only relative to the United States of America.
Figure 10 - Top 5 Countries by Sheer Tonne Coffee Consumption. Adapted from "Caffeine (Coffee) Consumption by Country" (Foster 2016).
Figure 11 represents the source of caffeine for individuals (Americans) 22 years old and over, just so we can comprehend how much more of it is consumed through coffee, relatively to other sources of caffeine and is, therefore, coffee such a good choice for reuse as a material.
The graph on Figure 12 gives an idea of the range of ages that consume the most coffee daily and these are, in fact, the ones that have the financial condition to buy it regularly.
971 969 425 211 202 0 100 200 300 400 500 600 700 800 900 1000
USA Brazil Germany Italy France
Figure 11 - Source of caffeine for individuals 22 years and over in milligrams. Daily intake: 300.7 milligrams. Adapted from “Caffeine Intake by the U.S. Population” (Somogyi 2010).
Figure 12 - Daily consumption of coffee by the U.S. population in 2009. Adapted from “Caffeine Intake by the U.S. Population” (Somogyi 2010).
On the infographic by Food Republic from 2015, it can be learned that the coffee business has grown to be huge and it doesn’t seem to be showing any signs of stopping. In fact, between 2000 and 2010, the value of world coffee exports grew by over 85%, from $8.3 billion to $15.4 billion (Republic 2015).
206,5 28,6 40,5 22,8 2,3 Coffee Tea Carbonated Beverage Other Beverages Food 0,73 0,92 0,95 1,46 2,03 2,25 2,14 2,08 1,76 0 0,5 1 1,5 2 2,5 18/19 20/24 25/29 30/39 40/49 50/59 60/69 70+ All Ages
One of the reasons for this to happen might be explained with the 1999 paper titled “Actions of Caffeine in the Brain with Special Reference to Factors That Contribute to Its Widespread Use” (Bertil B. Fredholm 1999), where it’s concluded that it is clear that caffeine cannot really be considered a model drug of dependence, at least not if by “model” is meant “typical”. Its weak reinforcing properties are due to a unique and atypical mechanism of action. The drug is self-limiting and subjects do not gradually increase the dose, because tolerance development to both the reinforcing and aversive effects is limited. There are few negative consequences of caffeine use in moderation and the withdrawal affects are modest and transient in the individuals that experience them. Because caffeine will, according to current drug classification schemes, be designated a drug of dependence, and that it will not, in this respect, be different from drugs such as amphetamine, morphine, ethanol, or nicotine, it is possible that, in addition to the qualitative criteria, some quantitative criteria of relative abuse potential and negative health consequences would be useful in a modified drug classification scheme. This is particularly true for a drug whose use is so entrenched in normal societal activities. So, in short, although coffee might be considered a drug for its own characteristics and addictive properties, its behaviour on the brain doesn’t work in the same way as other drugs.
Another reason for this is that the world's coffee industry has responded to any crisis by working tirelessly to increase coffee consumption worldwide. The ongoing effort to increase coffee consumption has included identifying market saturation points, developing quality control mechanisms, encouraging farmers to maintain high standards and rewarding coffee roasters for developing new varieties and blends of coffee. The efforts of the International Coffee Organization to raise coffee consumption around the world are paying off. Despite the fact that coffee prices have risen, there is more coffee traded, sold and enjoyed each year. Marketing thrusts by the ICO have turned coffee drinking into a fine art and encouraged people to think of coffee as an affordable luxury (Larkin 2016). Nonetheless, it’s pretty clear that coffee’s consumption is not stopping any time soon and by all the data presented on this chapter, it’s just logical to assume that it will continue to grow.
This chapter appears as a way to validate the use of coffee waste as a design material. The first section shows that waste in general is growing and there are no predictions for this growth to slow down. And although there are already waste treatment strategies in place, if it could be reused in the same or in a
similar way that this study is trying to demonstrate for spent coffee grounds, this problem might not exist in a near future.
Section two focuses on coffee because it is the base material for this thesis and to further demonstrate that if nothing is done regarding its reuse, its consumption will still continue to grow as it is such an intrinsic part of our society and it would be a shame to let such a substance, with so many interesting characteristics go to waste.
Furthermore, for the time being, the use of most wastage materials allow for a no cost approach, making this an unrivalled advantage. For all these reasons, it becomes apparent on this chapter that coffee waste really is a good choice for a substance to be reused as a material on the creation of design products. It is also obvious that its abundance will continue to exist and designers should see this as an opportunity.
CHAPTER III
/ STATE OF THE ART
STATE OF THE ART
On this chapter is presented the state of the art, regarding coffee reuse strategies. Some simpler than others, but their goal remains the same. It is also intended to exhibit the type of solutions for coffee waste in additive manufacturing, as well as some design applications for the same purpose.
The last section focuses on the characteristics of the material symbiosis between coffee waste and PLA (polylactic acid), through testing. These tests are justified and an integral part of this study, as will be demonstrated further on this document, on chapter four.
The obvious reason for this, is to understand if there is already action being taken towards the reuse of the chosen substance or not, and if more could be done.
In order to give some context to the theme, coffee’s historical background and origins are provided next. Coffee’s beans, from which coffee is brewed, constitute the primary source of caffeine. The caffeine content in coffee varies widely, depending on the type of coffee bean and the method of preparation; even beans from a given coffee bush can vary in their caffeine concentration. Roasted coffee beans contain 0.8–2.5% caffeine. Generally, dark-roast coffee has less caffeine than lighter roasts because the roasting process reduces the bean's caffeine content. Arabica coffee normally contains less caffeine than the Robusta variety. In general, one serving of coffee ranges from 64 mg for a single cup (30 ml) of espresso to about 145 mg for an 8 oz. (ounce) cup (237 ml) of automatic drip coffee (Somogyi 2010).
All commercial coffee species originate from Africa and belong to the genus Coffea. The high quality Coffea Arabica species originates from the rainforests in the southwestern highlands of Ethiopia. One theory suggests that the Ethiopians took it to Yemen when they conquered the country by AD 500. Another
hypothesis says that Arab merchants brought it initially to Yemen and the Arabian Peninsula, where it was cultivated and has contributed to the prosperity of the seaport of Mocca. This explains why Arabica coffee is associated with the name Mocca, although the prime centre of origin and diversity is on the African continent (Hermann A. Jurgen Pohlan).
Pecevi, an Ottoman historian of the early seventeenth century, writes: “Until the year 962 (1554-55), in the High, God-Guarded city of Constantinople, as well as in Ottoman lands generally, coffee and coffeehouses did not exist. About that year, a fellow called Hakam from Aleppo and a wag called Shams from Damascus came to the city: they each opened a large shop in the district called Tahtalkala, and began to purvey coffee. These shops became meeting places of a circle of pleasure seekers and idlers, and also of some wits from among the men of letters and literati, and they used to meet in groups of 20 or 30” (Kafadar 2016).
3.1. Reuse Strategies for Coffee
In the particular case of coffee, there are already reuse strategies in several areas, from agriculture to fuel and to begin with, next are displayed 14 genius ways to recycle used coffee grounds, by Natural Living Ideas (Table 8).
Table 8 - 14 Genius Ways To Recycle Used Coffee Grounds. Adapted from "14 Genius Ways To Recycle Used Coffee Grounds" (Ideas 2014).
This list is divided by areas of interest such as garden, around the house and health and beauty and the author presents some pretty ingenious ways for coffee grounds waste reuse.
Regarding the garden area, it’s already well known that coffee has particularities that might be of interest. On the around the house area we can see five inventive ways of reusing coffee, like absorbing food odours or making homemade candles. There are even solutions for it on health and beauty like making creams for the skin or even treatments for hair. Another good solution is the caffeinated soap.
These are the simpler solutions for which coffee waste can be reused by anyone. Next we will be looking at some more serious answers for this problem, also in different areas of interest.
Coffee waste has been consolidating itself as one of the most abundant biological resources of the world for use as green energy (Gómez-de la Cruz 2015). There are several investigators, from different parts of the planet, already studying the possibility of transforming coffee waste as a biofuel.
Area of Interest
Garden
Pest Repellent Fertilize Your Garden Compost it for Later Caffeine for Carrots
Around the House
Absorb Food Odours Natural Abrasive Beautiful Golden Dye Homemade Candles Clean Out the Fireplace
Health and Beauty
Exfoliate Skin Rejuvenating Facial Caffeinated Soap Coffee for Your Hair Cellulite Treatment
For instance, researchers from South Korea have written a paper titled “Direct power generation from waste coffee grounds in a biomass fuel cell” (Hansaem Jang 2015), where they highlight that waste biomass is directly employed as a fuel with no any special treatment. Waste coffee ground is a fuel for SOFC-based (solid oxide fuel cell) carbon fuel cell technology. Carbonization and gasification take place under experimental temperature. Produced in-situ gaseous compounds highly enhance electrochemical reaction. They write “We demonstrate the possibility of direct power generation from waste coffee grounds via high temperature carbon fuel cell technology”. Figure 13 illustrates what they are trying to do, by turning coffee waste into electrical energy by means of carbon fuel cell technology. And their work is not being unnoticed, as they are mentioned in Fuel Cells Bulletin journal (Bulletin 2015), where it’s said that researchers at Kwangju Institute of Science and Technology in South Korea have succeeded in generating power from used coffee grounds, in a high-temperature direct carbon fuel cell. This performance is expected to offer new possibilities as an energy source while contributing to environmental protection, by providing stable electric power utilising recycled coffee grounds.
But there are several other teams of research working on this subject. Other example comes from another group from South Korea, but in this case they conclude that it’s not the coffee grounds that may be converted into energy, but instead it’s the crude lipids extracted from them. They state “The sequential co-production of bioethanol and biodiesel from spent coffee grounds was investigated. The direct conversion of bioethanol from spent coffee grounds was not found to be a desirable option because of the relatively slow enzymatic saccharification behaviour in the presence of triglycerides and the free fatty acids (FFAs) found to exist in the raw materials. Similarly, the direct transformation of the spent coffee grounds into ethanol without first extracting lipids was not found to be a feasible alternative. However, the crude lipids extracted from the spent coffee grounds were themselves converted into fatty acid methyl ester (FAME) and fatty acid ethyl ester (FAEE) via the non-catalytic biodiesel transesterification reaction”. And finish with “Thus, this
study clearly validated our theory that spent coffee grounds could be a strong candidate for the production of bioethanol and biodiesel” (Eilhann E. Kwon 2013), concluding that it is in fact possible to use the waste from coffee grounds and turn it into bioethanol and biodiesel.
And it doesn’t end here, as a team in Germany wrote an article for the Journal of Energy Chemistry in 2015 titled “Spent coffee ground as source for hydrocarbon fuels” (Peter Dohlert 2015), where can be learned that the conversion of triglycerides (coffee oil) obtained from spent coffee ground to produce hydrocarbon fuel (diesel) was studied. They finish by saying that it was established a protocol for the conversion of coffee oil (triglycerides) derived from spent coffee ground to hydrocarbons, which can be applied as diesel fuel. With tris-(pentafluorophenyl)-borane as catalyst the coffee oil was hydro-deoxygenated applying polymethylhydrosiloxane (PMHS) as cheap reductant under mild reaction conditions. For instance, from 1 kg spent coffee ground potentially 77 g of hydrocarbons can be produced.
As in almost every area of interest and progress, the United States are always present and this couldn’t be different. Researchers from the University of Nevada have also written a paper in 2008 (Narasimharao Kondamudi 2008), which describes an approach to extract oil from spent coffee grounds and to further transesterify the processed oil to convert it into biodiesel. It continues by saying that this process yields 10-15% oil depending on the coffee species (Arabica or Robusta). The biodiesel derived from the coffee grounds (100% conversion of oil to biodiesel) was found to be stable for more than 1 month under ambient conditions. It is projected that 340 million gallons of biodiesel can be produced from the waste coffee grounds around the world. The coffee grounds after oil extraction are ideal materials for garden fertilizer, feedstock for ethanol, and as fuel pellets.
However, there are other completely different areas that are studying possibilities for reusing coffee waste. In Japan, scholars have shown that it can be used in adsorption of dyes onto carbonaceous materials produced from coffee grounds by microwave treatment. They say that “organic wastes have been burned for reclamation. However, they have to be recycled and reused for industrial sustainable development. Carbonaceous materials were produced from coffee grounds by microwave treatment. There are many phenolic hydroxyl and carboxyl groups on the surface of carbonaceous materials. The base consumption of the carbonaceous materials was larger than that of the commercially activated carbon. The carbonaceous