Equ
ity
Va
luat
ion
o
f
M
i
l
lennium
BCP
M
igue
l
van
Ze
l
ler
152412017
D
issertat
ion
wr
itten
under
the
superv
is
ion
o
f
Pro
fessor
José
Car
los
Tude
la
Mart
ins
D
issertat
ion
subm
itted
in
part
ia
l
fu
l
f
i
lment
o
f
requ
irements
for
the
MSc
in
F
inance
,
at
the
Un
ivers
idade
Cató
l
ica
Portuguesa
,
March
28
,
2018
.
Research Note
Better winds are coming for the Portuguese
Banking Sector…
Following the Portuguese and Global economic crises that led to the bail out and IMF intervention in 2011, the Portuguese economy shows early signs of recovery: GDP started to grow,
unemployment reduced and Government debt are now reaching sustainable levels.
The overall Portuguese banking system had a specially challenging period (2011-2016), in which faced 1) decrease in Net Interest Margin driven by low (and negative) interest rates and balance sheet deleverage, 2) decrease in Commissions both as percentage of volume and as leakage, 3) reduction in Operational costs that were insufficient to compensate the profitability erosion, 4) increase in Impairments driven to high volumes of foreclosed assets and high NPL ratios and 5) increase in capital regulatory constrains
Looking forward, both the Portuguese economic outlook and the banking system outlook are favourable, leading to an upwards expectation on the BCP fair value share price rounding 0.41 €. This increase in the expected price is mainly supported by:
i) Expectation in the increase of interest rates, specifically Euribor, that will positively contribute to the increase in Net Interest Income, due to different elasticities on interests on assets and liabilities;
ii) Likely recover in Balance Sheet growth on the commercial side (credit and deposits) driven by the European economic recovery, affecting both Portugal and Poland
iii) Predictable reduction in Risk Costs to pre-crisis historical levels (~0.6%)
BUY Upside of 41%
Fair Value (€) 0.41
Market ticker BCP Price per Share (€) 0.29 Market Cap (Mn€) 4,398 Outstanding Shares (Mn) 15,114
Source: Dissertation analysis; Bloomberg
Performance of BCP Source: Bloomberg Key indicators (2020) Total Assets (Mn€) 77,788 Net Profit (Mn€) 763 RoE 8.5% CET1 ratio 14.1%
Abstract
One of the most difficult tasks in the financial industry is to correctly access the fair value of a stock. In theory, the price of a stock should converge to its fair value over time, however the real fair value and the speed in which it will convert is what makes the stock price so difficult to predict. In order to perform a precise valuation, one should understand the intrinsics of the business and perform a variety of valuation methods in order to access the fair value. In this dissertation, I will analyze Millennium BCP, the major private bank in Portugal, stock price using mainly 2 methods: Dividend Discount Model and Multiples Valuation. These 2 methods combined resulted in a BUY recommendation, with an estimated fair price of €0.41 per share.
In the end of the dissertation, I also compared my recommendation with JP Morgan Investment Bank report, to access the differences between my valuation and the Investment Bank valuation increasing the robustness of the final results. From this comparison, resulted that although JP Morgan used a different valuation method, the bank and the thesis recommend to BUY the Millennium’ stock, since both are optimistic on the future of the bank and the overall Portuguese banking system.
Abstrato
Uma das tarefas mais difíceis no setor financeiro é acessar corretamente o justo valor de uma ação. Em teoria, o preço de uma ação deve convergir para seu justo valor ao longo do tempo, no entanto, o justo valor real e a velocidade na qual este deverá convergir, torna a previsibilidade do preço das ações uma tarefa muito complexa. Para se realizar uma avaliação precisa, deve-se entender os fundamentos do negócio e executar uma variedade de métodos de avaliação para assim ter uma melhor precessão do justo valor. Nesta dissertação, irei avaliar o Millennium BCP, o maior banco privado em português e acessar o justo valor das suas ações, utilizando 2 métodos: Modelo de Descontos de Dividendos (Dividend Discount Model) e Avaliação por Múltiplos. Depois da aplicação destes dois métodos o resultado da análise foi uma recomendação de compra (BUY) da ação do banco, com um preço estimado de € 0,40 por ação.
No final da dissertação, também foi realizada uma comparação da recomendação da dissertação com o relatório do banco de investimento JP Morgan, para aceder às principais diferenças entre a minha avaliação e a avaliação deste Banco de Investimento, aumentando assim a robustez dos resultados finais. Desta comparação, resultou que, embora o JP Morgan tenha utilizado um método de avaliação diferente, a JP Morgan e a dissertação recomendam comprar (BUY) a ação do Millennium, dado que ambos estão otimistas quanto ao futuro do banco e do sistema bancário português em geral.
Acknowledgements
After completing all the Master’s in Finance courses in 2014 and joining McKinsey & Company in September 2014, the only step missing in my professional life was the master thesis. It was not by chance that the thesis took so long. Successfully completing a dissertation that leverages in all the knowledge obtained during the masters and in my professional life was not an easy task. With such a difficult task in hands, I encountered both times of frustration but also times of great accomplishments.
Firstly, I would like to thank professor and my advisor José Carlos Tudela Martins for his availability and help completing this thesis. His absolute availability to help me, combined with his deep financial knowledge was fundamental for the success of this paper.
Secondly, I also want to thank all the Catolica-Lisbon professors and support staff for all the excellence and support that makes this school one of the best business schools in the world.
Finally, I feel that, although not directly involved in this work, I need to thank my family, friends, colleagues for their support and help during the conception of this dissertation and all the masters’ period.
Table of Contents
I. Introduction ... 1
II. Literature Review... 3
A. Discounted Cash Flow (DCF) models ... 3
A1. Free Cash Flow to Firm Valuation ... 4
A2. Free Cash Flow to Equity Valuation ... 5
A3. Dividend Discount Model (DDM) ... 5
A4. Adjusted Present Value (APV) model ... 6
A5. Capital Cash Flow model ... 6
Deep-dive on major DCF models components ... 7
Terminal Value... 7
Risk-Free Rate and Risk Premium ... 8
Cost of Equity ... 8
Weighted Average Cost of Capital (WACC) ... 8
B. Multiples Valuation ... 9
C. Economic Value Added (EVA) ... 10
D. Options Pricing ... 11
E. Asset Based Approach ... 11
F. DuPont Method ... 11
III. Valuation of the company... 13
B. European and Portuguese Banking Sector Crises and Transformation ... 13
C. Recent Portuguese banking recovery ... 14
D. Millennium BCP current performance and projections ... 15
D1. Macroeconomic conditions ... 15
D2. Assets ... 17
D3. Liabilities ... 21
D4. Net fees and commissions ... 23
D5. Operational Costs ... 24
D6. Risk Costs ... 26
D7. Overall results ... 27
E. Millennium BCP valuation scenarios ... 30
E1. Dividend Discount Model (DDM)... 30
E2. Multiples Valuation ... 32
IV. Differences between values and methods of the investment bank ... 35
I. Introduction
Since the beginning of the studies in finance, researchers have been analyzing methods to maximize return at the same time they minimize the risks associated with the investment. During this intense research for the perfect capital allocation model, several theories have been created and refuted, but the importance of understanding the business and the underlying assets of each financial vehicle were never discarded and have been growing in importance over that last few decades.
The study of equity valuation is not only important for the investors that need to allocate their capital, but it is also important for business purposes. For example, the studies of cash flows and capital invested in the valuation of a specific project came as a fundamental tool on the top management investing decisions. In these specific cases, the understanding of the underlying business is even more important, since it should be understood in the context of a whole company and may imply significant one-off investment decisions that may influence the whole business. Moreover, Equity valuation became increasingly important in the consolidation of many industries, in the last decades, where many players use inorganic measures, such as Mergers and Acquisitions to grow, rather than entering in risky and slow long-term investments. All in all, a deep knowledge of the valuation tools is fundamental to strategically access the investments both at an individual and at a company level.
Nowadays, it is fundamental that one have at least the basic finance knowledges in order to succeed in the business world. This knowledge should be not confined only to investment bankers and financial investors, since most of the tie breaking decisions taken have some financial calculation behind. This is equally important when it comes to maximizing the profit of a company. One should be able to access what the main drivers are that contribute to the positive or negative result to be able to potentialize the business. Furthermore, the increased computation power combined with the wide spread of information, has made the equity valuation a more robust and complete science. Today, it is easy to access the results of peers across the world and include all that information in a model that help investors and managers in their decisions making process.
In order to access the value of the share price of Millennium BCP, in this dissertation, a literature review on the current state of art of equity valuation will be
carried on. Secondly, a company and a sector overview will be presented to better understand the underlying under valuation, analyzing the main milestones occurred and the future overview on the industry. Thirdly, a complete business assessment on the key drivers of BCP will be done and the main variables projected according to the future industry and macroeconomic trends. After that, different valuation methods will be applied to access the overall value.
Furthermore, a comparison between the masters’ thesis valuation and an investment bank one will be performed. This comparison will allow to access the robustness and the pros and cons of the valuation method used.
II. Literature Review
The current / future value of a company is one of the most unpredictable variables studied in finance. It is not by chance that investment banks hire highly qualified professionals to try to predict the value of a company and even though they find a hard time to get some solid recommendation. Since there is no absolute method to determine the fair value of a company, in which the market should converge, researchers developed different valuation methods. Those methods have different advantages and disadvantages, depending on the type of industry, information publicly available and market dynamics. Before jumping to the valuation of BCP, it is important to deeply analyse the state of art of the valuation methods, to be able to wisely choose the adequate valuation methods. In this chapter, A) Discounted Cash Flow (DCF), B) Multiples (trading and transaction), C) Economic Value Added (EVA), D) Option Pricing Model, E) Asset Based Approach and the F) DuPont models will be presented.
A. Discounted Cash Flow (DCF) models
The Discounted Cash Flow methodology, widely known as DCF, is one of the most famous valuation methods used to price a firm, business unit or even a product. It values the business by its capacity of generating cash, discounting the value of that cash to the present. This methodology is very detailed on the specific business being valued, which implies that the one performing this valuation should have significant knowledge about the company business, risks and sustainability of the cash flow generated (Damodaran A. 2002).
Since a company is valued by its capacity to generate cash discounted to the present, the accuracy of the valuation depends on the analysts’ capacity in predicting all the cash flows, both inflows and outflows, that will be generated in the future, as well as the value of those cash flows in the present. In order to capture most of cash flows movements and increase the accuracy of the valuation, analysts should take into account the company’s specific factors, such as productivity and commercial footprint, and market and industry factors, such as money market interest rate changes, GDP growth, among others. Along with this prediction, analysts should also be very careful on the discount rates used, since it measures the risk of the future cash flows, as shown in the formula below:
Value = ∑ 𝐶𝐹 𝑡
Analysing this formula deeply, it is clear that the value of a firm is higher when both the cash flows are higher and the discount rates are lower. This implies that a company with more volatile cash flows has a lower value when compared to a company with more predictable cash flows. There are many factors that may imply more or less predictability, such as country risks, political risks and others. Moreover, Damodaran states that the value of a company in the eyes of an analyst will be never correct, although it can be near the correct one, since there is some asymmetry of information between the private and the public information available to conduct the analysis (Damodaran A. 2002).
Although the Discounted Cash Flow methodology is widely used by analysts, it has some limitations that are important to refer. This method is not completely suitable for companies that have either complex capital structures or complex financing and tax strategies (Luehrman T. 1997).
There are several variations of Discounted Cash Flow models and each one could be most suitable depending on the company / industry specifics. The most important ones are the A1) Free Cash Flow to Firm Valuation, A2) Free Cash Flow to Equity Valuation, A3) Dividend Discount Model (DDM), A4) Adjusted Present Value and A5) Capital Cash Flow.
All the models stated previously are simple to use and the results fairly reliable, since the CFs are foreseeable. However, these models are more difficult to apply in companies that have less cyclical cash flows, intangible assets with less predictable cash flows, among others.
A1. Free Cash Flow to Firm Valuation
The Free Cash Flow to Firm Valuation involves discounting all the cash flows generated to both debt and equity. Those cash flows include the revenues, opex, capex and taxes, but does not consider any remuneration to both share or debt holders. The discount rate considered in this method should be the WACC (Weighted Average Cost of Capital), which takes into consideration the cost of equity (shareholders remuneration), the after-tax cost of debt (debt holders remuneration) and the relative weight attributed to each of these two components. Formula used to apply the Free Cash Flow to Firm Valuation methodology:
Value = ∑ 𝐹𝐶𝐹𝐹𝑡
(1+𝑊𝐴𝐶𝐶)𝑡
A2. Free Cash Flow to Equity Valuation
Similarly to the Free Cash Flow to Firm Valuation, the Free Cash Flow to Equity valuation also involves discounting all the cash flows generated, but in this case only to equity. Those cash flows include the revenues, opex, capex, interests and taxes, but does not consider only remuneration to shareholders. The discount rate considered in this method should be the Cost of Capital, which takes into consideration only the cost of equity, since all the remaining costs are included in the Cash Flow, such as debt interest and principal payments. According to researchers, this method is more complete in terms of cash flows, since it includes everything in the cash flows, except the equity remuneration that becomes the only discount factor, and though simpler to compute (Luehrman T. 1997). Formula used to apply the Free Cash Flow to Equity Valuation methodology:
Value = ∑ 𝐹𝐶𝐹𝐸 𝑡
(1+𝑟𝑒)𝑡
A3. Dividend Discount Model (DDM)
The DDM values a company using the ability to pay dividends as the main driver. The value of a company is presented as the present value of the future expected dividends paid. The underlying assumption of this model is that when an investor buys a share, he/she is expecting to receive dividends along the period the share is held and in the end, receive the final value of the share. Some researchers, such as Farrell, Foerster and Sapp argue that this methodology is especially useful to analyse how inflation and money market interest rates affect the stocks prices and returns to investors (Damodaran A. 2002; Farrell J. L. 1985; Foerster S. R. and Sapp S. G. 2005).
However, some other researchers, such as Liu and Ang, claim that this model has some short falls that are especially important when estimating long term cash flows. This model does not capture some stylized variations, such as differences in the risk-free in time, changes in the risk-premium and other factors that may change in time and impact severally on the company valuation (Liu J. and Ang A. 2004).
Value per share = ∑ 𝐷𝑃𝑆 𝑡
We will use this method on our valuation, since it is a bottom up approach on the valuation of a bank (vs. relative valuation, that will be used as a complementary method) and although it is considered by some analysts old fashioned for firm valuation, it is still a strong method on valuation of banks and other financial companies, due to the difficulties of estimating the cash flows of a financial company (Damodaran 2009).
A4. Adjusted Present Value (APV) model
The Adjusted Present Value (APV) model considers the financing activity and its cash flows separately from the operational business cash flows. Contrary to the traditional WACC models, in which the effects are all taken into account in the discount rate, APV models separates the financing activity and the business activity, so these models are able to account for the exact value of the financing benefits, desegregated from the operation business cash flows. Some researchers, such as Luehrman and Myers, argue that these models are an evolution of WACC models, that are widely used nowadays since they are less complex (Luehrman T. A. 1997, Myers 2011). According to the APV model, a company should be valued as 100% free of debt, and only afterwards added the value of the financing tax benefits and subtracted the expected bankruptcy costs. The formula used to value a business under the Adjusted Present Value (APV):
Value = 100% equity business value + Present value financing tax benefits – Bankruptcy costs
However, Damodaran and other researchers state that this approach has a clear disadvantage related to the bankruptcy costs, since most of the analysts using this model do not take them into account because they are difficult to estimate (Damodaran A. 2002).
A5. Capital Cash Flow model
Like the APV model, the Capital Cash Flow model drives some special attention to the financing tax shields benefits. According to Koller et al, in this model, tax shields must be summed to the cash flow and then discounted at cost of equity. Formula used to value a business under the Capital Cash Flow model (Koller, T., Goedhart, M. & Wessels, D. 2017):
Value (Present value of Capital CF) = ∑𝐹𝐶𝐹𝑡+𝐼𝑇𝑆𝑡
Deep-dive on major DCF models components
Terminal Value
When assessing the value of a company in a DCF model, the analyst divides the model into the explicit period and the terminal value. The explicit period is the period where the analyst does the yearly projection of each variable of the valuation model. There are no specific number of years that should be projected in detail for the analyst make their reports, but they usually have an explicit period between three to five years. However, Koller et al claim that this period should be large enough to capture a full business cycle of the company or some industry specifics. For them the ideal explicit periods usually range from five to seven years (Koller, T., Goedhart, M. & Wessels, D. 2017).
According to researchers, such as Young, Sullivan, Nokhasteh and Holt, after some years of explicit period, the analysts should concentrate their attention in computing the terminal value, rather than spending too much time on extending the explicit period (Young, M., Sullivan, P., Nokhasteh, A. & Holt, W. 1999).
There are usually three ways to compute the terminal value: i) Liquidation Value, ii) Multiples Approach and iii) The stable growth.
i. Liquidation Value is the value of the company as if it would be liquidated. It is based on the book value of the assets in that year and has the disadvantage of not considering the real value / cash flow generation power of those assets;
ii. Multiples approach value uses the expected company’s revenues in the year of liquidation looking at comparable firms;
iii. Sable Growth Model is the model that is most widely used. It requires an estimation of a stable growth in perpetuity and then the terminal value is computed using the following formula:
Terminal valuen = 𝐹𝐶𝐹𝐹 𝑛+1
Risk-Free Rate and Risk Premium
The Risk-Free rate is the amount of return that an investor expects to receive in an investment that has no uncertainty in cash flows, i.e., this investment has a clear amount of return and there is neither default risk nor reinvestment risk. Usually analysts use government bonds of strong countries as a proxy of risk free, since most of the countries control their local monetary policy, thus the risk of default is near to zero, and there are several maturities of government bonds that mitigate the reinvestment risk.
The Risk Premium is the translation of the classic economic risk-return trade off. Damodaran claims that the return that an investor seeks is equal to the sum of the risk-free and the return to reward the extra risk incurred in that investment. This extra risk incurred is usually divided into two major risks: the company specific risk and the market risk. The fist can be mitigated through diversification of the portfolio, but the second cannot, though the investor should be compensated for bearing it. Although there is a large variety of models to compute market risk, it is usually measured using the standard Capital Asset Pricing Model (CAPM) model. Formula used to access the magnitude of this risk is (Damodaran A. 2002):
CAPM expected return = 𝑅𝑖𝑠𝑘 𝑓𝑟𝑒𝑒 + 𝛽 (𝑅𝑖𝑠𝑘 𝑝𝑟𝑒𝑚𝑖𝑢𝑚)
Where Beta is the sensitivity of the expected return to market variations, usually computed using market historical data.
Cost of Equity
The cost of equity is the return that the investor seeks to invest in a certain company. Luehrman claims that the cost of capital should be seen as an opportunity cost for the investor, thus reflecting the risk-free, risk premium and the beta of a company. Given this, both Damodaran and, Koller T, Goedhart M and Wessels D. agree on the following formula (Luehrman T. A. 1997; Damodaran A. 2002; Koller, T., Goedhart, M. & Wessels, D. 2017):
Weighted Average Cost of Capital (WACC)
Usually the WACC is one of the elements that drives more attention in a company valuation, since small changes in this value have huge impacts on the value of the company. The WACC comprises simultaneously the risk of CF, the present value of them and the risk premium associated with them. As its name refers, the WACC weighs the
cost of equity and the cost of debt depending on the firm’s capital structure. It can be represented by the following formula:
WACC = D
V Rd (1 – T) + E V Re
When evaluating a company using WACC, it is important that the analyst considers the future debt ratio and the company assets risk structure, since both of them will have a major impact on the WACC components.
B. Multiples Valuation
The multiples valuation is a way of evaluation a company using the prices of similar companies in the market. In this way, an analyst looks at similar companies and uses some of their main indicator and how the market prices them to access a company value. Multiples Valuation is one of the simplest ways for a company, since it does not imply many calculations or projections. However, it is very important than analysts carefully choose the following variables correctly (Damodaran A. 2002):
• Find peers companies that are really comparable to the one that is under the valuation – e.g., similar industry, market, cash flows, risks and size
• Correct assessment of the market price of each variable in the market • Adjust the results obtained for some differences among the peer companies
– e.g., exclude income from non-recurring activities or different business Most of the literature agrees that this valuation is useful, however some researches, such as Fernandez, argue that this valuation should only be used as a supporting method, since it lacks in company specific information. Also, Koller T, Goedhart M and Wessels D. agree that this method should be used as a sanity check for the DCF models and a tool to bring industry insights to the valuation preformed (Damodaran A. 2002; Fernandez P. 2004; Koller T, Goedhart M and Wessels D. 2017).
Damodaran and most of the researchers agree that, although there are several multiples and some adhere better to some industry and company specific contexts, the most used valuation multiples used in the market are Price to Earnings Ratios and the EV multiples, especially the EV-to-EBITDA ratio. These two multiples are complementary and powerful tools in evaluating a company, since on one hand, the Price-to-Earnings ratio gives a sense of what is the price of one unit of cash/earnings generated, but
considers and is affected by the capital structure of the company and one-off operations. On the other hand, EV-to-EBITDA multiple is less volatile to the capital structure of the company and takes only into account the cash flow generated by the operation itself.
Regarding peer companies, there are some different assessments of what comprises the classification of a company as a peer company. Damodaran refers that peer companies are the ones with similar cash flow, risk and growth profiles, while Foushee, Koller and Mehta argue that peer companies are the ones that act in the same market and are influenced by the same macroeconomic forces (Damodaran A. 2002; Foushee, S., Koller, T. and Mehta, A. 2012).
All in all, most of the literature agrees that multiples valuation is a useful tool in accessing the value of a company, although it should only be used as a supporting method, since sometimes the results will be helpful in determining the value of the company but other times they can be totally worthless.
We will use this method on our valuation, since it is a good complementary method to make a sanity check to the bottom up valuation (using the DDM). It is also widely used by analysts, since it does not rely in too many assumptions and it is relatively easy to apply.
C. Economic Value Added (EVA)
The economic value-added approach is an assessment of the value that is generated by an investment. The EVA is computed as the product of the return in excess of the cost of capital and the capital invested. It can be represented through the formula:
EVA = (Return on Capital Invested – Cost of Capital) (Capital Invested) or
EVA= Operating income after tax – (Cost of Capital) (Capital Invested)
Damodaran defends that the EVA can be also applied using a discount factor to consider the time value of money, using the following formula (Damodaran A. 2002):
Value = ∑ 𝐸𝑉𝐴𝑡
Although it is a standalone model, some researchers, such as Young M, Sullivan P, Nokhasteh A and Holt W, argue that the EVA is nothing more than a rearrangement of a “normal” DCF model (Young, M., Sullivan, P., Nokhasteh, A. and Holt, W. 1999).
D. Options Pricing
The option pricing model is mostly used on contingent claims valuations. In some circumstances, assets values are contingent to a future event and the value of it will depend on the occurrence of that event. An option consists on a right that an investor has to claim a specific security / asset at a pre-fixed price. The value of the option is usually the difference between the expected value of the underlying asset and the option exercise price. In this way, Luerhman states that a business that has an option, such as a growth opportunity, should be priced accordingly (Damodaran A. 2002, Luerhman 1997).
The most well-known option pricing models are the Black & Scholes and the binomial trees, in which a series of variables, such as volatility, are taken into account when pricing an option.
Although these models are widely used, like the Multiples Valuation method, the option pricing model should not be used as the only method to evaluate a business, but as a complement to other methods, since it is difficult to correctly apply to the companies being valued.
E. Asset Based Approach
This approach consists is assessing a company value using its net assets values or the market fair value, subtracting the outstanding debt. In this valuation method, there is some need to interpret which assets and liabilities should be considered and what the fair value of each one is. This method is more adequate in valuating companies in which most of their assets and liabilities are mark-to-market on their books vs. pure accounting value. It is especially useful in bank valuations, since most of the book, such as loans, deposits and financial instruments, should be at the fair value and helps testing the bank balance sheet in the valuation moment.
F. DuPont Method
This approach consists in decomposing the Return on Equity (RoE) or Return on Assets (RoA) into the main P&L components that contribute the overall profitability of a company. This breakdown allows the analysis of the evolution and comparison between
the main drivers of the profitability changes or differences. In order to evaluate the potential of a business, this RoE can be compared to the overall cost of capital, especially if the decision is between buying or not a business (i.e., if the business pays it cost of capital)
III. Valuation of the company
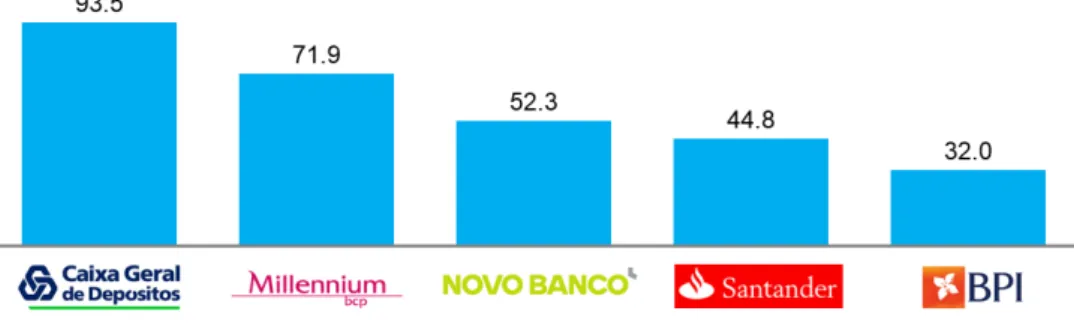
A. Company overviewMillennium BCP is the largest privately-owned bank in Portugal and the second largest in the whole Portuguese Banking system. The Bank is mainly focused on retail banking in Portugal, but it also has international operations mainly in Poland and Mozambique. In 2017, Millennium had €72billion in Assets, €2.2billion in Net interest income and €290 million in net profit. The bank employs 15,809 people and has 1,136 branches, of which 7,189 and 578 are in Portugal, respectively.
Figure 1: Top Portuguese banks by assets (€ Bn)
B. European and Portuguese Banking Sector Crises and Transformation
The European banking system suffered considerably from the subprime crises, in which several European banks were bailed out, including a Portuguese Bank. After the crisis, the financial system in Europe has been recovering in different speeds, where nowadays northern European countries have already recovered historical profitability levels, while south countries, such as Portugal, Spain, Italy and Greece are still struggling to recover profitable levels that allow them to pay the cost of capital.
In 2011, the Portuguese government asked for a €78bn bail-out of which €12bn earmarked for banking sector recapitalization. At that time, Portuguese banks were required to maintain capital ratios above 10%. The government support provided to the banking system to ensure solvency was mostly in the forms of capital increases or CoCoS (Contingent Convertibles). During 2012 and 2013, the major Portuguese banks asked for support. For example, Caixa Geral de Depósitos (CGD) asked for €1.65bn, of which €0.9bn were in the form of CoCos and €0.75bn in capital increase. Millennium BCP asked for €3.0bn in CoCos, Banco Português de Investimento (BPI) asked for €1.5bn in CoCos and Banif asked for €1.1bn, of which €0.45bn in CoCos and €0.7bn in capital increase.
After these capital injections in the system, in 2014 the third Portuguese bank by the time – Banco Espirito Santo (BES) – entered in resolution and had to split its assets between Novo Banco and BES Bad Bank. This resolution implied a capital injection of €4.9 bn by the resolution fund in Novo Banco, in order to restore solvency and capital levels.
In 2015 the Portuguese banking system continued being highly turbulent. Bankinter acquired the commercial and retail business of Barclays Portugal for €0.1bn and in the same year, the Portuguese bank Banif was bailed out for €2.3 Bn, out of which 1.8bn was funded by the state and €0.5bn from the Portuguese resolution fund. In the end of the year, the Portuguese postal company CTT announced that it was going to create the postal bank Banco CTT, aiming to leverage on the current network footprint.
The year of 2016 continued to be a troubled one for the banking sector. The 6th retail
bank, Montepio, had a capital increase of €0.3bn and Caixa Geral de Depositos, the biggest Portuguese bank, started its billionaire recapitalization, that only finished in 2017 and combined an injection of €2.5bn in cash, €0.9bn in conversion from CoCos that were requested in 2012, €0.5bn in addition subordinated debt and €0.5bn with restructuring of the financial stake that the Portuguese state had in it.
Last year (2017), Caixa Bank increased its stake to 85% in Banco Português de Investimento for €0.65bn, which meant a takeover from another Spanish bank in one of the major Portuguese players. Also in 2017, the United States Private Equity Fund, Lone Star Fund, acquired a 75% stake in Novo Banco from the resolution fund. It is also important to refer, that in 2017, Millennium BCP also saw a capital increase of about €1.3 Bn with the entrance of one of the current major shareholders – Fosun.
C. Recent Portuguese banking recovery
Portuguese economy started to show early signs of recovery in the year of 2016: the GDP started to grow (1.2% in 2016 and is expected to grow more in the period of in 2017-2022), unemployment decreased (less than 10% in 2017) and the cost of government debt started to be at more sustainable levels (around 3%). The overall system was emerging from a challenging period (2011-2016) with billions of accumulated losses, capital injections and negative P&Ls, mostly driven by:
Decrease in net interest margin (NII) triggered by decrease in money market interest rates, with cost of funding reflecting a sovereign risk premium (in period in which Euribor were at negative levels) and balance sheet deleverage (reduction in total assets in the major banks of the system).
Decrease in Commissions, both in contribution to the income statement and as a percentage of business volumes (BV), driven by the referred balance sheet deleverage and increase in commercial leakage (e.g., discretionary commissions exemptions to clients).
Reduction in the operating costs, both staff costs and administrative costs, driven by a reduction in the number of branches and employees. However, this reduction was not sufficient to compensate the erosion of the banking income.
High impairments and provisions during the 2011 and 2016 period, driven by real estate foreclosed assets and increase in the NPL ratio.
Regarding capital levels, the major banks accommodated the increase in regulatory requirements mainly recurring to capital injections (mainly from foreign investment, such as Private Equity funds).
Concerning the future, to reinstate profitability to sustainable levels (considered usually in the overall banking system a RoE above 10%), Portuguese banks need to adapt their business model by revitalizing the commercial power (increase both volume and price), continue the operational platform adjustments (reduce branches, employees and other costs, using alternative platforms, such as digital) and be more prudent in terms of risk management practices.
D. Millennium BCP current performance and projections
After subprime crisis and showing the first signs of recovery, Portuguese banks are starting to restore the profitability by: restoring assets profitability and improving their overall value proposition, reduce liabilities costs, increasing the operational efficiency, reducing risk exposures and costs, among others.
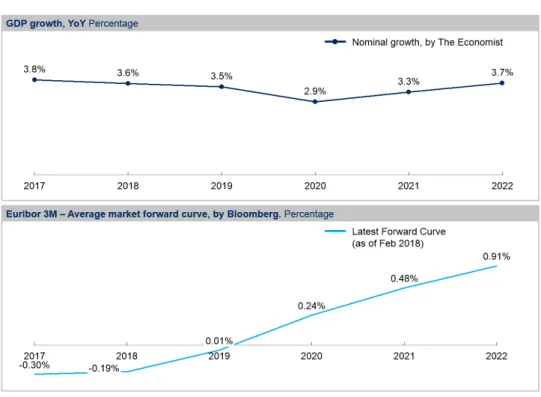
D1. Macroeconomic conditions
After the intervention of the IMF, political instability and economic recession in Portugal in the past decade, in 2016 the country started to show signs of recovery and the
GDP started to increase. The overall projection on both The Economist and other sources, such as Oxford Economics, expects that the nominal GDP will grow above 3% in the following years, leading to a positive outlook regarding banking business volumes, both through the assets side and the liabilities side.
Another important economic indicator, the money market rate is expected to increase and since it is one of the variables that have higher impact in the P&L of a retail bank, it will benefit the overall system as it will be explained later. Regarding this indicator, in the last years the money market rate in Europe, Euribor, has reached historical minimums, decreasing to figures below 0% in all maturities, which contributed along with tighten regulatory frameworks and high default rate to reduced banking profitability.
The most widely used money market rate used in banking for projections is the Euribor 3M, which has a high correlation with the increase net interest income of a bank, due to different elasticities of assets and liabilities in changes of this reference rate, since most of the assets are directly attached to this reference rate and liabilities absorb only partly this effect and much later. An example of this reduced elasticity of some liabilities instruments to interest rates is that deposits can even have negative spreads when compared to the reference rate.
D2. Assets
Previously to the global and Portuguese crisis, banks have increased their loan books immensely, specially leveraging in high risk sectors such as real estate promotion and construction, that are highly dependent on economy health and have lower collateralization. After the financial crisis, the loan book has decreased due to Portuguese internal and external factors. On one hand, unemployment increased and the corporate investments and confidence decreased, and on the other hand, banks became more pressured by European and local regulators to increase their capital ratios and reduce exposures to higher risk credits. In the future, the expected growth in the GDP, the reduction of unemployment, the overall improvement in economic conditions and the expected stabilization on the regulatory framework will probably lead to an increase in the investments and subsequently an increase on the credit loan book.
Figure 3: Portuguese total loan book volumes (€ Bn)
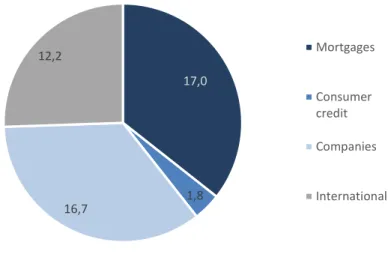
Regarding BCP’s loan book, I divided it into national and international loan book to be able to apply different growth rate within each location. Regarding the national loan book, it was divided also into mortgages, other individuals (mainly consumer finance) and corporate to have a higher granularity and be able to apply different growth rates.
In this case, mortgages were projected using the GDP, since it is the best forecasted variable to imply the buying housing intentions. Consumer finance was projected using the private consumption growth rates as a proxy. Corporate was projected using the gross fixed investment, since part of that investment would need banking finance. Regarding the international business, since about 80% comes from Poland and the rest is spread through Mozambique and other countries, it was used Poland GDP growth rate as a proxy.
Figure 5: Projected loan book volumes (€ Mn)
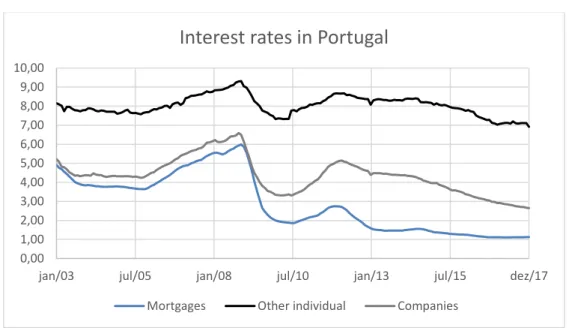
In terms of loans interest margin, the decrease on the Euribor, in which most of the medium and long-term loans are attached to, led to an overall decrease in the interest rates. The reduced spreads that were contracted in high Euribor years previous crisis (for example 2006 with Euribor 3M of 3%) are now summed up with negative Euribor, leading to very low interest rates. The banks are now suffering one of the downsides of the effect of the mismatch maturities of assets and liabilities, since banks need to maintain
17,0 1,8 16,7 12,2 Mortgages Consumer credit Companies International
liabilities that are of shorter term. In the future, with higher money market rates in perspective, banks should benefit from the reverse effect. Banks are now contracting long term loans that will benefit from the expected increase in Euribor 3M.
Figure 6: Portuguese loan interest rates evolution per type of credit (€ Bn)
Regarding BCP’s interest rates projection, since most of the banking products are either short term and absorb directly the Euribor increase or directly linked to the Euribor (Fixed spread + Euribor), the expected average interest rate was projected using the average Euribor increase per year. The interest rates in segment were estimated using current Portuguese market outstanding interest rates to be able to incorporate some of the effect in the change in mix that would result from different growth changes in each segment.
Figure 7: Projected loan book interest rate (€ Bn)
Additionally, the deterioration of the credit quality and subsequent increase Non-Performing Loans (NPL) in the beginning of the decade, both decreased the profitability of the loan book and increased the costs of risks and capital requirements. NPLs as any Non-performing exposure does not generate any revenue, but in the case of banks are
0,00 1,00 2,00 3,00 4,00 5,00 6,00 7,00 8,00 9,00 10,00
jan/03 jul/05 jan/08 jul/10 jan/13 jul/15 dez/17
Interest rates in Portugal
specifically negative because it implies costs of funding, costs of risks through impairments and costs of regulatory capital (that are usually higher in non-performing exposures due to European regulation – Basel). In the future, the improvement in the economic conditions and the reduction in unemployment (usually referred as the major factor correlated with the default rates) will probably reduce the NPL ratio to historical levels and increase the proportion of performing and revenues generation loans.
Regarding Millennium’s financial assets, such as held for trade, available for sale and other margin generation assets, they have been increasing in the last years due to a double effect. First, the reduction in the loans book led to a need to invest in deposits and funding captured in other productive assets (vs. credits). Secondly, new regulatory ratios requirements, specially the Liquidity Coverage Ratio (LCR), demand that banks should have enough high liquidity assets, such as government bonds, to face possible deposits run out and consequently a liquidity crisis. Again, these assets were also highly affected by low interest rates, since usually these assets are securities that have a specific rate or an attached coupon that is highly correlated with the reference rate – Euribor, more than to the real economic situation of the country.
Figure 8: Projected financial assets volumes and interest rates (€ Bn)
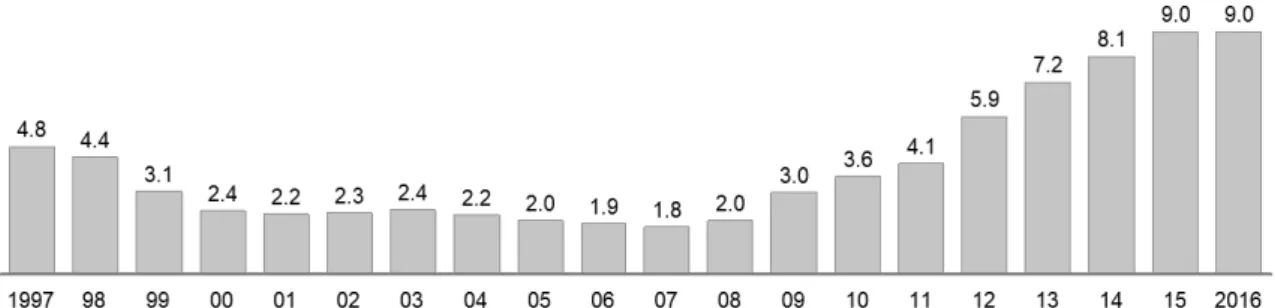
Regarding NPLs, the current Portuguese market has been experiencing extremely high levels comparing to pre-crisis levels. Before the crisis the NPLs (>90 days) was ranging from 2% to 4% of the loans portfolio. After the crises, the levels have increased, in line with the worse economic conditions, reaching 9% in 2016. After this maximum level, it is expected that in the next years banks will reduce the NPL by both reduction in new entries due to better economic conditions and sales of portfolios and recovery of current NPLs.
Regarding Millennium BCP’s NPLs (>90 days), the ratio was 10.4% in 2016 and started to reduce in 2017 to 8.9%, because of the above-mentioned reasons, In the next years the ratio is projected decreasing in the same retheme of this past year (less 1.5% per year), stabilizing at the historical average of 2.6% in 2022 as should in the figure bellow.
Figure 10: Projected Millennium BCP NPLs (> 90 days) ratio
D3. Liabilities
After a population after the bail out of Banco Espírito Santo, partially also because period of decreasing deposits from 2013 until 2016, partially influenced by the mistrust of the Portuguese of the economic recession, in 2017 the outstanding deposits started to increase and the previous liquidity dispute between banks that led to higher interest rates, now has changed to an excess of liquidity context, in which banks offer very reduced interest rates in order to maintain clients and bias them towards term deposits (term deposits are preferred in terms of contribution to LCR and NSFR regulatory ratios).
Regarding BCP’s deposits, I divided it into sight and term deposits, since the first ones are mostly interest rate free (some sight deposits are remunerated, but historically it represents a very small part of the portfolio, hence neglectable) and the second have interest rates. Here, there was no a clear division between sight and term deposits in each country, so the growth rate applied to the overall deposits was a weighted average of the Portuguese and the Polish GDP growth rate.
Figure 12: Projected deposits volumes (€ Bn)
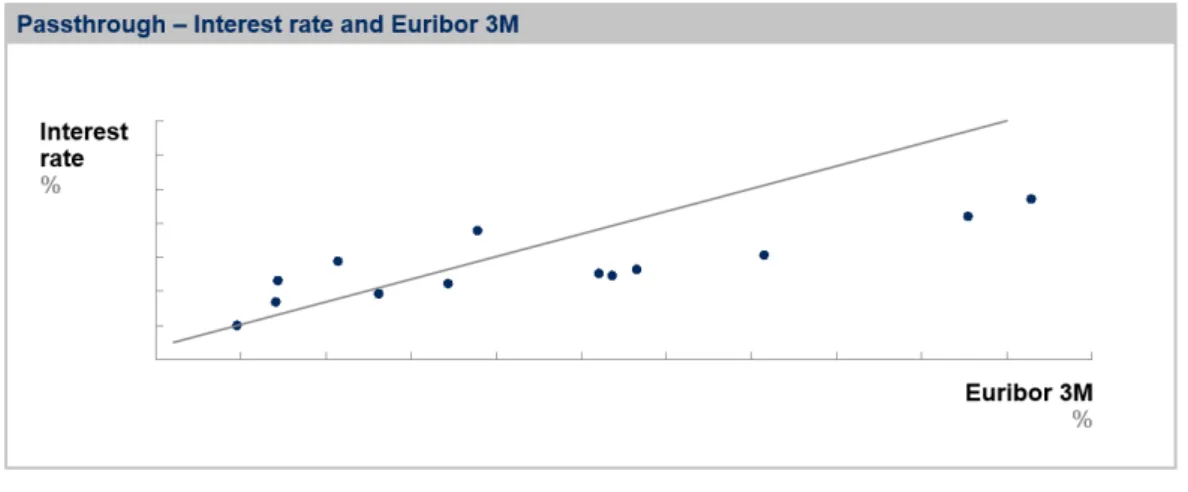
In terms of deposits costs, historically changes in the Euribor 3M are accompanied by lower magnitude changes in the same direction. After running qaregression between the Interest rates on outstanding deposits from 2003 until 2016 and the Euribor 3M of those same years, one gets a reasonably strong R2 of 68% and a passthrough of 35%. This
means that, whenever the Euribor increases (or decreases) 100 bps, deposits interest rates are expected to increase (or decrease) 35 bps.
Figure 13: Passthrough – Correlation between deposits interest rates and Euribor 3M
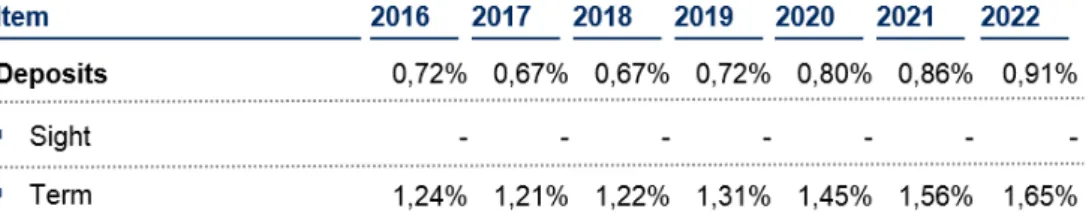
Regarding our deposits interest rate projection, applying the passthrough represented above into the current deposits portfolio cost, we got the following cost of deposits:
Regarding Millennium financial liabilities, such as held for trade, available for sale and subordinated debt, they have been decreasing in the last years due to its high cost (vs. deposits). Since the liquidity doesn’t seem to be an issue anymore in the Portuguese Banking System, banks started to reduce the amount of expensive liabilities in their balance sheet and substitute them by deposits. Differently from the financial assets, since these liabilities are both affected by ratings and interest rates (not only), the cost of these financial liabilities did not decrease because both Portugal and Millennium have experienced ratings decreases since the beginning of the financial crisis. However, with the stabilization of the economic situation in Portugal and the improvement of the financial situation of the bank, these liabilities are likely to be more influenced by market interest rates and less influenced by external macroeconomic factors.
Figure 15: Projected financial liabilities volumes (€ Bn)
Additionally, it is important to refer that in the year of 2017, the improvement in the financial situation combined with the capital increase allowed Millennium BCP to repay the expensive CoCos and therefore reduce the overall cost of funding (in the last year CoCos were paying around ~10% in interest rates).
All in all, the net interest margin is expected to increase mainly because i) interest rates are expected to increase in the next years, and since the deposits passthrough (~35%) is lower than the credits one (~100%), when Euribor increases the Net Interest Income increases and vice-versa, ii) reduction in non-performing exposures, iii) reduction in expensive liabilities, such as CoCos.
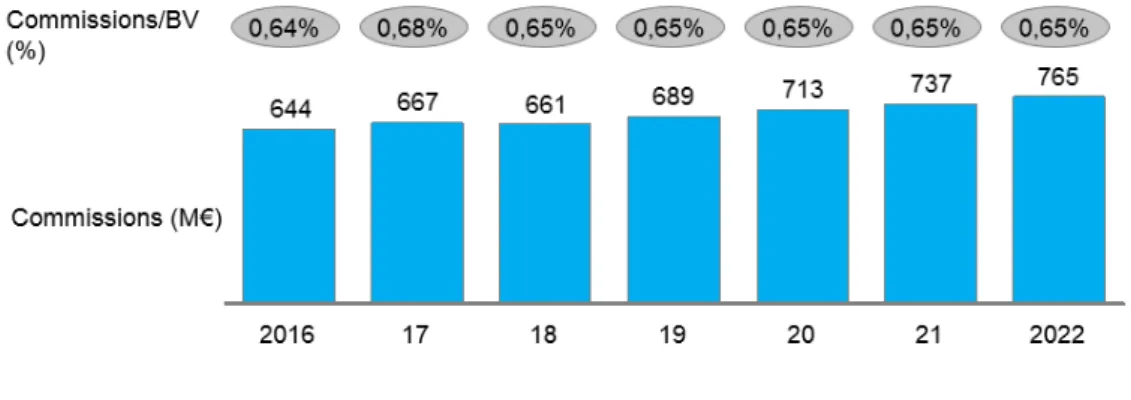
D4. Net fees and commissions
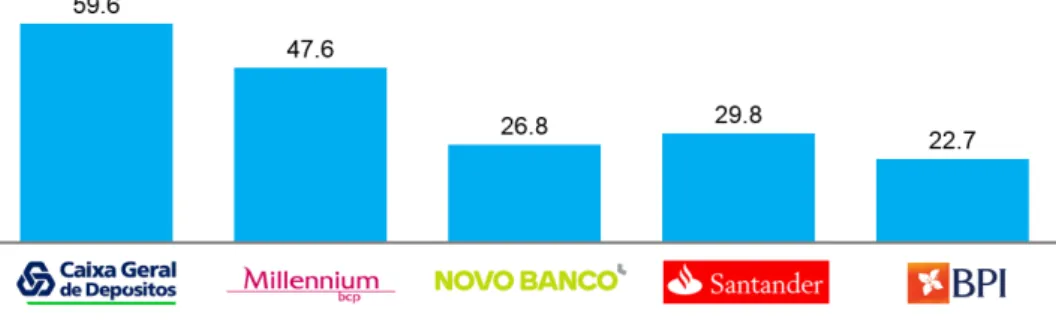
Currently net fees and commissions over business volumes (BV) of Millennium BCP are the highest among the Top 5 Banks in Portugal. The net fees and commissions
over business volumes is the most widely used metric in the industry, since it includes the business volumes that contribute the majority of the commissions received – credit as the credit related commissions and deposits as a proxy of current account commissions and other commissions to individuals that have involvement with the bank. In 2017, Millennium Commissions/BV was 0.68%, compared with 0.64% of BPI, 0.56%of Novo Banco, 0.58% of Santander Totta and 0.35% of CGD1. However, it is more likely that the
market will converge to BCP figures than the other way around due to reduction on commercial leakage and increase in overall commissions to clients.
The Millennium BCP commissions where projected using a constant % of business volume equal to the average of the last three years, to avoid contamination of one off operations, which applies for both national and international operation.
Figure 16: Projected net fees and commissions (€ Mn and % of BV)
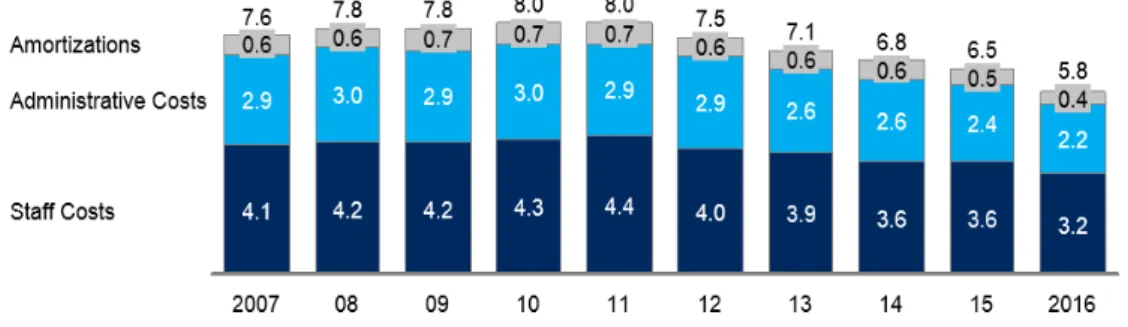
D5. Operational Costs
The operational costs in the Portuguese banking system has been a hot topic. Since the beginning of the banking financial crisis, banks have been trying to reduce their operational costs in order to partially compensate the decrease in the net interest income. In this way, banks have been trying to optimize the network adapting to and shaping it to market needs.
Figure 17: Portuguese Banking System evolution in Operational Costs (€ Bn)
To achieve this objective, banks have been continuously decreasing on the two main drivers of the operational costs: Full Time Employees (FTEs) and Branches.
Figure 18: Portuguese Banking System evolution in FTEs and Branches (‘000)
Banks have been continuously identifying costs savings opportunities in procurement / lean processes and general or administrative expenses. The implementation plan for service levels delivery with quality at a lower cost is in the top of mind of the major Portuguese banks and the digitalization trend through web processes and operations automation is seen as the future of the banking sector.
Regarding Millennium BCP costs, it has been reducing year over year throughout the operational restructure that have been taken in practice in the 2016-2018 strategic plan. In the end of 2017, BCP achieved a cost to income of 46%, which is relatively low, especially in a context of very low net interest incomes. From now on, the operational costs are projected as a % of business volumes, that will increase absorbing partially the increase in costs when more business is done (only partially because the automation will probably decrease the opex costs per BV) and partially the business as usual increase in wages, which applies for both national and international operation.
Figure 19: Millennium BCP projected Operational Costs (€Mn)2
D6. Risk Costs
The risks costs have been one of the main hurdles of banks profitability in the last few years. Before the financial crises, the upward trend on the economy reduced the default rate and consequently reduced cost of risks. After the subprime crisis, banking corporate clients, specially concentrated in the construction and real estate sector, started to default due to a huge decrease on the housing value, leading to historical high impairment costs.
Figure 20: Credit costs of risk of the top 5 main banks in Portugal (€Mn; %)
Nowadays, banks are adjusting their risk appetite and adapting the risk models to different business segments. Moreover, regulatory directives on credit assessment and capital reserves for each type of credit also adjusted the banks appetite, which have biased them towards less risky operations. This overall trend led to a recovery on the costs of risk in most of the banks, although it is not apparent in 2016, due to abnormal high impairments in CGD due to its recapitalization and subsequent adjustment in the coverage ratio of its credits.
From now on, the cost of risk is expected to stabilize and return to historical averages of 0.6% (pre-crises average costs of risk of 2007 – 2010). Regarding BCP, its high weight in Mortgages – typically have lower costs of risks since are credits highly collateralized – will allow to recover these levels progressively. In the projection, it was
assumed that Millennium will achieve this levels by 2020 and then on maintain this level until 2022, which applies for both national and international operation.
Figure 21: Millennium credit impairments and cost of risk projections (€Mn; %)
Regarding the other impairments, since most of the balance sheet “cleaning” was already done, they are projected to be maintained constant throughout the years at current levels.
In summary, the improvement in the macroeconomic conditions along with a more efficient business model will probably lead to an improvement on the overall banking profitability in the next years, increasing the overall return on equity of Potuguese banks.
D7. Overall results
The Profit and Loss of Millennium BCP according to the projections made above will reach a Net profit (after tax) of near €1 Bn in 2022, which represents a RoE of about 9%. The main drivers of this increase are an increase of Banking Product of 1Bn€ and a reduction of about €0.3 BN in cost of risk.
This changes in the P&l would mean a net interest margin of 1.7% in 2020 and 2.0% in 2022, a decrease of the total cost-to-income ratio from 43% in 2017 to 39% in 2020 and 35% in 2022, majorly due to an increase in the income, more than changes in operational costs and an after-tax RoE of 8.5% in 2020 and 9.5% in 2022.
The profitability of the bank can also be analysed using the DuPont method, that will give a more comprehensive evaluation on the main profitability growth drivers. After analysing the table below, we can confirm that the main driver of growth in the RoE is the expected decrease in impairments, contributing with 7,3% pre-tax revenue increase. All the figures presented in the table below are a percentage of Assets / Equity.
Figure 24: DuPont analysis – Millennium BCP RoE decomposition
In terms of Balance Sheet, the assets are expected to grow €5 to 6 Bn until 2020, majorly due to a recovery in the credit to customers. There are no major changes in the other assets, which would mean that the loans will gain more weight in the overall assets book. The deposits are also projected to grow €6 Bn, maintaining the overall Loan to Deposits ratio below 100% (vs. historically above 100%).
Figure 26: Millennium BCP main Balance ratios projections (%)
Regarding regulatory ratios, we focused on the active constrain of most of the banks (and also Millennium’s one) that is CET1, since capital shortage other ratios could be more easily surpassed by issuing tier 2 / subordinated debt. To project this ratio, we used the current fully loaded ratio, that will be the active constrain in the future (phasing in almost done), and projected CET1, by adding the returns of each year to the CET1, since all the profit of the bank is eligible to CET1 and projected RWA using current Risk Weights, since it is not expected that the balance sheet structure of the bank will change a lot in the near future.
Figure 27: Millennium BCP CET 1 projections (%)
E. Millennium BCP valuation scenarios
Regarding valuation, we applied three methods to value Millennium BCP: i) Dividend Discount Model; ii) Multiples valuation
E1. Dividend Discount Model (DDM)
As discussed before, the Dividend Discount Model has the following formula: Value per share = ∑ 𝐷𝑃𝑆 𝑡
(1+𝑟𝑒)𝑡
In order to access the value of BCP using this methodology, one should 1) Access the dividends paid in the future each year and 2) Discount those dividends to the present value
After the projections done previously, the two only missing pieces were the dividend payout ratio and the Shareholders attributable income. On the first one, we assumed that the payout ratio for valuations purpose were 100% (on the projections we used 0%), although the CET1 ratio that is currently projected using 100% retained earnings, since in both scenarios (dividend payout ratio of 0% or 100%) the ratio would never fall below the regulatory minimum (8.8125% in 2018). On the second, since we are not projecting changes in the shareholders structure and most of the increase will be in the domestic operations, we assumed that the non-controlling interests will be maintained at current levels (as it occurred in the past). For the growth rate of BCP, we assumed the average of the nominal GDP growth of Portugal and Poland from 2018 to 20223, weighted
by credits.
Figure 28: Millennium BCP dividends projection (€)
2) Discount Dividends to present value
To get the cost of equity that the bank should have, we used the already presented CAPM formula. On the Risk-Free component, we used current German Generic Government Bonds 10Yr of 0.65%, since German debt is assumed to be the most secure debt in the European Union. For the Beta, we used the leveraged Beta of Major Banks in Western Europe of Damodaran of 1.60, that actually includes Millennium BCP in its composition. In banks valuation we should skip the levered betas step for two reasons: i) banks have similar debt structures and ii) debt is hard to measure in banks. Regarding the Market Risk Premium, we used Portuguese Market Risk premium of 7.96%, that is present in the Damodaran premium per country. The final cost of equity was 13.38%. Applying the DDM formula we got to a value of €0.40 per share.
Figure 29: Fair value per share using DDM (€)
E2. Multiples Valuation
To apply the correct multiples to Millennium we need to select BCP’s peer group. Since most of the retail banks similar in terms of business and industry, we decided to use the Iberian banks as a peer group. We used both Portuguese and Spanish banks since the countries are in the same economic cycle and the level of banking sophistication and way of doing business in both countries are comparable.
Figure 30: Iberian banks multiples4
We used both the Price to Book and Price to Earnings multiple. The price to book since the Balance Sheet of the bank should be marked to market, so in theory the Price to Book of all the banks should be 1.0. However, since different banks have different profitability ratios, we adjusted the P/B ratio to each of the RoE levels and regressed all the banks. The overall regression had a R2 of 93%.
Figure 31: Price to Book levels per RoE of each peer bank
Applying the regression in Millennium BCP we got a P/B multiple of 1.19x. Then, using the Equity value of €7.9 Bn projected to 2020, the multiple of 1.19x and the discount rate used previously we get to a present value of the equity of €6.4 Bn, which mean a value per share of €0.427.
Figure 32: Fair value per share using Price to Book (€)
We also applied the Price to Earnings multiple because of the reasons mentioned in the literature review. Appling the simple average Price to Earnings ratio of the Iberian banks leads to an overall multiple of 13.7x the earnings and the price per share of €0.412
Figure 33: Fair value per share using Price to Earnings (€)5
5 Earnings referring to the shareholders attributable, which is composed of the total earnings minus
the non-controlling earnings that are projected to maintain stable at € 103Mn, since they have been stable in the past 3 years
Combining both valuations, we get to a fair price range of €0.40-0.43 for Millennium BCP.
IV. Differences between values and methods of the investment bank
The main objective of this chapter is to compare the results obtained and the methodology used. In order to perform this sanity check I used the report of a leading Investment Bank: JP Morgan. This report was the most updated reports available – from 14th February – by the time this report was done.
JP Morgan used an explicit period of 3 years (2018, 2019 and 2020). I performed projections until 2022, but in the valuation, I used only the figures up to 2020 to be sure that the reports are purely comparable, and since there was no major change in the projection between 2020 and 2022, that period can be neglected and use directly a terminal value.
JP Morgan used the sum of the parts valuation, using historical Price to Earnings ratios and dividing the earning per business unit. I also used multiples valuation, however I used current peers’ P/E multiples and projected the loans of each business unit separately, summing up in the end the total bank. From the point of view of business projections, it seems that both me and the investment bank used the same strategy by dividing Portuguese and international operations. Although we applied different valuation methodologies, we end up in a similar result.
1) Dissertation Projections vs. Investment Bank Projections
Both the master thesis and JP Morgan have consolidated projection. If we analyze them in detail we get that the net profit is similar, however the master thesis net interest income is growing more aggressively than JP Morgan’s one and the impairments of JP Morgan are lower than the master thesis. The first difference is probably mainly due to different projections in the money market interest rate effects and Euribor curves, that drove JP Morgan to a more conservative growth. Secondly, JP Morgan’s project that other impairments go down to 0, which means that there won’t be any losses in the real estate repossessed assets sales or other provisions, which seems unlikely.
Figure 34: P&L main components comparison between the master dissertation and JP Morgan
2) Valuation Methods
In the master thesis, it is applied both the DDM and the Multiples Valuation, using both P/B and P/E. On JP Morgan report, it is only applied the Price to Earnings over the projection made. Those different methods, end up in very similar results and if I apply the same overall P/E ratio to the year of 2019, as JP Morgan did, I will end up with a target price that is close to them.
JP Morgan method have the advantage of applying different multiples to different locations, reflecting the quality of the earnings of each country of origin and uses historical P/E multiples. In the master thesis, we try to have a more independent from specific Millennium BCP multiples and we apply current peers market multiples adjusted to the profitability to be able in part to reflect also the quality of the earnings generated by each bank (specifically on price to book). Moreover, we apply also a DDM to have a different valuation approach and be sure that we get a value that is in the same range of the multiples valuation.
Figure 35: Comparison between Value per Share
In conclusion, although the valuation methods are partially different, since both the masters’ thesis and the investment bank reach a similar net profit, the valuation of the
V. Conclusion
In this master’s thesis, my objective was to apply the knowledge acquired until now, both during the master and other professional activities to have an equity valuation that most approximates to the real life of an equity research piece. In this context, I started by giving an overview of the state of art of equity valuation in the literature and focused my efforts in having a complete and holistic view on 2 main evaluation methods: i) Discounted Cash Flow / Dividends Method and ii) Multiples / Relative valuation. To perform this task in the most accurate way possible, I got into the understanding of the dynamics of the banking industry, especially in Portugal and projected BCP accordingly, using the assumptions that seemed to me the most accurate and real. Moreover, since in an equity valuation report, analysts do not have access to internal company information, the task gets even more difficult, as one should use all the information publicly available to get their projection as accurate as possible.
Regarding Millennium BCP, it has been recovering from the past financial crises that affected the entire financial system in Portugal and now is above some of their peers in terms of both profitability and capital robustness. Furthermore, the Portuguese economic outlook seems positive and money market rates are estimated to go up, making the future of the bank promising.
According to the valuations preformed in this dissertation, the share price of Millennium should go up to €0.40 – 0.43, which is above the current value of €0.29, and in line with the expectations of some major investment banks, such as JP Morgan.
Last of all, I believe that Millennium and the overall Portuguese banking system is going to improve their profitability, surpassing the past crises that affected both the industry and the overall country stability.
References
Damodaran, Aswath (2002) Research and Development Expenses: Implications for Profitability Measurement and Valuation
Damodaran, Aswath (2006) Valuation Approaches and Metrics: A Survey of the Theory and Evidence, Stern School of Business
Damodaran, Aswath (2009) “Valuing Financial Service Firms”
Deev O. (2011) Methods of Bank Valuation: A critical overview Masaryk University, Faculty of Economics and Administration, Department of Finance
Farrell, J. L. (1985) The Dividend Discount Model: A Primer Fernández, P. (2004) 80 common errors in company valuation
Foerster, S. R. & Sapp, S. G. (2005) Valuation of financial versus non-financial firms: a global perspective Journal of International Financial Markets, Institutions and Money Foushee, S., Mehta, A. & Koller, T. (2012) Why bad multiples happen to good
companies?’
Koller, T., Goedhart, M. & Wessels, D. (2017) Valuation – Measuring and Managing the Value of Companies, McKinsey & Company
Liu, J. & Ang, A. (2004) How to Discount Cashflows with Time-Varying Expected Returns, The Journal of Finance, Vol. LIX, No. 6
Luehrman, T., 1997, Using APV a better tool for valuing operations Luehrman, T., 1997, What’s it worth?
Young, M., Sullivan, P., Nokhasteh, A. & Holt, W. (1999) All Roads Lead to Rome. An Integrated Approach to Valuation Models, Goldman Sachs Investment Research
Websites:
Professor A. Damodaran
Millennium BCP – www.millenniumbcp.pt
Others: