Spectrophotometric determination of ofloxacin in
pharmaceuticals and human urine
K B Vinay, H D Revanasiddappa, M R. Divya and N. Rajendraprasad* Department of Studies in Chemistry, Manasagangothri, University of Mysore, India-570006
*Corresponding e-mail: [email protected]
Abstract: Three simple and sensitive spectrophotometric methods are described for the deter-mination of ofloxacin (OFX) in pharmaceuticals and in spiked human urine. First and second methods are based on the measurement of absorbance of OFX in 0.1 M HCl at 293 nm (method A) and 0.1 M NaOH at 287 nm, respectively. The third method is based on the measurement of 2:1 complex formed between OFX and iron(III) in H2SO4 medium, the complex peaking at 420 nm (method C). The optimum conditions for all the three methods are optimized. Beer ’s law is obeyed over the ranges 0.63-12.5 using method A and method B, and 10-120 µg mL-1 using method C. The apparent molar absorptivity values are calculated to be 3.5 × 10⁴, 2.76 × 10⁴ and 2.51 × 10³ L mol-1cm-1 for method A, method B and method C, respectively. The Sandell sen-sitivity, limit of detection (LOD) and limit quantification (LOQ) values are also reported. All the methods were validated in accordance with current ICH guidelines. The developed methods were employed with high degree of precision and accuracy for the estimation of total drug con-tent in commercial tablet formulations of DOX. The results obtained from human spiked urine
are satisfactory and recovery values are in the range 95.5-106.6%.
Keywords: Oloxacin; determination; spectrophotometry; pharmaceuticals; spiked urine.
Introduction
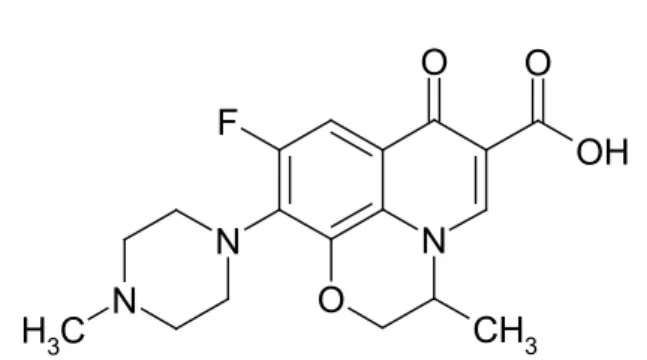
Oloxacin (OFX), a new synthetic second generation luoroquinolone antibiotic with a bro -ad spectrum of activity against gram-positive and gram-negative bacteria [1]. It is chemically kno-wn as (RS)-7-luoro-2-methyl-6-(4-methylpipera -zin-1-yl)-10-oxo-4-oxa-1-azatricyclo[7.3.1.05,13] trideca-5(13),6,8,11-tetraene-11-carboxylic acid (Fig 1).
O
N
N
N
C
H
3
F
O
OH
O
CH
3Figure 1. Chemical structure of OFX.
Several methods for the determination of OFX in pharmaceuticals or/and in urine are found
in the literature including luorimetric [2, 3], chro -matographic [4-15], electrophoretic [16-18],
injection analysis [24-29] and bioassay [30]. In some Pharmacopoeias OFX has been determined [31-33] by non-aqueous titrimetric procedure.
Spectrophotometry is characterized by its speed and simplicity, accuracy and inexpensive instrument needed, and hence it is an important alternative to other analytical methods, with clear advantages in terms of cost of analysis. Inspite of its simplicity and versatility, no UV-spectropho-tometric method has ever been reported for OFX.
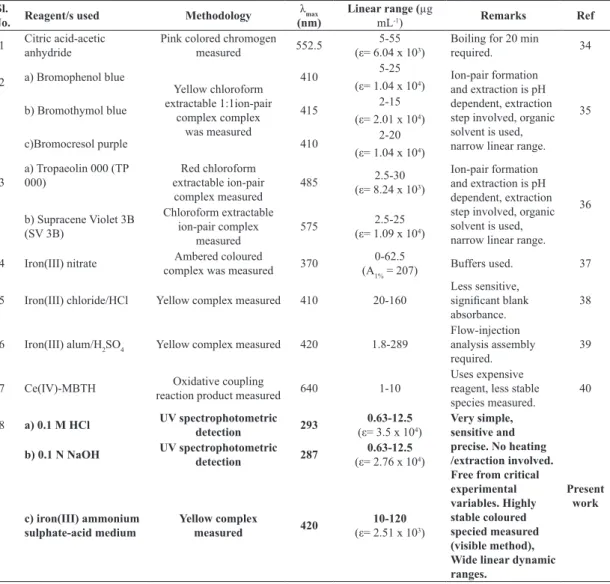
Several visible spectrophotometric methods [34-40] employing different reactions have been re-ported for the assay of OFX either alone or with some other therapeutic agents. However, the re-ported spectrophotometric methods, though sen-sitive, suffer from one or the other disadvantage such as use of boiling or extraction step, strict pH control, use of organic solvent/expensive chemi-cal and measurement of less sensitive species (Ta-ble 1).
Table 1. Comparison of the performance characteristics of the present methods with the published meth-ods.
Sl.
No. Reagent/s used Methodology
λmax (nm)
Linear range (µg
mL-1) Remarks Ref
1 Citric acid-acetic anhydride
Pink colored chromogen
measured 552.5
5-55
(ε= 6.04 x 10³)
Boiling for 20 min
required. 34
2 a) Bromophenol blue
Yellow chloroform
extractable 1:1ion-pair complex complex
was measured
410 5-25
(ε= 1.04 x 10⁴) Ion-pair formation
and extraction is pH dependent, extraction
step involved, organic solvent is used, narrow linear range.
35
b) Bromothymol blue 415 2-15
(ε= 2.01 x 10⁴)
c)Bromocresol purple 410 2-20
(ε= 1.04 x 10⁴)
3
a) Tropaeolin 000 (TP
000) extractable ion-pair Red chloroform
complex measured 485
2.5-30 (ε= 8.24 x 10³)
Ion-pair formation
and extraction is pH dependent, extraction
step involved, organic solvent is used, narrow linear range.
36
b) Supracene Violet 3B (SV 3B)
Chloroform extractable ion-pair complex
measured
575 2.5-25
(ε= 1.09 x 10⁴)
4 Iron(III) nitrate Ambered coloured
complex was measured 370 (A0-62.51% = 207) Buffers used. 37
5 Iron(III) chloride/HCl Yellow complex measured 410 20-160
Less sensitive,
signiicant blank
absorbance.
38
6 Iron(III) alum/H2SO4 Yellow complex measured 420 1.8-289
Flow-injection analysis assembly required.
39
7 Ce(IV)-MBTH Oxidative coupling
reaction product measured 640 1-10
Uses expensive
reagent, less stable species measured.
40
8 a) 0.1 M HCl UV spectrophotometric
detection 293
0.63-12.5
(ε= 3.5 x 10⁴)
Very simple, sensitive and precise. No heating /extraction involved. Free from critical experimental variables. Highly stable coloured specied measured (visible method), Wide linear dynamic ranges.
Present work b) 0.1 N NaOH UV spectrophotometric
detection 287
0.63-12.5
(ε= 2.76 x 10⁴)
c) iron(III) ammonium sulphate-acid medium
Yellow complex
measured 420
10-120
(ε= 2.51 x 10³)
ε = molar absorptivity in mol l
There is a need for methods that are sim-ple, precise, accurate and fast for the routine determination of OFX. This study describes the development and validation of two UV- and one visible-spectrophotometric methods for the deter-mination of OFX in bulk drug, tablets and in spi-ked human urine. The UV-methods are based on the measurement of the absorbance of OFX solu-tion either in 0.1 N HCl at 293 nm (method A) or in 0.1 N NaOH at 287 nm (method B). The visible spectrophotometric method (method C) is based on the measurement of yellow complex, peaking at 420 nm formed between OFX and iron(III) in H2SO4 medium. Different iron(III) salts have previously been employed for the assay of OFX in pharmaceuticals. The method using iron(III) nitrate nanohydrate [37] has not been validated as per the current ICH guidelines. Mathur et al
[38] have used iron(III) chloride in HCl medium as the chromogenic agent where the reagent blank
is found to exhibit signiicant absorbance at the
wavelength of measurement (410 nm). The me-thod using iron(III) alum [39] as a reagent, thou-gh has a wide linear dynamic range and has been applied for spiked urine sample lacks the simpli-city required for routine analysis since it requires
a low-injection analysis assembly. The proposed
method using iron(III) alum overcomes most of the limitations of the existing visible spectropho-tometric methods and has been optimized for the experimental variables involved and validated for linearity, sensitivity, selectivity, robustness and ruggedness besides intra-day and inter-day preci-sion and accuracy.
Experimental
Apparatus
Shimadzu Pharmaspec 1700 UV/Visible and Systronics model 106 digital spectrophotome-ters with 1 cm path length quartz cells were used for absorbance measurements.
Reagents and Solutions
All chemicals used were of analytical rea-gent grade. Distilled water was used throughout the investigation.
Hydrochloric acid (0.1 M): Prepared by successive dilution of concentrated acid (S.D. Fine Chem, Mumbai, India, sp. gr. 1.18) with water.
Sodium hydroxide (0.1 N): One g of pure NaOH (S.D. Fine Chem, Mumbai, India) was dis-solved in water and diluted to 250 mL.
Sulphuric acid (0.05 and 0.01 M): Concen-trated acid (S.D. Fine Chem, Mumbai, India, sp. gr. 1.84) was diluted appropriately with water to get 0.05 and 0.01 M solutions.
Iron(III) solution: A 0.5 % iron(III) alum
solution was prepared by dissolving 1.25g of pure ammonium iron(III) sulphate (S.D. Fine Chem, Mumbai, India) in 0.05 M H2SO4 and diluting to volume with the same acid in a 250 mL calibrated
lask.
Urine: Sample was collected from healthy volunteers (around 25-year-old female and 32-ye-ar-old male) and kept frozen until use after gentle thawing.
Pure OFX (Pharmaceutical grade) sample was kindly provided by
Cipla India Ltd
, In-dia, as a gift and used as received. Two brands of tablets, namely, OF 400 (J.B Chemicals andPharmaceuticals Ltd, Mumbai, India) and Zenlox
400 (Mankind Pharma Pvt Ltd, New Delhi, India) were used in the investigation.
Standard drug solutions of 25 µg mL-1 each in 0.1 M HCl and 0.1 N NaOH for method A, and method B, respectively, and 200 µg mL-1 in 0.01 M H2SO4 for method C were prepared by dissol-ving the calculated quantities of pure OFX in the
speciied solvents.
General Procedures
Method A
Varying aliquots (0.25, 0.5, 1.0, 2,0, 3.0, 4.0 and 5.0 mL of 25 µg mL-1 in 0.1 M HCl) of standard solution corresponding to 0.625-12.5 µg mL-1 OFX were taken into a series of 10 mL
volu-metric lasks, the content was diluted to the mark
Method B
Into a series of 10 mL calibration lasks,
aliquots of OFX standard solution (25 µg mL-1 in 0.1 N NaOH) equivalent to 0.63-12.5 µg mL-1 OFX were accurately measured and transferred, and volume was made up to mark with 0.1 N NaOH. After mixing the content, the absorbance of each solution was measured at 287 nm vs 0.1 N NaOH.
Method C
Different aliquots (0.0-6.0 mL) of OFX (200 µg mL-1) were accurately measured into a
series of 10 mL calibrated lasks by means of mi -croburette and the total volume was adjusted to 6.0 mL with 0.01 M H2SO4. To each lask, 2 mL
of 0.5% iron(III) alum solution was added. The
content was mixed and allowed to stand for 5 mi-nutes and then diluted to 10 mL with water. After mixing well, the absorbance was measured at 420 nm against the reagent blank.
In all three methods, calibration curves were prepared and the concentration of the unk-nown was read from the calibration graph or com-puted from the respective regression equation de-rived using absorbance-concentration data.
Procedure for tablets
Method A
Twenty tablets were weighed and pulver-sized. A quantity of tablet powder containing 10 mg of OFX was transferred into a 100 mL
volu-metric lask. The content was shaken well with
about 50 mL of 0.1 M HCl for 20 min. The mix-ture was diluted to the mark with the same acid. It
was iltered using Whatmann No 42 ilter paper. First 10 mL portion of the iltrate was discarded.
A suitable aliquot of the subsequent portion was diluted to get 25 µg mL-1 working concentration and subjected to analysis following the procedure described earlier.
Method B
Tablet powder equivalent to 10 mg of OFX
was transferred into a 100 mL volumetric lask.
The content was shaken well with about 50 mL of 0.1 N NaOH for 20 min and diluted to the mark
with 0.1 N NaOH. It was iltered using Whatmann No. 42 ilter paper. First 10 mL portion of the il -trate was discarded and subsequent portion was analyzed after dilution to 25 µg mL-1 OFX with 0.1 N NaOH.
Method C
An accurately weighed portion of the ta-blet powder, equivalent to 20 mg of the drug was shaken with about 50 mL of 0.01 M H2SO4 in a
100 mL standard lask for 20 min. The mixture
was diluted to the mark with 0.01 M H2SO4, mixed
well and then iltered through a Whatmann No.42 ilter paper. First 10 mL portion of the iltrate was
discarded and a convenient aliquot of subsequent portion was analyzed by the general procedure described for pure drug.
Procedure for spiked human urine
Method A and Method B
To prepare spiked urine sample, 2.5 mg of the pure OFX and 10 mL of urine sample were transferred into a separating funnel, mixed well till dissolution was complete. The solution was extracted with three 10 mL portion of ethyl aceta-te and the organic layer was collecaceta-ted in a beaker after drying over anhydrous sodium sulphate. The solvent was evaporated to dryness. The resulting residue was reconstituted either in 0.1 M HCl and diluted to 100 mL or with 0.1 M NaOH before diluting to 100 mL with the same solvent. Then, the analysis was performed as described under ge-neral procedure for pure drug by taking 2-3 mL of the above solution.
Method C
Five mg of the pure OFX was transferred
into a 25 mL volumetric lask and dissolved in 5
three mL portion of aliquot was then subjected to analysis as described earlier.
Results and Discussions
Spectral characteristics
OFX dissolved either in 0.1 M HCl or in 0.1 N NaOH exhibited an absorption peak at 293 nm or 287 nm (Fig 2), and the absorbance at this wavelength was found to be linearly dependent upon the concentration of drug which served as
the basis for the quantiication of OFX. In both
the cases, the corresponding blank solutions sho-wed negligible absorbance. Therefore these wave-lengths were used as analytical wavelength throu-ghout the investigation.
1
2
3
Figure 2. Absorption spectra of: 1. 8.75 µg mL-1
OFX in 0.1 N HCl; 2. 10.5 µg mL-1 OFX in 0.1 N
NaOH and 3. 0.1 N HCl and 0.1 N NaOH.
OFX is reported to react with iron(III) at pH 3.8 to form a water soluble yellow complex [41]. Preliminary spectrophotometric studies concer-ning the absorbance of iron(III) and OFX-iron(III) complex solutions in different media (methanol, acetic acid, hydrochloric acid and sulphuric acids) were carried out. The greatest difference betwe-en the absorbance of OFX-iron(III) complex and iron(III) solution at the wavelength of maximum
absorbance (420 nm) was obtained in H2SO4 me-dium. This medium was therefore used for develo-ping a spectrophotometric method for OFX.
Figure 3 shows the absorption spectra in H2SO4 medium of OFX-iron(III) complex (40 µg mL-1 OFX) (Curve 1) and the blank (Curve 2). As can be seen, iron(III) in H2SO4 medium shows low absorbance at 420 nm at which OFX doesnot absorb. This wavelength was selected for further studies.
1
2
Figure 3. Absorption spectra of: 1. OFX-iron(III) complex (40 µg mL-1 OFX) and 2. iron(III) in
sul-phuric acid.
Method optimization
Method C
Effect of iron(III) solution
The effect of iron(III) concentration on the formation of OFX-iron(III) complex was investi-gated by varying the volume of iron(III) solution,
and using a ixed amount of drug. The results re -vealed that the complex formation was unaffected
in the range of 1-4.0 mL of 0.5% iron(III) solution in a total volume of 10 mL. Hence, 2 mL of 0.5%
Effect of sulphuric acid concentration on OFX- iron(III) complex formation
The effect of H2SO4 concentration on the complex formation was studied by adding various amounts of 2 M sulphuric acid (0 - 4 mL) to a
ixed amount of the drug solution before mixing
with iron(III) solution. The results revealed that complex formation, sensitivity and stability were unaffected in the concentration range studied. Therefore, no additional sulphuric acid was used in the investigation. This study revealed that pH has no effect on the complex and its sensitivity as well as stability.
Reaction time and stability of the complex
The effect of reaction time after adding iron(III) solution and diluting to the mark with water was studied. The colour formation was com-plete in 5 min and stable upto 60 min thereafter.
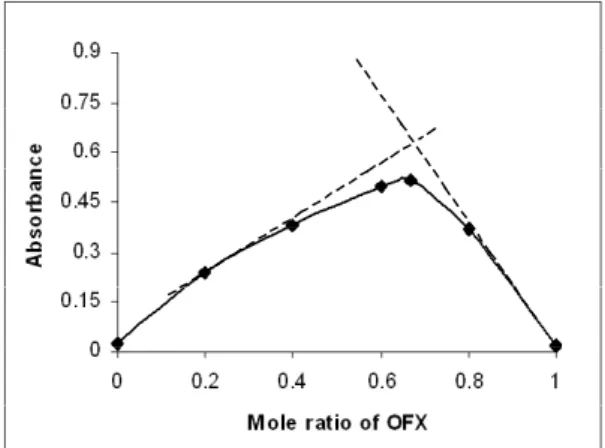
Composition of OFX -iron(III) complex
The composition of the OFX-iron(III) com-plex was studied using Job’s continuous variations method [42]. Drug and iron(III) solutions of 1.36 x 10⁻³ M each, were prepared in 0.01 M H
2SO4 and 0.05 M H2SO4, respectively, and mixed in various molar ratios (with a total volume of 5 mL) in 10 mL
volumetric lasks. After 5 min, the solutions were
made upto mark, mixed well and the absorbance was subsequently measured at 420 nm. The graph
of the results obtained (ig. 4) gave a maximum at
a molar ratio of Xmax= 0.666 which indicated the formation of a 2:1 (OFX:iron(III)) complex as
sho-wn in igure 5. The formation constant (Kf) of the complex was also calculated from the continuous variation data using the following equation [43]:
[
]
nM n m
m f
n
C
A
A
A
A
K
)
(
/
1
/
2 +−
=
where A and Am are the observed maximum ab-sorbance and the abab-sorbance value when all the drug present is complexed, respectively. CM is the molar concentration of drug at the maximum ab-sorbance and n is the stoichiometry with which iron(III) complexes with drug. The log Kf value was found to be 5.65.
Figure 4. Continuous variation plot for OFX- iron(III) complex.
Fe O
N
N N C H
3
F O O
O CH
3
O N
N N
CH3 F
O
O O
CH3 OH2
H
2O
Figure 5. Probable structure of the OFX-iron(III) complex.
Method Validation
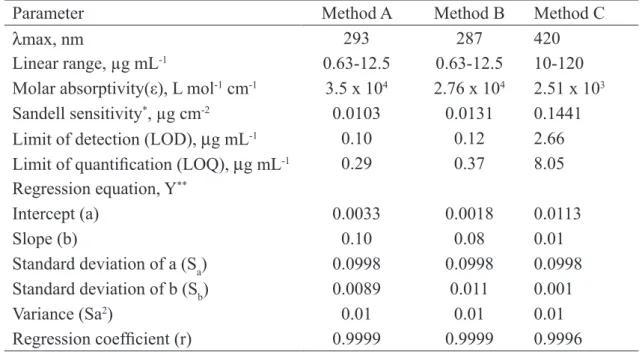
Linearity, sensitivity, limits of detection and
quantiication
ranges given in Table 2. The graphs are described by the regression equation:
Y = a + bX
(where Y - absorbance of 1-cm layer of so-lution; a - intercept; b - slope and X - concentra-tion in µg mL-1). Regression analysis of the Beer’s law data using the method of least squares was made to evaluate the slope (b), intercept (a) and
correlation coeficient (r) for each system and the
values are presented in Table 2. The optical cha-racteristics such as Beer’s law limits, molar ab-sorptivity and Sandell sensitivity values [44] of
all the three methods are also given in Table 2.
The limits of detection (LOD) and quantiication
(LOQ) calculated according to ICH guidelines [45] using the formulae:
LOD = 3.3 S/b and LOQ = 10 S/b, (where S is the standard deviation of blank absorbance va-lues, and b is the slope of the calibration plot) are
also presented in Table 2. The high values of ε and
low values of Sandell sensitivity and LOD indica-te the high sensitivity of the proposed methods.
Table 2.Sensitivity and regression parameters.
Parameter
Method A
Method B
Method C
λ
max, nm
293
287
420
Linear range, µg mL
-10.63-12.5
0.63-12.5
10-120
Molar absorptivity(ε), L mol
-1cm
-13.5 x 10
42.76 x 10
42.51 x 10
3Sandell sensitivity
*, µg cm
-20.0103
0.0131
0.1441
Limit of detection (LOD),
µ
g mL
-10.10
0.12
2.66
Limit of quantiication (LOQ),
µ
g mL
-10.29
0.37
8.05
Regression equation, Y
**Intercept (a)
0.0033
0.0018
0.0113
Slope (b)
0.10
0.08
0.01
Standard deviation of a (S
a)
0.0998
0.0998
0.0998
Standard deviation of b (S
b)
0.0089
0.011
0.001
Variance (Sa
2)
0.01
0.01
0.01
Regression coeficient (r)
0.9999
0.9999
0.9996
A = 0.001 measured in a cuvette of cross-sectional area 1 cm2 and l = 1 cm.
**Y=a+bX, Where Y is the absorbance, X is concentration in µg mL-1, a is intercept, b is slope.
OFX
µ
OFX
(n=7)
(n=5)
µ
OFX
µ
*Limit of determination as the weight in µg per mL of solution, which corresponds to an absorbance of A = 0.001 measured in a cuvette of cross-sectional area 1 cm2 and l = 1 cm.
**Y=a+bX, Where Y is the absorbance, X is concentration in µg mL-1, a is intercept, b is slope.
Precision and accuracy
The assays described under “general proce-dures” were repeated seven times within the day to determine the repeatability (intra-day precision) and five times on different days to determine the inter-mediate precision (inter-day precision) of the me-thods. These assays were performed for three levels of analyte. The results of this study are summarized in Table 3. The percentage relative standard
devia-tion (%RSD) values were ≤ 1.58% (intra-day) and
≤ 2.11% (inter-day) indicating high precision of the
methods. Accuracy was evaluated as percentage re-lative error (RE) between the measured mean con-centrations and taken concon-centrations for OFX. Bias
{bias % = [(Concentration found - known concen -tration) x 100 / known concentration]} was calcula-ted at each concentration and these results are also
presented in Table 3. Percent relative error (%RE) values of ≤ 3.0% demonstrate the high accuracy of
Table 3
day accuracy and precision
. Evaluation of intra-day and inter-day accuracy and precision.
.Method
OFX
taken,
µ
g
mL
-1Intra-day accuracy and precision
(n=7)
Inter-day accuracy and precision
(n=5)
OFX
found
±CL,
µ
g
mL
-1%RE
%RSD
OFX
found±CL,
µ
g mL
-1%RE
%RSD
A
3.0
6.0
9.0
3.05±0.02
5.93±0.04
9.06±0.08
1.67
1.17
0.67
0.56
0.67
0.89
3.09±0.07
6.08±0.12
9.11±0.22
3.00
1.33
1.22
1.80
1.56
1.98
B
3.0
6.0
9.0
2.92±0.02
6.08±0.04
8.95±0.07
2.67
1.33
0.56
0.62
0.79
0.82
3.07±0.06
6.11±0.09
9.10±0.13
2.33
1.83
1.11
1.56
1.22
1.11
C
30.0
60.0
90.0
29.4±0.30
60.9±0.69
91.0±1.33
2.00
1.50
1.11
1.11
1.22
1.58
30.6±0.56
61.3±1.44
91.8±2.40
2.00
2.17
2.00
1.48
1.89
2.11
standard deviation and CL. Conidence limits were
from: CL = ± tS/√n. (The tabulated value of t is 2.45 and 2.77 for six and four degrees of freedom respectively, at the 95% conidence level; S = standard deviation and n = number of measurements).
%RE. Percent relative error, %RSD. relative standard deviation and CL. Conidence limits were calculated from: CL = ± tS/√n. (The tabulated value of t is 2.45 and 2.77 for six and four degrees of freedom res
-pectively, at the 95% conidence level; S = standard deviation and n = number of measurements).
Selectivity
A systematic study was performed to deter-mine the effect of matrix by analyzing the place-bo blank and synthetic mixture containing OFX. A placebo blank of the composition: starch (10 mg), acacia (15 mg), hydroxyl cellulose ( 10 mg), sodium citrate (10 mg), talc (20 mg), magnesium stearate (15 mg) and sodium alginate (10 mg) was made and its solution was prepared as described under ‘tablets’, and then subjected to analysis. The absorbance of the placebo solution in each case was almost equal to the absorbance of the blank which revealed no interference. To assess the role of the inactive ingredients on the assay of OFX, a synthetic mixture was separately prepared by adding 20 mg of OFX to the placebo mentio-ned above. The drug was extracted and solution prepared as described under the general procedure for tablets. The solutions after appropriate dilu-tion wherever necessary were analyzed following the recommended procedures. The absorbance re-sulting from 10 µg mL-1 OFX in method A and
method B, and 70 µg mL-1 OFX solution method C, were nearly the same as those obtained for pure OFX solutions of identical concentrations. This unequivocally demonstrated the non-interference of the inactive ingredients in the assay of OFX. Further, the slopes of the calibration plots pre-pared from the synthetic mixture solutions were about the same as those prepared from pure drug solutions.
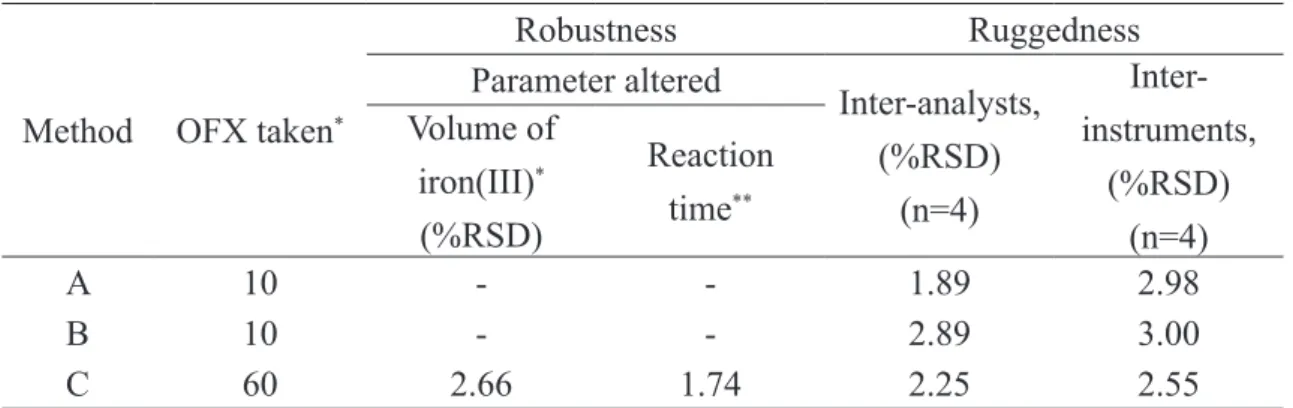
Robustness
The robustness of the method (method C) was evaluated by making small incremental chan-ges in the volume of iron(III) and reaction time, and the effect of the changes was studied by cal-culating the mean RSD values. The changes had
negligible inluence on the results as revealed by
small intermediate precision values expressed as
Ruggedness
Method ruggedness was expressed as the RSD of the same procedure applied by four different
analysts as well as using four different instruments. The inter-analysts RSD were within 2.89% whereas the inter-instruments RSD for the same OFX amount was less than about 3% suggesting that the deve -loped methods were rugged. The results are shown in Table 4.
Table 4. Method robustness and ruggedness expressed as intermediate precision (% RSD).
Method
OFX taken
*Robustness
Ruggedness
Parameter altered
Inter-analysts,
(%RSD)
(n=4)
Inter-instruments,
(%RSD)
(n=4)
Volume of
iron(III)
*(%RSD)
Reaction
time
**A
10
-
-
1.89
2.98
B
10
-
-
2.89
3.00
C
60
2.66
1.74
2.25
2.55
Zenlox 400
*Average of ive determinations.
Tabulated t value at the 95% conidence level is 2.77. Tabulated F value at the 95% conidence level
*Volumes of iron(III) solution used were 1.8, 2.0 and 2.2 mL. **Reaction times studied were 4, 5 and 6 min.
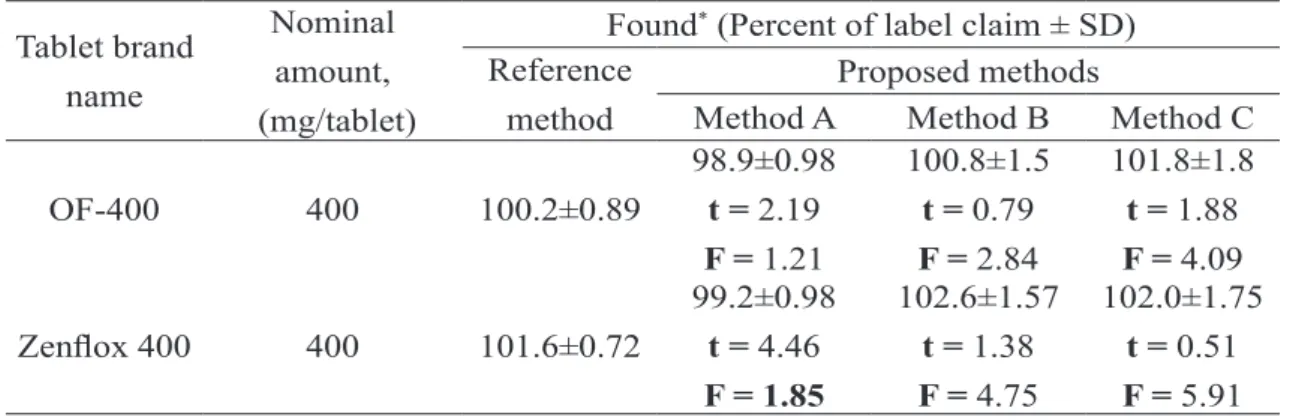
Analysis of pharmaceutical formulations
The described procedures were successfully applied to the determination of OFX in its
pharma-ceutical formulations (OF 400, Zenlox 400). The
results obtained (Table 5) were statistically com-pared with the British Pharmacopoeial method [31]. The method involved the titration of OFX in anhydrous acetic acid with acetous perchloric acid to a potentiometric end point detection. The results obtained by the proposed methods agreed well with those of reference method and with the label claim. The results were also compared sta-tistically by a Student’s t-test for accuracy and by a variance F-test for precision [46] with those of
the reference method at 95 % conidence level as
Table 5. Results of analysis of tablets by the proposed methods and statistical comparison of the results with the reference method.method.
Tablet brand
name
Nominal
amount, (mg/tablet)
Found* (Percent of label claim ± SD)
Reference
method
Proposed methods
Method A Method B Method C
OF-400 400 100.2±0.89
98.9±0.98
t = 2.19
F = 1.21
100.8±1.5
t = 0.79
F = 2.84
101.8±1.8
t = 1.88
F = 4.09
Zenlox 400 400 101.6±0.72
99.2±0.98
t = 4.46
F = 1.85
102.6±1.57
t = 1.38
F = 4.75
102.0±1.75
t = 0.51
F = 5.91
*Average of ive determinations.
Tabulated t value at the 95% conidence level is 2.77. Tabulated F value at the 95% conidence level
*Average of ive determinations.
Tabulated t value at the 95% conidence level is 2.77. Tabulated F value at the 95% conidence level is 6.39.
Application to spiked human urine
As another application of the proposed methods, recovery from human urine samples was carried out followed by a prior extraction of drug from urine in method A and method B, and treatment of drug with urine without any extraction step in method C. Recovery studies were performed with the sample containing various amounts of OFX. The results of recovery studies (Table 6) revealed that, other cons-tituents present in the urine did not interfere in the method. The recovery values were in the range
95.5-106.6% with standard deviation of 0.52-1.60. Oloxacin is rapidly and eficiently absorbed after oral
Table 6. Application of the proposed methods to the oloxacin concentration measurements in spiked urine.
Method
OFX added,
µg mL
-1OFX
found
*,
µg mL
-1Recovery
of OFX
(Percent±SD)
A
4.0
8.0
12.0
3.82
7.82
12.45
95.5±0.86
97.8±1.02
103.8±1.58
B
4.0
8.0
12.0
4.09
8.44
12.79
102.3±1.55
105.5±1.30
106.6±1.11
C
40.0
80.0
120.0
38.25
79.65
123.8
95.62±0.52
99.56±1.25
103.2±1.60
*Mean value of three determinations.
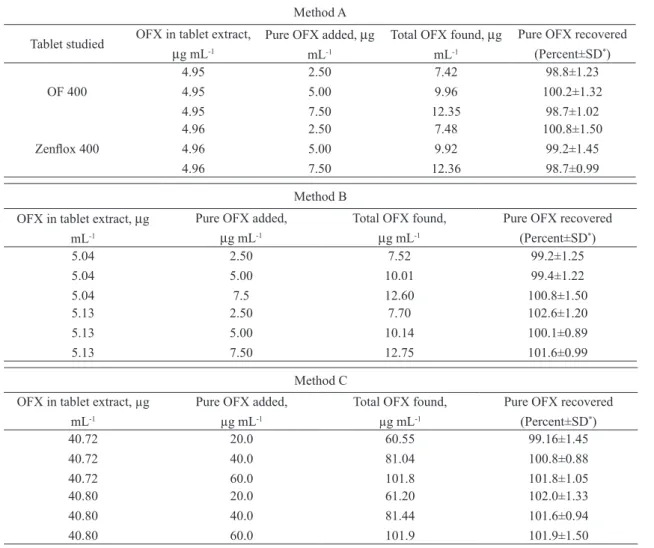
Recovery study
To further assess the accuracy of the methods, recovery experiments were performed by applying the standard-addition technique. The recovery was assessed by determining the agreement between the measured standard concentration and added known concentration to the sample. The test was done by
spiking the pre-analysed tablet powder with pure OFX at three different levels (50, 100 and 150 % of the
content present in the tablet powder (taken) and the total was found by the proposed methods. Each test
was repeated three times. In all the cases, the recovery percentage values ranged between 98.7-102.6% with relative standard deviation in the range 0.88-1.5%. Closeness of the results to 100 % showed the
Table 7. Results of recovery study using standard addition method.
Method A
Tablet studied OFX in tablet extract, µg mL-1
Pure OFX added, µg mL-1
Total OFX found, µg mL-1
Pure OFX recovered (Percent±SD*)
OF 400 4.95 4.95 4.95 2.50 5.00 7.50 7.42 9.96 12.35 98.8±1.23 100.2±1.32 98.7±1.02 Zenlox 400 4.96 4.96 4.96 2.50 5.00 7.50 7.48 9.92 12.36 100.8±1.50 99.2±1.45 98.7±0.99 Method B
OFX in tablet extract, µg mL-1
Pure OFX added, µg mL-1
Total OFX found, µg mL-1
Pure OFX recovered (Percent±SD*)
5.04 5.04 5.04 2.50 5.00 7.5 7.52 10.01 12.60 99.2±1.25 99.4±1.22 100.8±1.50 5.13 5.13 5.13 2.50 5.00 7.50 7.70 10.14 12.75 102.6±1.20 100.1±0.89 101.6±0.99 Method C
OFX in tablet extract, µg mL-1
Pure OFX added, µg mL-1
Total OFX found, µg mL-1
Pure OFX recovered (Percent±SD*)
40.72 40.72 40.72 20.0 40.0 60.0 60.55 81.04 101.8 99.16±1.45 100.8±0.88 101.8±1.05 40.80 40.80 40.80 20.0 40.0 60.0 61.20 81.44 101.9 102.0±1.33 101.6±0.94 101.9±1.50
*Mean value of three determination. Conclusion
Three simple, rapid, accurate and precise, and cost-effective spectrophotometric methods were developed and validated for the determina-tion of OFX in pharmaceuticals and in spiked hu-man urine. The proposed spectrophotometric me-thods do not require any expensive equipment and specialized technicians when compared alongside HPLC, chemiluminescence, FIA, electroanalytical and bioassay techniques. Besides, other characte-ristics of these methods are short time required for performance and ease of handling. The proposed UV methods are more sensitive than many
precise compared to most reported methods where the precision is affected by critical experimental variables. The absence of any crucial experimen-tal variable makes the present methods more accu-rate than many reported methods. The methods are useful for the quality control and routine analysis of OFX in pharmaceuticals since there is no inter-ference from the common excipients that might be found in commercial preparations. Also, these methods allow determination of OFX in human urine samples in the physiological concentration range obtained after the usual therapeutic dose of OFX has been administered.
Acknowledgement
Authors thank Cipla India Ltd, India, for gifting pure OFX. KBV thank the authorities of the University of Mysore, Mysore, for permission and facilities.
References
K. Sat, U. Matsura, M. Inone, T. Ueno, Y. Osada, H. Ogawa, M. Mitshuhashi, Antimicrob. Agents Chemother. 22 (1982) 548.
F.A. El-Yazbi, Spectrosc. Lett. 25 (1992) 279.
Q.J. Gong, J.L. Quiao, L.M. Du, C. Dong, Talanta 53 (2000) 359.
A. Le Coguic, R. Bidault, R. Farinotti, A. Dauphin, J. Chro-matogr. 434 (1988) 320.
O. Okazaki, H. Aoki, H. Hakusui, J. Chromatogr. 563 (1991) 313.
G. Carlucci, P. Mazzeo, T. Fantozzi, Anal. Lett. 26 (1993) 2193.
V.M. Shinde, B.S. Desai, N.M. Tendolkar, Indian Drugs 35 (1998) 715.
U.P. Halkar, P.B. Ankalkope, Indian Drugs 37 (2000) 585. M. S. Ali, M. Ghori, A. Saeed. J. Chromatogr. Sci. 40 (2002) 429.
A.J.N. Groenveld, J.R.B. Brouwers. Pharm. World Sci. 8 (1986) 79-84.
R.R. Kalta, R. Sharma, S.C. Chaturvedi. Ind. J. Pharma. Sci. 70 (2008) 491-494.
K. P. Chan, K. On Chu, W. W-K. Lai, K.W. Choy, C.C. Wang, D. S-C Lam, C. P. Pang. Anal. Biochem. 353 (2006) 30-36. T. Ohkubo, M. Kudo, K. Sugawara. Anal. Sci. 7 (1991) 741-743.
M.A. Gracia, C. Solans, A. Calvo, M. Royo, E. Hernandez, R. Rey, M.A. Bregante. Chrmatographia, 55 (2002) 431-434. B. Srividya, R.M. Cardoza, P.D. Amin, Indian drugs, 40 (2003), 41-43.
S.W. Sun, A.L. Wu, J. Liq. Chromatogr. Relat. Technol. 22 (1999) 281.
C. Horstkoetter, G. Blaschke, J. Chromatogr. B 754 (2000) 169.
S.S. Zhang, H. Liu, Y.J. Wu, C.L. Yu, Analyst 126 (2001) 441.
A. Tamer, Anal. Chim. Acta. 231 (1990) 129. M. Tuncel, Z. Atkosar, Pharmazie 47 (1992) 642. G. Zhou, J. Pan, Anal. Chim. Acta. 307 (1995) 49.
M. Rizk, F. Belal, F. Aly, N. El-Enany, Talanta 46 (1998) 83. J. Wu, H. Zhao, L. Wei, T.Z. Ai, X.Z. Dong, Fenxi Huaxue 29 (2001) 1106.
F. Paul, J.L Adcock, Anal. Chim. Acta. 541 (2005) 3. S. Hanwen, L Liqing, C. Xueyan, Anal. Sci. 22 (2006) 1145. Y Rao, Y Tong, X.R. Zhang, G. Luo, Baeyens, Willy, J. Fluo-resc, 17 (2007) 481.
L. Yi, H. Zhao, S. Chen, L. Jin, D. Zheng, Z. Wu, Talanta 61 (2003) 403.
Y.D. Liang, J.F. Song, X.F. Yang, Anal. Chim. Acta 510 (2004) 21.
B. Li, Z. Zhang, L. Zhao, Ch. Xu, Talanta 57 (2002) 765. S.E. Lisiane da, E.S.S. Elfrides. J. Pharm. Biomed. Anal, 27 (2002) 91.
British Pharmacopeia. Vol III Her Majesty’s Stationery office, London, (2003) p 1357.
United States Pharmacopoeia XXII, National Formulary XVII, Rockville, USA Convention, (1990) p 912.
European Pharmacopoeia. EDQM, Council of Europe, Stras-bourg, France. 5 (2005) p 2131.
P.U. Patel, B.N. Suhagia, M.M. Patel, G.C. Patel, G.N. Patel, Indian Pharmacist, 6 (2007) 59.
Y.M. Issa, F.M. Abdel-Gawad, M.A. Abou Table, H.M. Hus-sein, Anal. Lett. 30 (1997) 2071.
C. S. P. Sastry, Kolli Rama Rao, D. Siva Prasad, Talanta, 42 (1995) 311.
C.J. Eboka, S.O. Aigbavboa, J.O. Akerele, J. Antimicrob. Chemother. 39 (1997) 639.
S.C. Mathur, Y. Kumar, N. Murugesan, Y.K.S. Rathore, P.D. Sethi, Indian Drugs, 29 (1992) 376.
M.S. Soledad, M.I. Albero, C. Sanchez-Pedreno, M.S. Abuherba, Eur. J. Pharm. Biopharm. 61 (2005) 87.
C.S.P. Sastry, K.R. Rao, D.S. Prasad, Indian Drugs, 32 (1995) 172.
D. Lee, H. Han, K. Kim, W. Park, J.Cho. J.Kim, J. Pharm. Biomed. Anal. 12 (1994) 157.
Douglas, A. S and Donald. M. W. 1971. “Principels of Ins-trumental Analysis,” Holt, Rinheart and Winston, New York, p 104.
Zavis, H., Ludvik, D., Milan, K., Ladislaw, S. and Frantis-ck, V. Handbook of Organic Reagents in Inorganic Analysis. Translated by Stanislav, K, Dr. Chalmers (The Series and Translation Editor: University of Aberdem, Ellis Horwood Limited, Chichester, A Division of John Wiley & Sons IC, New York, London, Sydney. Toronto. (1976) p 364.
International Conference on Hormonisation of Technical Re-quirements for Registration of Pharmaceuticals for Human Use, ICH Harmonised Tripartite Guideline, Validation of Analytical Procedures: Text and Methodology Q2(R 1), Com-plementary Guideline on Methodology dated 06 November 1996, incorporated in November 2005, London.