261 www.IJSPP-Journal.com ORIGINAL INVESTIGATION
Cluster Stability as a New Method to Assess
Changes in Performance and its Determinant Factors
Over a Season in Young Swimmers
Jorge E. Morais, António J. Silva, Daniel A. Marinho, Ludovic Seifert, and Tiago M. Barbosa
Purpose: To apply a new method to identify, classify, and follow up young swimmers based on their performance and its
determinant factors over a season and analyze the swimmers’ stability over a competitive season with that method. Methods: Fifteen boys and 18 girls (11.8 ± 0.7 y) part of a national talent-identification scheme were evaluated at 3 different moments of a competitive season. Performance (ie, official 100-m freestyle race time), arm span, chest perimeter, stroke length, swim-ming velocity, speed fluctuation, coefficient of active drag, propelling efficiency, and stroke index were selected as variables. Hierarchical and k-means cluster analysis were computed. Results: Data suggested a 3-cluster solution, splitting the swimmers according to their performance in all 3 moments. Cluster 1 was related to better performances (talented swimmers), cluster 2 to poor performances (nonproficient swimmers), and cluster 3 to average performance (proficient swimmers) in all moments. Stepwise discriminant analysis revealed that 100%, 94%, and 85% of original groups were correctly classified for the 1st, 2nd, and 3rd evaluation moments, respectively (0.11 ≤ Λ ≤ 0.80; 5.64 ≤ χ2 ≤ 63.40; 0.001 < P ≤ .68). Membership of clusters was moderately stable over the season (stability range 46.1–75% for the 2 clusters with most subjects). Conclusion: Cluster stability is a feasible, comprehensive, and informative method to gain insight into changes in performance and its determinant factors in young swimmers. Talented swimmers were characterized by anthropometrics and kinematic features.
Keywords: prepubescent swimmers, seasonal adaptations, longitudinal assessment, classification
Two of the most interesting research topics in the field of sports performance, and specifically in competitive swimming, are the identification of performance-determinant factors and performance modeling. Several research groups have focused on identifying the main performance determinants and how they interplay to improve performance. Performance of young swimmers is influenced by growth and maturation.1 Biological maturation may promote changes in their biomechanics, motor control, and energetics, which may affect their expertise achievement.2 Young swimmers experience different rates of development that progress according to their own time scale.3 For example, 2 structural-equation models reported that anthropometrics influence swimmers’ kinematics and hence their performance.4,5 The second topic of research interest is to model performance over time. The model enables a researcher or sports analyst to predict a subject’s performance at a given moment, for example, at a given age or competition (ie, mean stability, within-subject analysis).6 Longitudinal assessments can also be carried out to understand the relative changes of performance among the main athletes (ie, normative stability, between-subjects analysis).1,7
New trends in sports performance and expertise should adopt a multidisciplinary approach to enhance our understanding of the athlete–environment relationship as exemplifying a complex and dynamic system in opposition to the traditional frameworks.8 In such a dynamic system, all expert athletes do not follow the same pathway to achieve a given performance.9,10 Keeping in view the complex and diverse nature of the scientific fields that play a role in performance, and despite the existence of an optimal pathway to expertise achievement, each athlete selects a custom-ized path.10 Likewise, the performance of both adult/elite11–13 and young5 swimmers is determined by several domains. The partial contribution of each domain or determinant factor to performance will most likely change over time, not remain constant. However, until now, no research has been conducted on this aspect, at least in respect to young athletes, who are typically involved in such a complex and dynamic system, as has been done in the case of age-group swimmers.
Longitudinal and multidisciplinary designs should aid our understanding of the performance changes and the partial contri-bution of each determinant factor over time in young swimmers. For an insight into this problem, 2 independent procedures must be selected (deterministic analysis and longitudinal/stability analysis). Identified with the deterministic analysis are the main factors acting on the swimmer’s performance at a given moment; in longitudinal analysis, changes of each selected variable are tracked down and followed up. As these 2 procedures are independent, it is challeng-ing to establish any causality between them. For deeper insight on the relationship between these 2 analyses, it is worthwhile to merge the 2 into a single procedure. By doing so, it would be possible to learn about the changes in performance or determinant factors Morais is with the Dept of Sport Sciences, Polytechnic Institute of
Bragança/CIDESD, Bragança, Portugal. Silva is with the Dept of Sport Sciences, Exercise and Health, University of Trás-os-Montes and Alto Douro/CIDESD, Vila Real, Portugal. Marinho is with the Dept of Sport Sciences, University of Beira Interior/CIDESD, Covilhã, Portugal. Seifert is with CETAPS EA3832, Faculty of Sports Sciences, University of Rouen, Rouen, France. Barbosa is with the National Inst of Education, Nanyang Technological University, Singapore. Address author correspondence to Tiago Barbosa at [email protected].
over time, how these factors interplay at a given moment and over time, and what the main determinant factors are at a given moment. This procedure can be applied for both short and long time frames (eg, from a few weeks to several years) depending on the nature of the research.
As sports performance is a multidisciplinary phenomenon, multivariate data analysis (eg, cluster analysis) can be implemented to detect patterns within high-dimensional data sets. Cluster analysis is one such procedure that identifies homogeneous groups of sub-jects. Subjects grouped in a specific cluster share several common characteristics but are very dissimilar to others not belonging to that cluster.14 This procedure has been mainly applied in scientific fields such as genetics,15 motor control,14,16 and psychology.17 A few studies have been conducted on adult/elite swimmers to clas-sify coordination patterns,18 start patterns,19 and race analysis.20 Cluster analysis can also be a feasible approach to identify and classify young athletes’ determinant performance factors at a given moment. Over and above that, changes of a subject from one cluster to another, and in evaluation moments, could enable one to understand the subject’s stability and the reason behind the subject’s performance change. Thus, a new method that combines cluster analysis with longitudinal design should be tested. This novel method based on cluster stability might provide us details about how determinant variables in isolation (ie, bivariate analysis) or in combination (ie, multivariate analysis) contribute to performance and how their partial contribution changes over time.
To our knowledge, no studies have been carried out on cluster stability in swimming or even sports performance, excepting for 1 relating to nutrition.21 In that study, the authors developed a clus-tering solution about dietary patterns and thereafter analyzed the changes in the stability of young subjects between cluster groups in a given time frame. This method of assessing cluster stability over time can be considered a breakthrough in sport sciences, notably in sports performance and swimming. By performing cluster analysis, it will be possible not only to classify young swimmers according to their performance and its main determinants but also to assess the stability of the cluster membership over time and thereby help coaches in following up the athletes and designing customized training.
The aims of this study were to apply a new method to identify, classify, and follow up young swimmers, based on their performance and its determinant factors over a season, and to analyze the swim-mers’ stability over a competitive season with that method. We hypothesized that the new method would be feasible and informa-tive to identify, classify, and follow up young swimmers and that there would be moderate to high stability in the cluster membership across the season.
Methods
Subjects
Thirty-three young swimmers (overall, 11.8 ± 0.7 y, 262.6 ± 74.3 Fédération Internationale de Natation [FINA] points at short-course meters [SCM] 100-m freestyle, 47.0 ± 8.3 kg body mass, 156.2 ± 8.8 cm height; boys, n = 15, 12.3 ± 0.6 y, 227.9 ± 69.8 FINA points at SCM 100-m freestyle, 49.9 ± 9.3 kg body mass, 159.9 ± 8.7 cm height; girls, n = 18, 11.7 ± 0.9 y, 291.1 ± 66.2 FINA points at SCM 100-m freestyle, 44.6 ± 6.7 kg body mass, 153.1 ± 7.8 cm height; Tanner stages 1–2 by self-report) participating on a regular basis in regional- and national-level competitions were evaluated.
The sample included age-group national record holders, age-group national champions, and other swimmers who formed part of a national talent-identification scheme. At baseline, the swimmers had 3.18 ± 0.52 years of training experience. The swimmers underwent 5.59 ± 0.92 (ranging from 3 to 8 in the season, 90 min each ses-sion) weekly training sessions including warm-up; recovery; slow, medium, and intense pace; technical drills; and dry-land strength and conditioning sessions (2 per week).
Coaches and/or parents and also the swimmers gave their con-sent for the swimmers’ participation in this study. All procedures were in accordance with the Helsinki Declaration regarding human research. The University of Trás-os-Montes and Alto Douro ethics committee also approved the study design (ethics review: UTAD-2011 to 219).
Study Design
A longitudinal research design of selected variables over 3 differ-ent momdiffer-ents in the season was carried out. The swimmers were evaluated first in October (M1, the season’s first competition), then in March (M2, the winter’s main competition), and then in June (M3, the summer’s main competition). Variables that are regularly reported as having an effect on swimming performance1,4,5,9,11–13 were selected. All pool-testing data collection was conducted with no swimmers in nearby lanes to reduce drafting or pacing effects. Performance-Data Collection
To assess swimming performance, the 100-m freestyle race time, recorded officially at regional or national SCM swimming pools (ie, 25-m length) was selected. The time gap between data collection and the race was no more than 2 weeks.5
Anthropometric-Data Collection
Arm span (AS) was measured standing in the upright position with arms and fingers fully extended and abducted at 90°. The distance between the third fingertips of both hands was measured with a flexible anthropometric tape (RossCraft, Canada) (ICC = .98). Chest perimeter (CP) was measured with a flexible anthropometric tape (RossCraft, Canada) while the swimmer simulated a streamlined gliding (ie, hydrodynamic) position with both arms fully extended upward (ICC = .99).
Kinematic-Data Collection
Swimming velocity (v), stroke length (SL), and speed fluctuation (dv) were selected as kinematic variables. Swimmers performed a standardized warm-up of approximately 1000 m.22 Afterward, each swimmer performed 3 maximal 25-m trials in freestyle with a push-off start. Swimmers were advised to reduce gliding during the push-off. Between trials, the swimmers were allowed 30 minutes rest to ensure full recovery. For further analysis, the average value of 3 trials was considered (ICC = .96).
A speedometer cable (Swim speedometer, Swimsportec, Hildesheim, Germany) was attached to the swimmer’s hip. A 12-bit-resolution acquisition card (USB-6008, National Instruments, Austin, TX, USA) was used to transfer data (f = 50 Hz) from the speedometer to a software interface in LabVIEW (v. 2009).23 Data were exported to signal-processing software (AcqKnowledge v. 3.5, Biopac Systems, Santa Barbara, CA, USA) and filtered with a 5-Hz-cutoff low-pass fourth-order Butterworth filter.
v (m/s) was calculated as the time spent between the 5th and 20th meters (ie, middle 15 m; v = d/t). SL (m) was calculated by dividing velocity with stroke frequency (SF) (SL = v/SF).24 SF was measured (cycles/min and then converted to Hz) by 2 expert evalu-ators with a stroke counter (base 3). dv (in dimensionless units) was calculated with the coefficient of variation as reported elsewhere (dv = CV = SD/mean).12
Hydrodynamic-Data Collection
Coefficient of active drag (CDa) was computed using the velocity-perturbation method.25 To calculate CDa, the following inputs are required: water density (being 1000 kg/m3), active drag force (given by the difference in swimming speed with and without perturbation buoy according to its resistance, Da = [Db × vb × v2]/[v3 – vb3]), v, and the swimmer’s projected frontal surface area (S).25 Each swim-mer performed 2 extramaximal 25-m freestyle trials with a push-off start. The first trial was performed without the perturbation device and the second one with the perturbation device.26
v was assessed between the 11th and 24th meters from the start-ing wall.26 The time spent to cover this distance was measured with a manual stopwatch (Golfinho Sports MC 815, Aveiro, Portugal) by 2 expert evaluators (ICC = .96). The evaluators followed the swimmer to a have a good line of sight when the swimmer passed the 2 distance marks.
The swimmers’ projected frontal surface area was measured using a photogrammetric technique,27 and their photographs taken with a digital camera (DSC-T7, Sony, Tokyo, Japan) in the trans-verse plane from above. For the photographs, the swimmers stood on land, in the upright and streamlined position. In this position, the arms were fully extended above the head, one hand over the other, and the fingers also extended close together, while the head was in neutral position. They wore a regular textile swimsuit, cap, and goggles. On the camera shooting field, a calibration frame with 0.945-m length was aside the swimmer at the shoulder level. The
S was measured with area-measuring software (Udruler, AVPSoft, USA) after importing the digital picture (ICC = .97).
Efficiency-Data Collection
Efficiency variables were estimated from kinematic data. SI (m2/s) was calculated as the product of SL and v (SI = SL × v).28 The arm’s propelling efficiency (ηp, %) was also calculated, using v, SF, and the distance between the shoulder and the tip of the third finger during the insweep (m) as inputs.29 The shoulder-to-finger distance was com-puted trigonometrically by measuring the arm’s length and consider-ing the average elbow angles durconsider-ing the insweep of the arm pull.30 Statistical Analysis
Kolmogorov-Smirnov and Levene tests were used to analyze nor-mality and homoscedasticity assumptions, respectively. Mean, SD, minimum, and maximum were calculated as descriptive statistics.
To increase confidence in the stability of the emergent profiles, 2 clustering approaches were used: hierarchical cluster analysis (using the Ward linkage method with squared Euclidian distance measure to provide guidance as to the number of clusters repre-sented in the data) and k-means (nonhierarchical) cluster analysis to compute the clusters and thus group the swimmers according to their similarities. k-means define a prototype in terms of a centroid (ie, the mean of a group of points), typically applied to objects in a continuous n-dimensional space. Standardized z-scores of the
selected variables were calculated to compare data sets with dif-ferent units and/or magnitudes.14
ANOVA was used to identify the variables having the high-est influence in each cluster, and discriminant analysis (stepwise method) was used to validate them (P ≤ .05). Total eta-squared (η2) was selected as an effect-size index and interpreted as31 without effect if 0 < η2 ≤ .04, minimal if .04 < η2 ≤ .25, moderate if .25 < η2 ≤ .64, and strong if η2 > .64. Swimmers’ changes between clus-ters were assessed by cross-tabulating cluster solutions at different moments. This kind of assessment enables calculation of the propor-tion of swimmers remaining in the same cluster between pairs of moments and consequently the proportion of swimmers that changed between clusters.21 The distance between clusters informs about cluster similarities and dissimilarities. A higher distance between clusters means a higher dissimilarity.
Results
Overall, the anthropometric features increased between the first and last evaluation moments (body mass increased from 49.9 ± 9.3 to 52.9 ± 9.1 kg in boys and from 44.6 ± 6.7 to 46.5 ± 6.2 kg in girls; height increased from 159.9 ± 8.7 to 162.9 ± 8.8 cm in boys and from 153.1 ± 7.8 to 155.6 ± 7.2 cm in girls). The coefficient of determination (R2) was selected to test several cluster solutions (from 1 to 9, ie, 1 < k < 9). A 3-cluster solution (k = 3) provided stable interpretations over the season.
The SI, v, and SL were the variables with the strongest (ie, η 2 > .64) and best discrimination effect (ie, highest F ratios) among the cluster solutions of all moments (Table 1). Cluster 1 was characterized by high CP, AS, and SI (M1); CP and AS (M2); and AS, SI, and v (M3). Cluster 1 was also characterized by the best performance at all moments (labeled talented swimmers; ie, better-performing swimmers). Cluster 2 was characterized by high
dv (M1 and M2) and ηp (M3). Cluster 2 was also characterized by the slowest performance at all moments (labeled nonprofi-cient swimmers; ie, poorer-performing swimmers). Cluster 3 was characterized by high CDa (M1); SI, ηp, and v (M2); and CP and AS (M3). Cluster 3 was also characterized by average performance at all moments (labeled proficient swimmers; ie, average-performing swimmers).
A comparison of the classification results of original (ie, the frequencies found in the data) and predicted (ie, the predicted fre-quencies from the analysis) group memberships, according to the canonical discriminant functions obtained, and stepwise discriminant analysis reveal that 100%, 94%, and 85% of the original groups were correctly classified in M1, M2, and M3, respectively (.11 ≤ Λ ≤ .80, 5.64 ≤ χ2 ≤ 63.40, .001 < P ≤ .68). Visual inspection of the territorial map of the 2 canonical discriminant functions reveals a good or very good compactness and separation at M1, M2, and M3 (Figure 1).
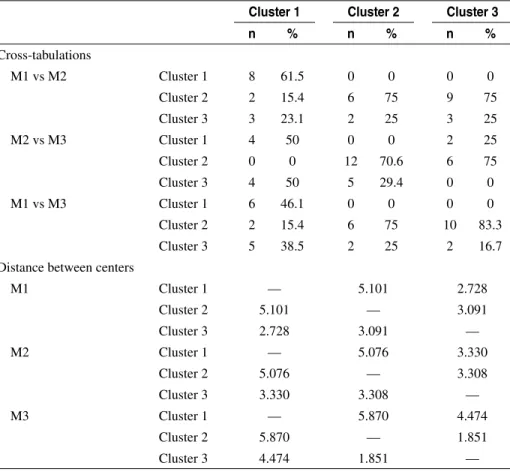
As regards cluster membership over the course of the season (see Table 2), it can be seen that cluster 2 (nonproficient swimmers) had the highest stability (70.6–75% of the swimmers stayed in this cluster, at M2 v sM3 and M1 vs M2, as well as M1 vs M3), followed by cluster 1 (talented swimmers; 46.1% at M1 vs M3 to 61.5% at M1 vs M2) and finally by cluster 3, which had the least stability (proficient swimmers; from 0% at M2 vs M3 to 25% at M1 vs M2). Overall, there was thus moderate stability in cluster membership, as the 2 clusters with more subjects presented a stability ranging roughly from 45% to 75%.
Table 2 also shows the distance between cluster centers. At all moments, swimmers in cluster 3 (proficient swimmers) were closer
to swimmers in cluster 1 (talented swimmers). However, from M1 to M3, the distance between cluster 3 (proficient swimmers) and cluster 2 (nonproficient swimmers) decreased from 3.091 to 1.851 (ie, higher similarity). At the same time, the distance between cluster 3 (proficient swimmers) and cluster 1 (talented swimmers) increased from 2.728 to 4.474 (ie, higher dissimilarity). This suggests that during this time frame the proficient swimmers could not reach a par with the talented swimmers, but at the time the nonproficient ones were able to close the gap with the proficient counterparts.
Discussion
The aim of this study was to describe and apply a new procedure to identify, classify, and analyze cluster stability of young swim-mers over a competitive season. The main finding was that cluster
stability is a feasible, comprehensive, and informative method to gain insight into young swimmers’ changes over time. Another important finding is that talented swimmers are characterized by anthropometrics and kinematic features.
The main goal of cluster analysis is to find similar trends within a data set (young swimmers in this case). Participants or traits in the same cluster are similar to each other, while those in other clusters are as dissimilar as possible.14 A hierarchical model was used to define the number of clusters to retain with an R2 method, as suggested earlier.19 Afterward, k-means solution was tested to compute the clusters and thereby grouped the swimmers according to their similarities. Cluster analysis may be considered challenging because it might be difficult to form distinguished and equally dimensioned clusters (for this research, the sample sizes of the cluster solutions were fairly even), and it may not consider Table 1 Performance and Its Determining Factors for Swimmers Classified in Each Cluster Assessed at Baseline (Moment 1), Midseason (Moment 2), and End-Season (Moment 3)
Cluster 1 Cluster 2 Cluster 3
F P η2
Mean ± SD z Mean ± SD z Mean ± SD z
Moment 1 (n = 13) (n = 8) (n = 12)
arm span (cm) 166.9 ± 9.6 0.81 149.8 ± 9.3 –0.73 153.6 ± 5.4 –0.39 13.1 <.001 .40
chest perimeter (cm) 83.6 ± 3.4 0.92 72.8 ± 4.5 –0.91 75.9 ± 3.4 –0.38 23.8 <.001 .50
stroke length (m) 1.69 ± 0.17 0.80 1.13 ± 0.20 –1.24 1.46 ± 0.11 –0.04 28.0 <.001 .66
swimming velocity (m/s) 1.38 ± 0.11 0.80 0.91 ± 0.16 –1.34 1.21 ± 0.08 0.02 38.5 <.001 .76
speed fluctuation (dimensionless) 0.09 ± 0.03 0.03 0.10 ± 0.04 0.29 0.08 ± 0.02 –0.23 0.6 .517 .10
active drag coefficient (dimensionless) 0.31 ± 0.08 –0.19 0.23 ± 0.08 –0.68 0.45 ± 0.20 0.67 6.5 .004 .38
propelling efficiency (%) 30.47 ± 2.93 0.63 22.46 ± 4.39 –1.14 27.97 ± 2.86 0.07 14.6 <.001 .57 stroke index (m2/s) 2.36 ± 0.36 0.88 1.06 ± 0.32 –1.30 1.78 ± 0.22 –0.09 43.6 <.001 .75 performance (s) 71.17 ± 5.91 –0.75 83.67 ± 5.11 1.00 77.57 ± 4.44 0.14 14.5 <.001 .49 Moment 2 (n = 8) (n = 17) (n = 8) arm span (cm) 173.1 ± 9.2 1.20 155.1 ± 6.4 –0.52 159.7 ± 8.1 –0.08 15.2 <.001 .77 chest perimeter (cm) 86.5 ± 3.6 0.97 77.5 ± 4.5 –0.47 80.6 ± 6.4 0.03 13.1 <.001 .40 stroke length (m) 1.30 ± 0.17 0.66 1.04 ± 0.10 –0.64 1.30 ± 0.19 0.70 43.9 <.001 .49 swimming velocity (m/s) 1.16 ± 0.23 0.87 0.85 ± 0.06 –0.66 1.10 ± 0.16 0.54 74.4 <.001 .53
speed fluctuation (dimensionless) 0.11 ± 0.05 0.32 0.10 ± 0.03 –0.01 0.10 ± 0.02 –0.29 0.1 .918 .07
active drag coefficient (dimensionless) 0.302 ± 0.08 0.16 0.26 ± 0.09 –0.31 0.30 ± 0.11 0.50 2.9 .066 .14
propelling efficiency (%) 22.71 ± 3.88 0.20 20.03 ± 2.12 –0.46 21.88 ± 4.02 0.77 39.3 <.001 .29 stroke index (m2/s) 1.55 ± 0.50 0.80 0.89 ± 0.13 –0.63 1.46 ± 0.40 0.55 72.0 <.001 .51 performance (s) 64.72 ± 4.88 –1.23 75.91 ± 3.98 0.61 72.18 ± 6.02 –0.07 13.4 <.001 .61 Moment 3 (n = 6) (n = 18) (n = 9) arm span (cm) 176.6 ± 7.4 1.41 156.6 ± 7.1 –0.55 162.3 ± 10.1 0.17 14.7 <.001 .61 chest perimeter (cm) 89.2 ± 3.3 1.17 79.2 ± 5.76 –0.46 82.9 ± 6.1 0.14 8.4 .001 .43 stroke length (m) 1.69 ± 0.15 1.17 1.34 ± 0.20 –0.36 1.41 ± 0.19 –0.05 25.2 <.001 .38 swimming velocity (m/s) 1.49 ± 0.09 1.30 1.13 ± 0.16 –0.44 1.22 ± 0.18 0.02 58.3 <.001 .48
speed fluctuation (dimensionless) 0.10 ± 0.02 0.24 0.09 ± 0.02 0.03 0.08 ± 0.02 –0.23 0.1 .953 .05
active drag coefficient (dimensionless) 0.52 ± 0.34 0.91 0.30 ± 0.12 –0.22 0.32 ± 0.09 –0.14 7.8 .002 .23
propelling efficiency (%) 29.13 ± 1.35 0.57 26.49 ± 3.91 –0.11 26.92 ± 3.83 –0.16 33.1 <.001 .09
stroke index (m2/s) 2.54 ± 0.29 1.39 1.54 ± 0.40 –0.44 1.76 ± 0.44 –0.03 64.1 <.001 .52
performance (s) 61.63 ± 2.90 –1.46 73.43 ± 3.92 0.60 68.64 ± 3.36 –0.23 9.4 .001 .13
the hypothetical relationships between variables (in this study, discriminant variables of the clustering solutions are meaning-ful for swimming researchers and practitioners). An interesting and novel idea is to combine cluster analysis with longitudinal analysis. This is based on the reasoning that after developing a cluster solution, it will analyze the membership changes over time (ie, cluster stability). To the best of our knowledge, this approach has not been attempted so far in sports science. However, the current study proves it to be a feasible and informative way to gain insight into performance changes over time and the partial contribution of the determinant factors, or at least a set of factors, at a given moment.
The 3-cluster solution (k = 3) was the one that showed the high-est power, besides allowing for stable data interpretation. Marginal gains were observed after the fourth cluster (k ≥ 4). Cluster 1 was labeled talented swimmers; cluster 2, nonproficient swimmers; and cluster 3, proficient swimmers, because performance was the main discriminant variable across all the clusters at all moments. Cluster 2 was related to poor performances and high dv. There is evidence to show that a high dv is related to an increase in energy cost.12 For the swimmers in cluster 2, one might consider that their impaired performance is related to a high dv. Cluster 1 is related to better performance, anthropometrics (high AS and CP), and therefore to kinematics (high SI and v). Indeed, young swimmers’ performance is highly related to anthropometric features.9 Thus, it seems that a few swimmers (from cluster 1) might rely more on their genetics and intrinsic characteristics (ie, anthropometrics) than on external conditions (ie, training and improving technique) to enhance their performance. Cluster 3 was associated with a set of variables from different domains (ie, anthropometric, kinematic, hydrodynamic, and efficiency). For the swimmers of this cluster, the anthropomet-rics by themselves cannot explain their performance. Hence, another way to achieve better performance is to rely more on intervention programs (ie, training sessions and technique improvements) than on genetics.
The main novelty of this research was that it assessed cluster stability over time. Cluster analysis was developed to deal with problems in data mining when investigators needed to identify patterns in high-dimensional data sets14 such as those associated with talent identification and follow-up. Discriminant analysis was used for cluster validation.32 Good to very good cluster separation and compactness are verified by visual inspection of the territorial map (Figure 1). Cross-validation is a comparison of the classifica-tion results of original data (ie, the frequencies of groups found in the data) and those predicted (ie, the frequencies of groups predicted from analysis) according to the canonical discriminant functions obtained. Cross-validation revealed that, over the season, cluster membership was correctly classified in 100%, 94%, and 85% of the subjects (ie, very good prediction). Cluster validity can also be assessed with bootstrapping,33 normalized Hubert-Γ.34 Cross-tabulation is a feasible and straightforward way to assess participants’ changes between clusters across time.21 The num-bers of participants that remain, are added, or are removed from a cluster are calculated.
Across the 3 clusters, most outcomes between M1 and M3 showed improvement. A similar trend was reported by others for anthropometric, biomechanics, and efficiency parameters.1,2 One might consider that improvement over time would happen in a linear or a near-linear fashion in children. However, although there was improvement in performance throughout the season (ie, from M1 to M2 to M3), several determinant factors showed impairment. It seems that such nonlinear changes have not been reported so far for Figure 1 — Territorial map of the 2 canonical discriminant functions in
(A) moment 1, (B) moment 2, and (C) moment 3. Group centroid 1, talented swimmers; group centroid 2, nonproficient swimmers; group centroid 3, proficient swimmers.
age-group swimmers. However, such changes were reported in the case of adult or elite counterparts.7 Thus, it seems that the deter-minant factors play a major role in contributing to performance at a given moment. This can be related to the designed periodization model, because age-group swimming, just as most youth sports, is designed with classic periodization models. Such models are based on 1 or 2 major peaks per season, 1 of them being the main competition. Therefore, coaches will be building up fitness (ie, energetics, as well as strength and conditioning) and improving techniques as they approach the main competition. Because the main competition comes at the end of the season, coaches probably consider that swimmers do not need to be in their best shape in the middle of the season, or, at least, they may rely more on a given set of determinant factors to improve their performance. Hence, near future research projects should consider selecting a few energetic variables to control the role of the energetic build-up over the season in age-group swimmers, as happens on a regular basis with adult and elite counterparts.
Moderate stability (ie, moderate change in cluster member-ship) was observed across the season. Cluster 1 (talented swim-mers) presented moderate stability (46.1–61.5%, even though the membership decreased from 13 to 6 swimmers). Cluster 3 (pro-ficient swimmers) showed low to moderate stability (0–25% and membership decrease from 12 to 9 swimmers). Overall, cluster membership of talented and proficient swimmers seems to have decreased over the season. Cluster 2 (nonproficient swimmers)
presented high stability (70.6–75% and membership increase from 8 to 18 swimmers). This increase is related to the movement (ie, selection) of some swimmers from clusters 1 and 3 to cluster 2, because they could not maintain high performance levels. It should be noted that all swimmers improved their performances from M1 to M3 (ie, within-subject comparison). Notably, 2 subjects moved straight from cluster 1 to cluster 2 between 2 evaluation moments. Such events can be attributed to anthropometrics and maturation changes or academic commitments, in addition to other factors. However, it is not surprising that no swimmer could move straight from cluster 2 to cluster 1. The change of a swimmer from a high-stability cluster to a relatively low-stability cluster implies that the swimmer could not improve his or her performance as much as the others did (ie, between-subjects comparison). Thus, with fine-tuning of the cluster membership, the number of talented swimmers may dwindle. Some talented swimmers, at some point, who fail to stay in that cluster drop to the proficient cluster, and, similarly, those in the proficient cluster move to the nonproficient cluster. With this, the typical pyramid shape of the selection process was verified in M3 and, in a way, in M2 also. At the base of the pyramid were the nonproficient swimmers (n = 18), in the middle the proficient swimmers (n = 9), and at the top the talented swimmers (n = 6). Holistic research encompassing motor control, training (ie, sports periodization), biomechanics, and physiology can, in the near future, bring more insight into this phenomenon.
Table 2 Number of Swimmers Reclassified in Each Cluster Between Baseline (M1) and Midseason (M2), Between M2 and End-Season (M3), and Between M1 and M3 and Distances Between Cluster Centers for Each Pairwise Comparison of Clusters at Each Moment
Cluster 1 Cluster 2 Cluster 3
n % n % n % Cross-tabulations M1 vs M2 Cluster 1 8 61.5 0 0 0 0 Cluster 2 2 15.4 6 75 9 75 Cluster 3 3 23.1 2 25 3 25 M2 vs M3 Cluster 1 4 50 0 0 2 25 Cluster 2 0 0 12 70.6 6 75 Cluster 3 4 50 5 29.4 0 0 M1 vs M3 Cluster 1 6 46.1 0 0 0 0 Cluster 2 2 15.4 6 75 10 83.3 Cluster 3 5 38.5 2 25 2 16.7
Distance between centers
M1 Cluster 1 — 5.101 2.728 Cluster 2 5.101 — 3.091 Cluster 3 2.728 3.091 — M2 Cluster 1 — 5.076 3.330 Cluster 2 5.076 — 3.308 Cluster 3 3.330 3.308 — M3 Cluster 1 — 5.870 4.474 Cluster 2 5.870 — 1.851 Cluster 3 4.474 1.851 —
Practical Implications
The technique presented here is an important step to identify, clas-sify, and follow up young athletes. This technique allows assess-ment of changes in performance over time and evaluating how the assessment can be related to changes in the partial contribution of the determinant factors, or at least a set of factors. We showcase this procedure with young swimmers, although it can be applied across several sports, ages, and competitive levels (ie, including adult and elite athletes).
Performance, particularly in competitive swimming, is a multidimensional phenomenon characterized by a highly complex interplay between several variables. We were able to successfully classify young swimmers based on anthropometrics, kinematics, hydrodynamics, and efficiency. It was also possible to determine if their performance depended more on intrinsic (ie, anthropometrics and biological development) or extrinsic (ie, technique enhance-ment and training) factors. However, we found that the main fac-tors explaining performance change over time. Hence, the main determinant factors, or set of factors, explaining the performance at any given moment might not hold for the preceding or following moment. By adopting this procedure, coaches and sports analysts will also gain insight on the possible drop rate or at least the likeli-hood of changes in cluster membership over time. This technique enables sports practitioners to design customized training sessions for each group. Another potential use for this method is to clas-sify swimmers who are more likely to be responsive to training or intervention programs. Therefore, one might check if they are more likely to keep progressing their performance after the growth and maturation period or not. This same procedure can be selected in the near future for talent identification.
Conclusion
Cluster stability is a feasible, comprehensive, and informative method to gain insight into young swimmers’ changes over time. They can be classified into different clusters, based on their performance and determinant factors. Overall, over the course of the season, we found that stability was moderate and that the con-tribution of each performance determinant factor, or set of factors, may change over time.
Acknowledgments
Jorge E. Morais would like to acknowledge the Portuguese Science and Technology Foundation (FCT) for the PhD scholarship (SFRH/ BD/76287/2011).
References
1. Morais JE, Saavedra JM, Costa MJ, Silva AJ, Marinho DA, Barbosa TM. Tracking young talented swimmers: follow-up of performance and its biomechanical determinant factors. Acta Bioeng Biomech. 2013;15:129–138. PubMed
2. Lätt E, Jürimäe J, Haljaste K, Cicchella A, Purge P, Jürimäe T. Longi-tudinal development of physical and performance parameters during biological maturation of young male swimmers. Percept Mot Skills. 2009;108:297–307. PubMeddoi:10.2466/pms.108.1.297-307
3. Liu Y-T, Mayer-Kress G, Newell KM. Qualitative and quantitative change in the dynamics of motor learning. J Exp Psychol Hum Percept Perform. 2006;32:380–393. PubMed
4. Morais JE, Jesus S, Lopes V, et al. Linking selected kinematic, anthro-pometric and hydrodynamic variables to young swimmer performance. Pediatr Exerc Sci. 2012;24:649–664. PubMed
5. Barbosa TM, Costa M, Marinho DA, Coelho J, Moreira M, Silva AJ.
Modeling the links between young swimmers’ performance: energetic and biomechanical profiles. Pediatr Exerc Sci. 2010;22:379–391.
PubMed
6. Hopkins WG, Hewson DJ. Variability of competitive performance of distance runners. Med Sci Sports Exerc. 2001;33:1588–1592. PubMed doi:10.1097/00005768-200109000-00023
7. Costa MJ, Marinho DA, Bragada JA, Silva AJ, Barbosa TM. Stability of elite freestyle performance from childhood to adulthood. J Sports Sci. 2011;29:1183–1189. PubMeddoi:10.1080/02640414.2011.587 196
8. Phillips E, Davids K, Renshaw I, Portus M. Expert performance in sport and the dynamics of talent development. Sports Med. 2010;40:271–283. PubMeddoi:10.2165/11319430-000000000-00000
9. Komar J, Sanders RH, Chollet D, Seifert L. Do qualitative changes in inter-limb coordination lead to effectiveness of aquatic locomotion rather than efficiency? J Appl Biomech. 2014;30(2):189–196. PubMed
10. Durand-Bush N, Salmela J. The development and mainte-nance of expert athletic performance: perceptions of world and Olympic champions. J Appl Sport Psychol. 2002;14:154–171.
doi:10.1080/10413200290103473
11. Seifert L, Komar J, Crettenand F, Dadashi F, Aminian K, Millet GP. Inter-limb coordination and energy cost in swimming. J Sci Med Sport. 2014;17(4):439–444. PubMed doi:10.1016/j.jsams.2013.07.003 12. Barbosa TM, Bragada JA, Reis VM, Marinho DA, Carvalho C, Silva
AJ. Energetics and biomechanics as determining factors of swim-ming performance: updating the state of the art. J Sci Med Sport. 2010a;13:262–269. PubMeddoi:10.1016/j.jsams.2009.01.003
13. Seifert L, Chollet D. Modelling spatial-temporal and coordinative parameters in swimming. J Sci Med Sport. 2009;12:495–499. PubMed doi:10.1016/j.jsams.2008.03.002
14. Rein R, Button C, Davids K, Summers J. Cluster analysis of move-ment patterns in multiarticular actions: a tutorial. Motor Control. 2010;14:211–239.
15. Handl J, Knowles J, Kell DB. Computational cluster validation in post-genomic data analysis. Bioinformatics. 2005;21:3201–3212.
PubMeddoi:10.1093/bioinformatics/bti517
16. Chow JY, Davids K, Button C, Rein R. Dynamics of movement pat-terning in learning a discrete multiarticular action. Motor Control. 2008;12:219–240. PubMed
17. Clatworthy J, Buick D, Hankins M, Weinman J, Horne R. The use and reporting of cluster analysis in health psychology: a review. Br J Health Psychol. 2005;10:329–358. PubMeddoi:10.1348/135910705X25697
18. Bideault G, Herault R, Seifert L. Data modeling reveals inter-individual variability of front crawl swimming. J Sci Med Sport. 2013;16:281–285. PubMeddoi:10.1016/j.jsams.2012.08.001
19. Vantorre J, Seifert L, Fernandes RJ, Boas JP, Chollet D. Kinematical profiling of the front crawl start. Int J Sports Med. 2010;31:16–21.
PubMeddoi:10.1055/s-0029-1241208
20. Chen I, Chen MY, Jin C, Yan H. Large-scale cluster analysis of elite male and female swimmers’ race pattern. Int J Sports Sci Eng. 2008;2:123–128.
21. Northstone K, Smith AD, Newby PK, Emmett PM. Longitudinal comparisons of dietary patterns derived by cluster analysis in 7-to 13-year-old children. Br J Nutr. 2013;109(11):2050–2058. PubMed
22. Neiva HP, Marques MC, Fernandes RJ, Viana JL, Barbosa TM, Marinho DA. Does warm-up have a beneficial effect on 100-m free-style? Int J Sports Physiol Perform. 2014;9:145–150. PubMedhttp:// dx.doi.org/10.1123/IJSPP.2012-0345
23. Barbosa TM, Morouço PG, Jesus S, et al. The interaction between intra-cyclic variation of the velocity and mean swimming velocity in young competitive swimmers. Int J Sports Med. 2013;34:123–130.
PubMed
24. Craig AB, Pendergast D. Relationships of stroke rate, distance per stroke and velocity in competitive swimming. Med Sci Sports. 1979;11:278–283. PubMed
25. Kolmogorov SV, Duplisheva O. Active drag, useful mechani-cal power output and hydrodynamic force in different swimming strokes at maximal velocity. J Biomech. 1992;25:311–318. PubMed doi:10.1016/0021-9290(92)90028-Y
26. Marinho DA, Barbosa TM, Costa MJ, et al. Can 8 weeks of training affect active drag in young swimmers? J Sports Sci Med. 2010;9:71– 78. PubMed
27. Morais JE, Costa MJ, Mejias EJ, Marinho DA, Silva AJ, Barbosa TM. Morphometric study for estimation and validation of trunk transverse surface area to assess human drag force on water. J Hum Kinet. 2011;28:5–13. PubMeddoi:10.2478/v10078-011-0017-x
28. Costill DL, Kovaleski J, Porter D, Kirwan R, Fielding R, King D. Energy expenditure during front crawl swimming: predicting success
in middle-distance events. Int J Sports Med. 1985;6:266–270. PubMed doi:10.1055/s-2008-1025849
29. Zamparo P, Pendergast DR, Mollendorf J, Termin A, Minetti AE. An energy balance of front crawl. Eur J Appl Physiol. 2005;94:134–144.
PubMeddoi:10.1007/s00421-004-1281-4
30. Zamparo P. Effects of age and gender on the propelling efficiency of the arm stroke. Eur J Appl Physiol. 2006;97:52–58. PubMeddoi:10.1007/ s00421-006-0133-9
31. Ferguson CJ. An effect size primer: a guide for clinicians and research-ers. Prof Psychol Res Pr. 2009;40:532–538. doi:10.1037/a0015808
32. Milligan GW. A review of Monte Carlo tests of cluster analy-sis. Multivariate Behav Res. 1981;16:379–407. doi:10.1207/ s15327906mbr1603_7
33. Seifert L, Leblanc H, Herault R, Komar J, Button C, Chollet D. Inter-individual variability in the upper-lower limb breaststroke coor-dination. Hum Mov Sci. 2011;30:550–565. PubMeddoi:10.1016/j. humov.2010.12.003
34. Rein R. Measurement methods to analyze changes in coordination during motor learning from a non-linear perspective. Open Sports Sci J. 2012;5:36–48. doi:10.2174/1875399X01205010036