Submitted to Different Feeding Schedules
Valdir Silveira de Avila Embrapa Suínos e Aves BR 153 Km 110, Caixa Postal 21 Concórdia, SC
89.700-000
Phone: (0xx49) 442-8555 Fax: (0xx49) 442-8559
E-mail: [email protected] Mail Address
Keywords
Broiler breeders, economic evaluation, feeding time, performance.
Avila VS de1*
Penz Jr.AM2
Brum PAR de3 *
Rosa PS4
Guidoni AL5
Figueiredo ÉAP de6 *
1Embrapa Suínos e Aves Eng. Agr., DSc.
2Universidade Federal do Rio Grande do Sul
-Eng. Agr., PhD. - [email protected]
3Embrapa Suínos e Aves Méd. Vet., DSc.
4Embrapa Suínos e Aves Zootec., MSc.
5Embrapa Suínos e Aves Eng. Agr., DSc.
6Embrapa Suínos e Aves Zootec., PhD.
* Scholarship granted by CNPq.
Author(s)
Arrived:november/02 Approved: july/02
ABSTRACT
The performance of Arbor Acres broiler breeders (1,296 females; 144 roosters) was evaluated when submitted to the following treatments (T): T1 = feeding at 6:30 a.m. (control); T2 = 50% feeding at 6:30 a.m. and 50% at 3:30 p.m. (dual feeding); T3 = feeding at 11:00 a.m.; and T4 = feeding at 3:30 p.m. Treatments were randomly distributed in 48 pens. There were 27 females and 3 males in each pen and 12 repetitions per treatment. Nutrition and management were as recommended for the commercial strain. It was evaluated age at first egg (AFE), total egg production (TEP), number of days with production above 80% (DAP80), laying peak (P), female mortality (MOR), and gross profit margin (GM) per hen. Data were submitted to analysis of variance and means were compared by Students t-Test. TEP of T1 (186.3±2.3) and T2 (186.5±1.5)
were higher (p<0.05) than that of other treatments. TEP of T3 (177.2±2) was the smallest (p<0.05), probably due to the less significant values of DAP80 (18.9±6.0 days) and P (81.36±0.95%). AFE was earlier (p<0.05) in T2 birds. Mortality was similar (p>0.10) among treatments. GM per hen was better (p<0.05) in T1 and T2 hens. Control and dual treatments were more efficient than other treatments. It was concluded that it is possible to change conventional feeding managements by the dual feeding system.
INTRODUCTION
Differences in diet composition and in temperature might adversely affect egg production of broiler breeder hens (Robbins et al., 1988).
Kohne et al. (1973, reported that feeding time should be considered at
high environmental temperature due to the caloric increment produced by exothermic reactions of nutritional metabolism. Heat increment was higher 5 h after feeding in birds fed at 6:00 am than in birds fed at 2:00 pm when indoor temperature increased (Wilson et al., 1989).
Usually, female broiler breeders are fed once a day, in the morning. Cave (1981) and Bootwalla et al. (1983) questioned if nutrient
requirements are fulfilled in this feeding system. Therefore, Cave (1981) evaluated broiler breeder hens from 24 to 63 weeks of age submitted to different feeding schedules and no differences were seen for egg production. On the other hand, more frequent feeding decreased weight gain and increased egg mass, indicating that this strategy enhanced nutrient availability for egg production and regulated excessive body tissue deposition. Hens selected for medium and light body weight showed an increase in egg weight and production when meal was offered in the afternoon (Balnave, 1977). However, feeding time had no effect on egg production and weight (Brake, 1998).
work aimed to evaluate the effect of time of feeding on the performance of female broiler breeder during the period of egg production.
MATERIAL AND METHODS
A total of 1,296 Arbor Acres hens were mated with 144 roosters. Birds were raised until 18 weeks of age in a commercial poultry company according to the management techniques recommended by Sadia (1993). Then, they were transferred to an experimental poultry house at Embrapa Suínos e Aves. Twenty-seven hens and 3 males were allocated per pen. Between 19 and 20 weeks of age (pre-experiment period), birds were fed at 12:00 am in order to standardize feeding. Four treatments were tested: T1=100% feeding at 6:30 am; T2= 50% feeding at 6:30 am and 50% at 3:30 pm; T3=100% feeding at 11:00 am and T4=100% feeding at 3:30 pm. Each treatment had 12 repetitions allocated in a completely randomized design. From the 20th to the 24th week of age, birds were adapted to the
different treatments; performance was evaluated from the 25th to the 66th week of age.
Throughout breeding, all treatments were given similar management and amount of feed (g.bird-1.
day-1). In order to reduce the stress that occurs just
before daily feeding, feeders were controlled by a mechanic system and were filled with pellet and mashed feed one day before the meal was offered. Feed amounts were adjusted based on female body weight and egg production and on male body weight. Birds were weighed at every two weeks. For both sexes, the reference weight was the mean weight of birds from four pens of each treatment.
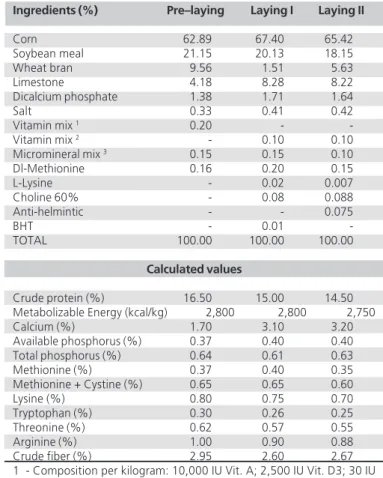
Diets were formulated according to the nutritional requirements of Arbor Acres guide, according to Sadia (1993). Percentage composition of experimental diets in the pre-laying (18 to 23 weeks of age), laying I (24 to 47 weeks of age) and laying II (48 to 66 weeks of age) phases are shown in Table 1.
In order to avoid litter wetting, water was offered from 6:30 a.m. to 9:00 a.m.; from 11:00 a.m. to 1:30 a.m. and from 3:30 p.m. to 6:00 p.m. Beak trimming was performed during rearing and light schedule was performed according to Sadia (1993).
Eggs were counted daily in each pen and average percentage of total egg production per hen per day (EPP) was obtained from 25 to 66 weeks of age. This variable was analyzed using GLM (SAS, 1996) according to the following model: yijk = m + ti + eij + sk + tsik + eijk. Where: i=1,..,4 treatments; j=1,...,12 pens; k=1,..., k
weeks of evaluation; and yijk is the mean value of the ith
response from jth pen within the kth week; m is the mean
value observed in the experiment; ti is the ith treatment
effect; eij is the experimental error according to a normal distribution with mean zero and constant of variance s2; s
k is the effect of the k
th week; ts
ik is the interaction
effect between the ith treatment and the kth week; e ijk is
the error of weekly evaluation considering a normal distribution. Experimental error eij was used to test the week (W) effect and the interaction between treatment and week. Treatment averages were compared by Students t-test.
Table 1 Diet composition and metabolizable energy of pre laying (19-20 week), laying I (20-24 week) and laying II (25-66 week) hens.
Ingredients (%) Prelaying Laying I Laying II
Corn 62.89 67.40 65.42 Soybean meal 21.15 20.13 18.15 Wheat bran 9.56 1.51 5.63 Limestone 4.18 8.28 8.22 Dicalcium phosphate 1.38 1.71 1.64
Salt 0.33 0.41 0.42
Vitamin mix 1 0.20 -
-Vitamin mix 2 - 0.10 0.10
Micromineral mix 3 0.15 0.15 0.10
Dl-Methionine 0.16 0.20 0.15 L-Lysine - 0.02 0.007 Choline 60% - 0.08 0.088 Anti-helmintic - - 0.075
BHT - 0.01
-TOTAL 100.00 100.00 100.00
Calculated values
Crude protein (%) 16.50 15.00 14.50 Metabolizable Energy (kcal/kg) 2,800 2,800 2,750 Calcium (%) 1.70 3.10 3.20 Available phosphorus (%) 0.37 0.40 0.40 Total phosphorus (%) 0.64 0.61 0.63 Methionine (%) 0.37 0.40 0.35 Methionine + Cystine (%) 0.65 0.65 0.60 Lysine (%) 0.80 0.75 0.70 Tryptophan (%) 0.30 0.26 0.25 Threonine (%) 0.62 0.57 0.55 Arginine (%) 1.00 0.90 0.88 Crude fiber (%) 2.95 2.60 2.67 1 - Composition per kilogram: 10,000 IU Vit. A; 2,500 IU Vit. D3; 30 IU Vit. E; 2.5 mg Vit. K3; 2.5 mg Vit.B1; 8 mg Vit. B2; 4 mg Vit. B6; 0.015 mg Vit B12; 45 mg Nicotinic acid; 15 mg Panthotenic acid; 1,400 mg Choline; 0.20 mg Biotin; 1.5 mg Folic acid; 200 mg B.H.T. 2 - Composition per kilogram: 12,000 IU Vit. A; 3,600 IU Vit. D3; 35 IU Vit. E; 3 mg Vit. K3; 2.5 mg Vit.B1; 8 mg Vit. B2; 5 mg Vit. B6; 0.020 mg Vit B12; 40mg Nicotinic acid; 12 mg Panthotenic acid; 0.20 mg Biotin; 1.5 mg Folic acid. 3 -Composition per kilogram: 70 mg Manganese; 75 mg Zinc; 40 mg Iron; 8 mg Copper; 0.5 mg Iodine; 0.13 mg Selenium; 600 mg TM100; 250 mg coccidiostatic.
model, considering age at production peak (XP), production at peak (P), production decrease per week after peak (S) and period from onset to peak of production (Tp).
Total egg production (TEP), age at first egg (AFE), age at different percentages of production: 50% (AG50), 60% (AG60), 70% (AG70) and 80% (AG80) and days with production percentage equal or above 80% (DAP80) were estimated through estimated production equations. Hen mortality (MOR) was calculated for the whole production period (25 to 66 weeks of age).
The eggs were classified according to weight (lighter than 46 g and heavier than 85 g) in non-hatchable (NHA) and hatchable (HA). The percentage of hen mortality (MOR), hen cost (R$28.00) and egg sale cost (R$0.15, 0.16, 0.17,0.18, 0.19 and 0.20) were used to calculate the gross profit margin (GM) per hen and treatment using the following formula:
Where:
GM = Gross profit margin per hen; NE = Number of available eggs; PEi = percentage of eggs; i = 1Þ Non-hatchable eggs and i = 2 Þ hatchable eggs;
P1= price of non-hatchable eggs = 0.25*P2; P2 = price of hatchable eggs;
CM = Cost of hen (buying and rearing); MOR = Percentage of hen mortality.
MOR, GM, parameters of the production curve (XP, P, S and Tp) and production traits (TEP, AFE, AG50, AG60, AG70, AG80 and DAP80) were used to compare treatments by GLM (SAS,1996) according to the ANOVA model: yij = m + ti + eij; where: i=1, ,4 treatments; j=1,...,12 pens; yij is the value of the ith
parameter within the jth pen; m is the overall mean
of the parameter in the experiment; ti is the effect of the ith treatment; e
ij is the experimental error
according to a normal distribution with mean zero and constant of variance s2. Means of treatments were
compared by Students t-test.
RESULTS AND DISCUSSION
Average percentage of egg production per hen per day throughout the production period is shown in
) 100 MOR (1
C P PE NE GM
2
1 i
i i
∑
=
− − ×
= 100
20 30 40 50 60 70 80 90
2
5 27 29 31 33 35 37 39 41 43 54 47 49 51 53 55 57 59 61 63 65
Age (weeks)
P
ro
d
u
ct
io
n
(
%
)
T1 = 6:30 am
T2 = 6:30 am and 3:30 pm
T3 = 11:00 am
T4 = 3:30 pm
Figure 1. PPE and MOR are shown in Table 2, as well as the means for the parameters (XP, P, S and Tp) estimated using the production equation for each treatment. Egg production was different among ages and treatments and there was a significant interaction (p<0.01) between the sources of variation. However, T3 and T4 production curves were slightly below the curves of other treatments (Figure 1), that might explain the better results of T1 and T2 for PPE (Table 2) and TEP (Table 3).
Figure 1 - Percentage of egg production.hen-1.day-1 in laying hen breeders submitted to different feeding schedules (from 25 to 66 weeks).
Table 2 - Egg production (PPE), mortality (MOR), age at production peak (XP), production at the peak (P), decrease after production peak (S), period from onset to peak production (Tp), and coefficient of determination (R2). Results expressed as means±SD.
Variables T11 T2 T3 T4
PPE (%) 65.00±0.80a2 65.20±0.80a 62.40±0.80b 64.40±0.80ab
MOR (%)3 4.01a 2.16a 4.62a 3.70a
XP (weeks) 32.04±0.15b 32.07±0.25b 32.40±0.12b 33.08±0.21a P (%) 85.09±0.84a 84.92±0.74a 81.36±0.95b 83.60±0.91ab S (%.weeks-1) 0.89±0.03a 0.92±0.03a 0.87±0.06a 0.86±0.03a
Tp (weeks) 6.65±0.23a 7.30±0.36a 7.03±0.26a 7.33±0.36a R2 (%) 94.8 95.5 94.5 95.7
1 - T1 100% feeding at 6:30 am; T2 50% feeding at 6:30 am and 50% feeding at 3:30 pm; T3 100% feeding at 11:00 am and T4 100% feeding at 3:30 pm.2 - For each independent variable, means followed by different letters within line are significantly different (p < 0.05). 3 - For mortality, means followed by different letters within a line are significantly different (p < 0.01).
recommended by the strain guide or ad libitum, or an
association of both (Robbins et al., 1988). However,
mortality was high in a group of hens fed with low or high protein levels (Cave, 1981), but a non-significant mortality was found in the control group from 24 to 63 weeks of age, which was fed protein levels similar to those of the present experiment.
Only XP and P were different (p<0.05) among treatments. For XP, hens of T4 reached production peak at 33 weeks of age while hens from other treatments were earlier and reached the production peak at 32 weeks of age. P was low in T3, intermediate in T4 and high in T1 and T2. This result explained differences in PPE and TEP among treatments.
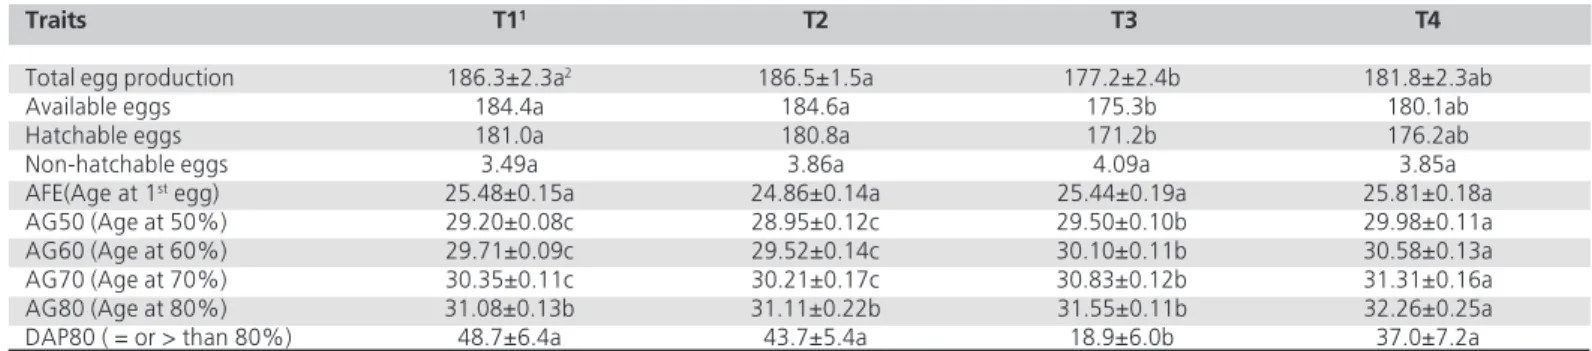
PPE, SOE, HA, NHA, AFE, AG50, AG60, AG70, AG80 and DAP80 of each treatment are shown in Table 3. All variables, except NHA, were different (p<0.05) among feeding times. Similar production results was reported by Harms (1991). Changes in feeding time affected egg production because it was observed that hens fed at the end of the day had smaller egg production. On the other hand, our findings are different from the results reported by Cave (1981), Bootwalla et al. (1983), Brake (1988) and Samara et al. (1996), who reported that different feeding times
had no effect on egg production.
Hens of T1 and T2 showed higher egg production (TEP, SOE, HA), whereas birds fed at 11:00 am. (T3) had lower production results when compared to the other treatments. We can speculate that this result could be due to heat stress condition caused by the increase in ambient temperature, which occurred at the same time of the caloric increment (metabolic heat production during nutritional metabolism), i.e., at approximately 5 to 6 hours after feed intake. Other
consequences were decrease (p<0.05) of the period in which production was above 80%, delay of sexual maturity and impairment of other production parameters. Similarly, Harms (1984) has reported previously that hens with adequate weight gain reached sexual maturity and egg production equal or higher than 80% earlier than those with inadequate weight. AFE was earlier in T2, and AG was at least similar to hens of other treatments at the different ages (AG50, AG60, AG70, AG80), probably because dual feeding enhanced nutritional efficiency and requirements for maintenance and egg production were fulfilled. This fact agrees with results reported by Robbins et al.
(1988) and Katanbaf et al. (1989). They observed
that sexual maturity was 14 and 60 days earlier, respectively, and that hens fed ad libitum had improved
body growth and egg formation when compared to restricted birds.
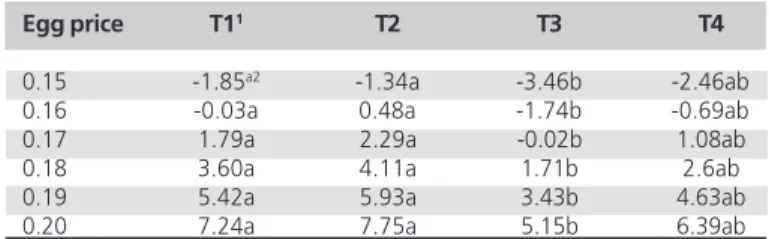
Treatments were different (p<0.05) in relation to gross profit margin (Table 4). In T2, gross profit margin was positive when an egg selling price of R$ 0.16 was considered. There were no differences between T1 and T2, which where more efficient than T3 and T4 due to differences in hen mortality and in the production of eggs (available, not hatchable and hatchable). Such results showed that traditional and dual feeding systems were superior to the other feeding schedules.
CONCLUSION
It was concluded that feeding birds twice a day (6:30 a.m. and 3:30 p.m.) might be an alternative to the traditional system, in which feeding is given once a day (6:30 a.m.). Besides, dual feeding might be easily adopted in the general farm management.
Table 3 - Total egg production (TEP), sound eggs (SOE), hatchable eggs (HA), non-hatchable eggs (NHA), age in weeks at different percentages of egg production (AG) and number of days with production equal or higher than 80% (DAP80), evaluated in broiler breeder hens from 25 to 66 weeks of age.
Traits T11 T2 T3 T4
Total egg production 186.3±2.3a2 186.5±1.5a 177.2±2.4b 181.8±2.3ab
Available eggs 184.4a 184.6a 175.3b 180.1ab
Hatchable eggs 181.0a 180.8a 171.2b 176.2ab
Non-hatchable eggs 3.49a 3.86a 4.09a 3.85a
AFE(Age at 1st egg) 25.48±0.15a 24.86±0.14a 25.44±0.19a 25.81±0.18a
SAS Institute. Statistical analysis system. User Guide. SAS Institute Inc. Cary, NC. 1998.
Sadia,1993. Agropastoril Catarinense Ltda. Manual Arbor Acres. Faxinal dos Guedes,SC. 26p.
Wilson HR, Mather FB, Brigmon RL, Besch EL, Dugan VP, Boulos NZ. Feeding time and temperature interactions in broiler breeders. Poultry Science 1989; 68:608-616.
Table 4 - Gross profit margin of different feeding time according to egg price ranges. Values expressed as Reals (R$).
Egg price T11 T2 T3 T4
0.15 -1.85a2 -1.34a -3.46b -2.46ab
0.16 -0.03a 0.48a -1.74b -0.69ab 0.17 1.79a 2.29a -0.02b 1.08ab 0.18 3.60a 4.11a 1.71b 2.6ab 0.19 5.42a 5.93a 3.43b 4.63ab 0.20 7.24a 7.75a 5.15b 6.39ab 1 - T1 100% feeding at 6:30 am; T2 50% feeding at 6:30 am and 50% feeding at 3:30 pm; T3 100% feeding at 11:00 am and T4 100% feeding at 3:30 pm. 2 - For each independent variable, means followed by different letters within line are significantly different (p < 0.05).
REFERENCES
Balnave D. Clinical symptoms of biotin deficient animals. American Journal of Clinical Nutrition 1877; 30:1408-1413.
Bootwalla SM, Wilson HR, Harms R H. Performance of broiler breeders on different feeding systems. Poultry Science 1983; 62:2321-2325.
Brake J. Relationship of time and strain to egg shell quality and hatchability in broiler breeders. Poultry Science 1998; 67:538-543.
Cave NA. Effect of diurnal programs of nutrient intake on performance of broiler breeder hens. Poultry Science 1981; 60: 1287-1292.
Fialho FB, Ledur MC. Segmented polynomial model for estimation of egg production curves in laying hens. British Poultry Science 1997; 38:66-73.
Harms RH. The influence of feeding program on peak production and avoiding sudden declines in production with broiler breeder. Poultry Science 1984; 63:1667-1668.
Harms RH. The influence of changing time of feeding on performance of broiler breeder hens.Poultry Science 1991; 70: 1695-1698.
Katanbaf MN, Dunnington EA, Siegel PB. Restricted feeding in early and late-feathering chickens. Reproductive responses.Poultry Science 1989; 68:352-358.
Kohne HJ, Boone MA, Jones E. The effect of feed consumption on the survival time of adult turkey hens under conditions of acute thermal strees. Poultry Sicence 1973; 52:1780-1783.
Robbins KR, Chin SF, McGhee GC, Roberson KD. Effects of ad libitum versus restricted feeding on body composition and egg production of broiler breeders. Poultry Science 1988; 67:1001-1007.