Received 10 Feb., 2014 Accepted 16 Mar., 2014 (006289)
1Food Science Department, Federal University of Rio Grande do Sul – UFRGS, Porto Alegre, RS, Brazil, e-mail: [email protected] 2Food Technology Department, Federal University of Rio Grande do Sul – UFRGS, Porto Alegre, RS, Brazil
*Corresponding author
Orange fiber as a novel fat replacer in lemon ice cream
Tainara de Moraes CRIZEL1, Rubilene Ramos de ARAUJO1, Alessandro de Oliveira RIOS1, Rosane RECH2, Simone Hickmann FLÔRES1*
1 Introduction
Consumers have become increasingly interested in low-fat products since they associate them with a reduced incidence of coronary heart diseases and obesity (Akalin et al., 2008). This behavior has incited the development of “healthier” products. Such products must possess at least one of the following characteristics: a modified composition to prevent or limit the presence of potentially harmful compounds, such as fat, and/or the possibility of including certain substances, such as fibers, with subsequent added health benefits (Jimenez-Colmenero et al., 2001).
The development of new food products remains challenging, as it must fulfill the consumers’ demand for products that are simultaneously delicious and healthy (Cruz et al., 2009). The dairy industry has developed a variety of low-fat and fat-free ice cream products trying to avoid modifications that could change the taste or texture, which are key factors for an ice cream to be successful in the market (Cadena & Bolini, 2011).
Ice cream is a complex colloidal frozen system that is composed of partially coalesced fat droplets, air cells, ice crystals, and a continuous aqueous phase, in which the polysaccharides, proteins, lactose, and mineral salts are dispersed (Marshall et al., 2003). Conventional ice cream formulations possess a high fat content, at approximately 10 to 16 %, which can be replaced with carbohydrates or proteins (Adapa et al., 2000).
Low-fat and high-fiber foods can help reduce the risk of cardiovascular diseases, obesity, colon cancer, and other disorders (Mansour & Khalil, 1997). Dietetic fibers have been used in products as potential fat replacers (Mendoza et al., 2001). The carbohydrate-based fat replacers rely on their ability to form gels, to increase viscosity, to provide texture and mouthfeel, and to increase water-holding capacity (Voragen, 1998).
Orange juice extraction by-products represent a potential source of dietary fiber. This material is rich in bioactive compounds (flavonoids, vitamin C, carotenoids and phenolic compounds) with antioxidant properties, which may provide additional health-promoting effects (Marín et al., 2007).
The aim of this study was to develop a reduced-fat lemon ice cream using different fibers obtained from by-products of the orange juice industry as fat replacers. The physical, chemical, and sensory properties of the ice creams were evaluated.
2 Materials and methods
2.1 Orange fiber
The orange fibers were produced with by-products of orange juice production. These by-products had been manually separated into two groups: the peel, pulp (flavedo and albedo), and seeds (F1); and the peel alone (F2). The raw material was provided by the “Pure Juice” company, located in Porto Alegre (RS/Brazil).
These orange by-product samples were processed to obtain fiber, according to the methodology described by Crizel et al. (2013).
Pretreatment by hydro-distillation
The orange by-products were pretreated by hydro-distillation using a Clevenger apparatus to extract the essential oils to reduce the levels of compounds responsible for the bitterness of the orange bagasse and peel.
Abstract
Orange fiber was used as a novel fat replacer in light lemon ice cream. Nine ice cream formulations were compared: standard control ice cream (IC); ice cream with fiber (F1) from the peel, bagasse, and orange seed (ICA and ICB); ice cream with fiber (F2) from the orange peel alone (ICC and ICD); ice cream with fiber (F3) from the peel, bagasse, and orange seed pretreated with hydro-distillation (ICE and ICF); and ice cream with fiber (F4) from the orange peel pretreated with hydro-distillation (ICG and ICH).The orange fiber reduced the ice cream fat content (50 %) and the overrun ratio and increased the fiber content and the hardness, gumminess, and springiness values, but it did not affect the adhesiveness and odor of the samples. The samples with 1.0 % of orange fiber showed low melting rate values than those of the control ice cream. The overall acceptance of the ice cream with 1.0 % of pre-treated orange peel fiber did not differ from that of the control ice cream (80 %). The orange fiber proved a promising food ingredient since it can be used to decrease the fat content and increase bioactive compounds content, such as fiber and carotenoids.
Keywords: orange fiber; fat replacer; ice cream; pre-treatment; by-products; sensory acceptance.
OI:
2.3 Analysis
Dietary fiber composition
It was determined by the enzyme-gravimetric method (991.43), as described by the AOAC (Association of Official Analytical Chemist, 1990).
Composition
The lipid (the ice cream samples were submitted to acid hydrolysis before lipid analysis) was determined according to the AOAC official method (920.39) (Association of Official Analytical Chemist, 1990). The ice cream fiber content was calculated based on the TDF of the added fibers. All analyses were performed in triplicate. The results were expressed as grams of fiber per 100 grams of moist matter.
Melting rate
The melting rate was determined according to the method described by Prindiville et al. (2000) with some modifications. The ice cream samples were weighed in plastic cups and stored at -18 °C for 2 weeks were evaluated. Pre-weighed ice cream samples (70 g) were carefully removed from the plastic cups and
placed on a wire mesh (1 cm2), and a previously weighed beaker
was placed beneath the mesh to collect the melted ice cream. The system was kept at 24 °C ± 1 °C. After 30 min, the beaker with the melted ice cream was replaced with another one and weighed. This process was repeated at 10-min intervals up to 70 min. The assay was performed in triplicate for all samples. The melting profiles were plotted as the ratio of the weight of drained ice cream to the weight of the original sample versus time. The melting rates were determined based on the angular coefficient of the linear regression of the data of the percentage of melted ice cream as a function of time.
Fresh orange bagasse and peels were thawed at room
temperature, manually cut into 1-cm2 pieces and hydro-distilled,
following the protocol proposed by Ferhat et al. (2006) for 4 h until no more essential oil was obtained. The orange waste was removed from the water and was dried and milled as described in the item (2.1) above.
2.2 Ice cream
The ice creams were produced in the dairy pilot plant at the Federal University of Rio Grande do Sul (Porto Alegre/ RS/Brazil). The ingredients used in the ice cream production (UHT (Ultra High Temperature) skimmed milk, skimmed milk powder, sugar, and cream with a 35 % fat content) were purchased from the local market, and the other ingredients (glucose, dextrose (Glucosoft), a stabilizer (DPO-50), an emulsifier (Emulgel), lemon flavoring acid, and paste (Aromitalia)) were obtained from Vidal Distributor Ltd. Machinery (Porto Alegre/RS/Brazil).
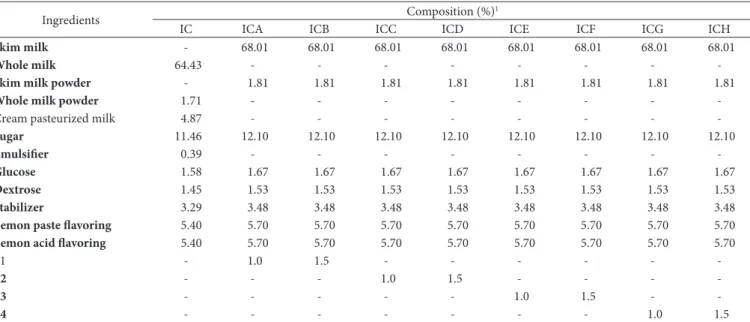
Table 1 summarizes the 9 ice cream formulations developed in this study: a standard control ice cream (IC/5 % fat content); ice cream with fiber (F1) from the peel, bagasse, and orange seed (ICA and ICB); ice cream with fiber (F2) from the orange peel alone (ICC and ICD); ice cream with fiber (F3) from the peel, bagasse, and orange seed pretreated with hydro-distillation (ICE and ICF); and ice cream with fiber (F4) from the orange peel pretreated with hydro-distillation (ICG and ICH).
The dry ingredients were mixed in a plastic container and added to pasteurized skim milk at 40 ºC. The mixture was homogenized, pasteurized, matured, and placed in a an ice cream producer (Nemox, model Gelato chef 2500, Italy) until the desired consistency was achieved; It was then beaten, frozen for one hour, placed in 1-L polypropylene containers, and stored at –18 °C.
Table 1. Formulations of the lemon control ice cream (IC) and the ice cream with orange fiber (ICA, ICB, ICC, ICD, ICE, ICF, ICG, and ICH).
Ingredients Composition (%)
1
IC ICA ICB ICC ICD ICE ICF ICG ICH
Skim milk - 68.01 68.01 68.01 68.01 68.01 68.01 68.01 68.01
Whole milk 64.43 - - -
-Skim milk powder - 1.81 1.81 1.81 1.81 1.81 1.81 1.81 1.81
Whole milk powder 1.71 - - -
-Cream pasteurized milk 4.87 - - -
-Sugar 11.46 12.10 12.10 12.10 12.10 12.10 12.10 12.10 12.10
Emulsifier 0.39 - - -
-Glucose 1.58 1.67 1.67 1.67 1.67 1.67 1.67 1.67 1.67
Dextrose 1.45 1.53 1.53 1.53 1.53 1.53 1.53 1.53 1.53
Stabilizer 3.29 3.48 3.48 3.48 3.48 3.48 3.48 3.48 3.48
Lemon paste flavoring 5.40 5.70 5.70 5.70 5.70 5.70 5.70 5.70 5.70
Lemon acid flavoring 5.40 5.70 5.70 5.70 5.70 5.70 5.70 5.70 5.70
F1 - 1.0 1.5 - - -
-F2 - - - 1.0 1.5 - - -
-F3 - - - 1.0 1.5 -
-F4 - - - 1.0 1.5
1Control ice cream (IC); Ice cream with 1.0 % orange fiber F1 (ICA), F2 (ICC), F3 (ICE) and F4 (ICG); Ice cream with 1.5 % orange fiber F1 (ICB), F2 (ICD), F3 (ICF), and F4 (ICH);
were provided to the judges. Ice cream samples were stored at –18 °C and thawed to –10 °C before analysis. The sensory analysis was performed on different days, and two samples were analyzed daily. The acceptance of the appearance, color, odor, flavor, aftertaste, texture, and overall acceptability were evaluated using a structured 9-point hedonic scale (Meilgaard et al., 2007). The study was approved by the University Ethical Committee (Protocol nº:21912), and the participants were informed of all of the details of the study.
2.4 Statistical analysis
The results were evaluated by analysis of variance (ANOVA) and the Tukey’s test, and the sensory analysis results were also analyzed using Principal Components Analysis (PCA). The statistical analyses were performed using the software Statistica 10.0 at a significance level of 0.05 (STATSOFT Inc.).
3 Results and discussion
3.1 Chemical parameters
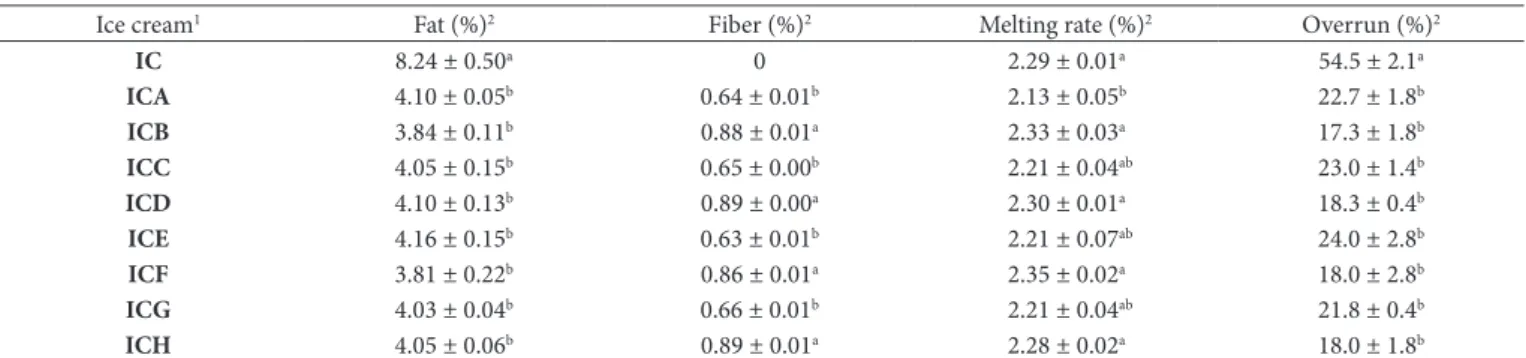
All ice cream samples that were supplemented with orange fiber as a fat replacer had a lower lipid content (Table 2), which differed significantly from the standard ice cream sample. The ice cream samples with added fiber had an average reduction of 51 % in the fat content compared to that of the control ice cream sample. This result was higher than the previously published results of Santos & Silva (2012), who found a fat content
reduction of 41 % in mangaba (Hancornia speciosa Gomez) ice
cream by adding Dairy-Lo (awhey protein concentrate) as a fat
replacer. Akalin et al. (2008) observed that substituting milk fat for inulin in ice cream yielded a fat reduction of 41 %.
The ice cream fiber content was calculated based on the results of the TDF analysis of the F1, F2, F3, and F4 samples considering the solids content in each formulation. All ice cream samples with 1.5 % orange fiber demonstrated significantly
higher TDF results (p ≤ 0.05) when compared to those of
the samples with 1.0 % orange fiber. The TDF results of the ice cream with 1.5 % orange fiber were similar to those of ice cream with granola (0.90 g/100 g) and lower than that of ice cream supplemented with fructooligosaccharide (5.0 g/100 g) (Sales et al., 2008).
Overrun
The overrun was estimated using a standard 100-mL cup according to Equation 1 (Dervisoglu & Yazici, 2006).
−
= ×
( )
100
( )
volume of ice cream volume of mix Overrun
volume of mix (1)
Color
A colorimeter (Minolta, CR400, Japan) was used to determine the color of the ice cream samples using the CIE
L*a*b* color scale. The measurements were expressed by L*
(lightness), +a* (redness), and +b* (yellowness).
Texture profile analysis (TPA)
The texture profile was assessed according to Akalin et al. (2008). The analysis was performed at room temperature (20 ± 1 °C) using a TA.XT plus Texture Analyzer (Stable Micro
System, United Kingdom), using the software Exponent, and
equipped with a 2.0 cm diameter stainless steel cylindrical probe. All analyses were performed in triplicate. The analysis conditions were as follows: penetration distance = 15 mm,
force = 5.0 × g, probe speed during penetration = 3.3 mm/s, and
probe speed pre and post penetration = 3.0 mm/s. The surface of the ice cream that remained in the plastic cup was punctured,; six measurements were recorded for each product.
Hardness was measured as the peak compression force
(g) during probe penetration and adhesiveness as the negative
peak force (g) during probe withdrawal. Cohesiveness measures
how well product withstands a second deformation relative to the first deformation. It was measured as the ratio of the peak area during the second compression to the peak area during the first compression. Springiness was measured by the ratio of the distance of the detected height of the product on the second compression to the original compression distance. Gumminess was the result of multiplication of the values of hardness and cohesiveness.
Sensory analysis
Ice cream acceptability was evaluated using sensory evaluation with 50 untrained potential consumers. Approximately 30 g of each sample coded with a three-digit random number
Table 2. Results of physicochemical properties of the control and orange fiber ice cream samples.
Ice cream1 Fat (%)2 Fiber (%)2 Melting rate (%)2 Overrun (%)2
IC 8.24 ± 0.50a 0 2.29 ± 0.01a 54.5 ± 2.1a
ICA 4.10 ± 0.05b 0.64 ± 0.01b 2.13 ± 0.05b 22.7 ± 1.8b
ICB 3.84 ± 0.11b 0.88 ± 0.01a 2.33 ± 0.03a 17.3 ± 1.8b
ICC 4.05 ± 0.15b 0.65 ± 0.00b 2.21 ± 0.04ab 23.0 ± 1.4b
ICD 4.10 ± 0.13b 0.89 ± 0.00a 2.30 ± 0.01a 18.3 ± 0.4b
ICE 4.16 ± 0.15b 0.63 ± 0.01b 2.21 ± 0.07ab 24.0 ± 2.8b
ICF 3.81 ± 0.22b 0.86 ± 0.01a 2.35 ± 0.02a 18.0 ± 2.8b
ICG 4.03 ± 0.04b 0.66 ± 0.01b 2.21 ± 0.04ab 21.8 ± 0.4b
ICH 4.05 ± 0.06b 0.89 ± 0.01a 2.28 ± 0.02a 18.0 ± 1.8b
1Control ice cream (IC); Ice cream with 1.0 % orange fiber 1 (ICA), 2 (ICC), 3 (ICE) and 4 (ICG); Ice cream with 1.5 % orange fiber 1 (ICB), 2 (ICD), 3 (ICF) and 4 (ICH). 2Mean
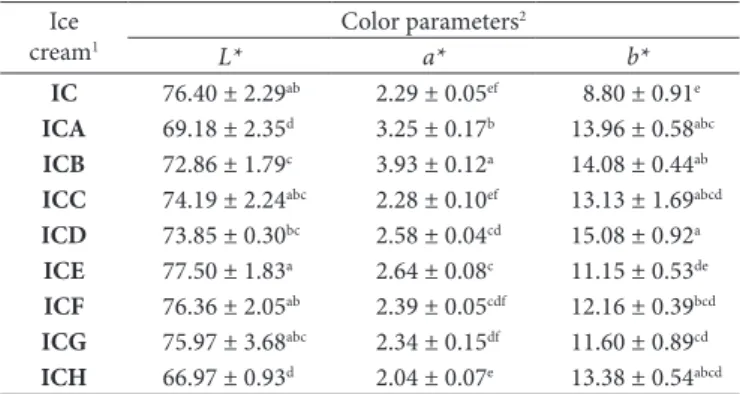
with F1 had more intense red color compared with that of the other ice cream samples. A similar result was achieved with the by-products used in the F1 production, according to Garau et al. (2007), and the fiber obtained from the pulp was darker than that obtained from the peel due to a greater amount of reducing sugar, which could be responsible for the browning. The ICC,
ICF, ICG and, ICH samples were significantly similar (p ≤ 0.05)
to the IC sample regarding the chromatic coordinate a*.
The values of the chromatic coordinate b* ranged between
8.80 and 15.08, values at which the IC had the lowest value. This parameter is related to the yellow-blue component of the chromaticity diagram, in which positive values of this variable are reflected by a yellowish color. The addition of orange fiber
significantly increased the b* coordinate values of the samples,
demonstrating that the addition of fiber results in a yellow ice cream. A similar result was obtained by Dervisoglu & Yazici (2006) for ice cream supplemented with citrus fiber.
Textural properties
Table 4 summarizes the results of hardness, adhesiveness, springiness, cohesiveness, and gumminess analyses. The lowest hardness values were observed in the control ice cream and in
the ice cream samples with p ≤ 1.0 % of fiber, given that the
ICC, ICE, and ICG samples did not significantly differ from
(p ≤ 0.05) the control ice cream. The addition of greater amount
of orange fiber as a fat replacer significantly increased the ice
cream hardness (p ≤ 0.05). The effect of fat content on ice cream
hardness was evaluated by Roland et al. (1999) and Rossa et al. (2012), who demonstrated that the hardness was inversely proportional to the fat content. According to Guinard et al. (1997), an increase in the fat content decreases ice crystal formation and subsequently yields a softer product.
According to Milani and Koocheki (2011) the reduction in fat and the addition of a fat replacer must have changed the characteristics of the fluid surrounding the air cells. The decreased instrumental hardness with increased hydrocolloid content may be attributed to their freeze concentrations in the serum phase.
3.2 Physical parameters
The ice creams containing fat should melt more slowly than the low-fat ice creams because the milk fat slows the rate of heat transfer through the ice creams (Akalin et al., 2008). Rossa et al. (2012) observed that ice creams with 8 g/100 g of fat displayed a higher resistance to melting compared to that of ice creams with 4 to 6 g/100 g of fat. However, the melting properties of the ice cream samples used in the study (Table 2) indicate that the ice creams supplemented with low concentrations of orange fiber (1.0 %) had lower resistance values than that of the control ice
cream, and that there were no significant differences (p ≤ 0.05)
between the ice creams with 1.5 % orange fiber and the control ice cream.
Previous studies demonstrated contrasting effects of a fat replacer on the product melting rate. According to Prindiville et al. (2000), the addition of a fat replacer (Dairy Lo and Simplese) increased the ice cream melting rate. Similar results were observed by Roland et al. (1999) verified that fat free ice cream (0.1 % fat) samples with maltodextrin, milk protein concentrate or polydextrose melted faster than the control ice cream (10 % fat). However, El-Nagar et al. (2002) concluded that increased additions of inulin to yog-ice mixes reduced their melting rates.
Overrun is associated with the amount of air incorporated during the ice cream manufacturing process (Cruz et al., 2009). The ice creams obtained in the present study showed overrun ratios from 17.3 % to 54.5 % (Table 2), and these values are similar to the values established by Goff (2002), in which the gas phase volume varied widely from 10 % to 15 % to values as high as 50 %.
The ice creams supplemented with orange fiber showed
significantly lower overrun values (p ≤ 0.05) compared with
those of the control ice cream, likely due to the reduction in fat and the addition of a fat replacer, as demonstrated in other studies. According to Chang & Hartel (2002), the contents of fat, emulsifier, and stabilizer and the processing conditions (whipping temperature and freezing power) can affect air cell development. Thus, the low overrun values of orange fiber ice creams are likely due to the addition of carbohydrate-based fat replacers since they exhibit a viscous behavior that may decrease its whipping capacity. Similar results were obtained by Adapa et al. (2000), who found that the carbohydrate fat replacer mix had low overrun because of the higher viscous component, which could have prevented air incorporation.
Effect on color parameters
The lightness values (L*) of the ice cream samples ICC, ICE,
ICF, and ICG did not significantly differ from that of the control ice cream (IC), but these samples had significantly higher values than those of the ice cream samples supplemented with orange fiber (ICA, ICB, ICD, and ICH) (Table 3). No correlation was observed between lightness and pretreatment or fiber amount. Roland et al. (1999) found that the ice cream lightness values increased as the fat content increased, which differs from the findings of the present study.
The addition of F1 significantly increased the a* (+) values
of the ICA and ICB samples, which indicates that the ice cream
Table 3. Effect of orange fiber supplementation on the color parameters (L*, a*, and b*) of the lemon ice cream samples.
Ice cream1
Color parameters2
L* a* b*
IC 76.40 ± 2.29ab 2.29 ± 0.05ef 8.80 ± 0.91e
ICA 69.18 ± 2.35d 3.25 ± 0.17b 13.96 ± 0.58abc
ICB 72.86 ± 1.79c 3.93 ± 0.12a 14.08 ± 0.44ab
ICC 74.19 ± 2.24abc 2.28 ± 0.10ef 13.13 ± 1.69abcd
ICD 73.85 ± 0.30bc 2.58 ± 0.04cd 15.08 ± 0.92a
ICE 77.50 ± 1.83a 2.64 ± 0.08c 11.15 ± 0.53de
ICF 76.36 ± 2.05ab 2.39 ± 0.05cdf 12.16 ± 0.39bcd
ICG 75.97 ± 3.68abc 2.34 ± 0.15df 11.60 ± 0.89cd
ICH 66.97 ± 0.93d 2.04 ± 0.07e 13.38 ± 0.54abcd 1Control ice cream (IC); Ice cream with 1.0 % orange fiber F1 (ICA), F2 (ICC), F3
(ICE), and F4 (ICG); Ice cream with 1.5 % orange fiber F1 (ICB), F2 (ICD), F3 (ICF), and F4 (ICH). 2Mean values ± standard deviation of 3 replicates. Mean values followed
control ice cream, but only two samples (ICA and ICB) were
significantly different (p ≤ 0.05). The color and odor attributes
did not significantly differ between the ice creams supplemented
with 10, 20, or 30 g kg−1 fish protein powder and the control ice
cream either (Shaviklo et al., 2011).
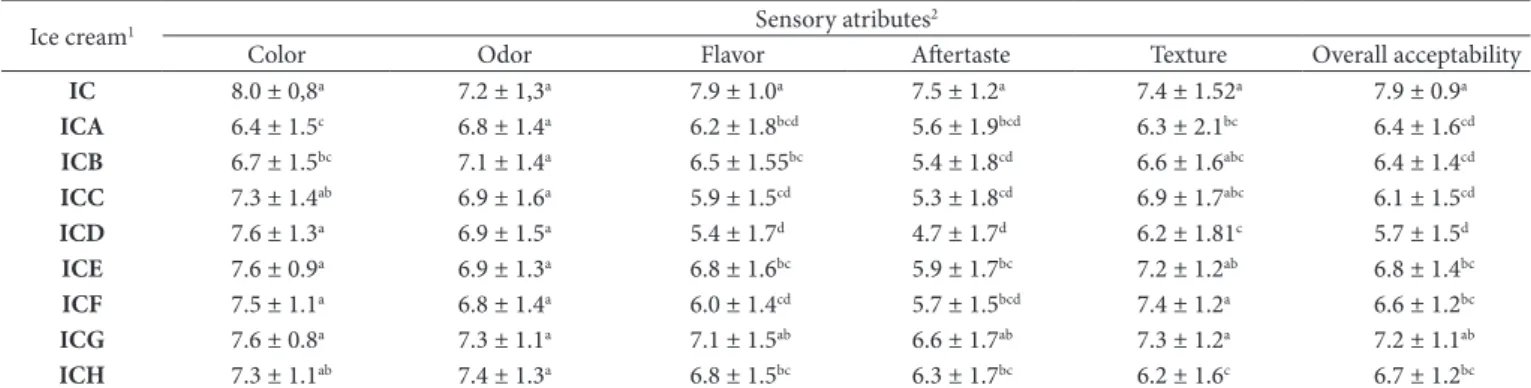
The ice cream flavor and aftertaste scores were negatively affected by fat reduction and addition of orange fiber (Table 5). Fat is a solvent for many flavor compounds and acts as a reservoir by slowly releasing flavor. However, this effect is not replicated by most fat replacers (Li et al., 1997). This effect was also observed in the present study, which is evidenced by the low scores of these attributes. Karaca et al. (2009) found that reduced and low-fat ice creams with carbohydrate-based fat replacers had lower flavor scores than those of the control sample.
The low aftertaste scores observed for the ice cream samples with orange fiber may be related to the fiber bitter taste. Dervisoglu & Yazici (2006) also observed lower flavor, texture, and appearance scores for ice cream supplemented with citrus fiber compared to that of a control sample without fiber.
The ICG was the only sample that did not significantly
differ (p ≤ 0.05) in terms of the attributes flavor and aftertaste
compared to those of the control sample, indicating that the pretreatment of the orange peel fiber was effective in reducing the bitter taste in the ice cream supplemented with 1.0 % fiber. The control ice cream adhesiveness values (Table 4) were not
significantly different (p ≤ 0.05) from those of most fat reduction
ice creams with added orange fiber (ICC, ICD, ICE, ICF, ICG, and ICH). These results are not in agreement with those found by Aime et al. (2001) and Prindiville et al. (1999), who found that low fat ice creams had the lowest adhesiveness values.
The ice creams with 1.5 % orange fiber showed higher springiness values than those of the other samples. However, the ice creams with 1.0 % orange fiber did not significantly differ from the ice cream control. There cohesive values did not differ between the ice creams, indicating that fiber addition does not affect this parameter, which agrees with the results obtained by Hwang et al. (2009).
The control ice cream gumminess values (Table 4) were
significantly lower (p ≤ 0.05) than those of the reduced-fat ice
creams, but different values were obtained by Prindiville et al. (1999), who found lower values for the reduced-fat ice cream (4 %) than those of the ice cream with 9 % fat.
Sensory analysis
The sensory analysis demonstrated that the attribute odor did not differ between the ice cream samples (Table 5). The acceptance mean values of the color attribute of the orange fiber ice creams were lower when compared to those of the
Table 4. Effect of the addition of orange fiber on the ice cream texture profile .
Ice cream1 Texture parameters2
Hardness (g) Adhesiveness (g/s) Springiness3 Cohesiveness3 Gumminess (g)
IC 1569 ± 237e 208 ± 11bc 0.82 ± 0.01c 0.11 ± 0.01a 165 ± 39d
ICA 2402 ± 9d 413 ± 13a 0.85 ± 0.00bc 0.11 ± 0.01a 274 ± 18c
ICB 7294 ± 279ab 348 ± 22a 0.87 ± 0.01ab 0.10 ± 0.00a 386 ± 22a
ICC 1031 ± 75e 135 ± 12c 0.85 ± 0.05bc 0.10 ± 0.02a 268 ± 35c
ICD 6330 ± 256c 173 ± 45bc 0.90 ± 0.01a 0.12 ± 0.01a 308 ± 17bc
ICE 1583 ± 149e 180 ± 18bc 0.83 ± 0.01c 0.10 ± 0.01a 346 ± 40ab
ICF 8057 ± 71a 233 ± 39b 0.91 ± 0.03a 0.12 ± 0.01ª 357 ± 25ab
ICG 1243 ± 60e 170 ± 24bc 0.83 ± 0.02c 0.10 ± 0.00a 333 ± 33b
ICH 7017 ± 684bc 206 ± 30bc 0.91 ± 0.01a 0.12 ± 0.01a 390 ± 9a
1Control ice cream (IC); Ice cream with 1.0 % orange fiber 1 (ICA), 2 (ICC), 3 (ICE) and 4 (ICG); Ice cream with 1.5 % orange fiber 1 (ICB), 2 (ICD), 3 (ICF) and 4 (ICH). 2Mean
values ± standard deviation of 3 replicates. Mean values followed by different uppercase letters in the same column are significantly different by the Tukey’s test (p ≤ 0.05). 3Dimensionless
measures.
Table 5. Acceptance of the sensory attributes of the control and orange fiber ice creams.
Ice cream1 Sensory atributes2
Color Odor Flavor Aftertaste Texture Overall acceptability
IC 8.0 ± 0,8a 7.2 ± 1,3a 7.9 ± 1.0a 7.5 ± 1.2a 7.4 ± 1.52a 7.9 ± 0.9a
ICA 6.4 ± 1.5c 6.8 ± 1.4a 6.2 ± 1.8bcd 5.6 ± 1.9bcd 6.3 ± 2.1bc 6.4 ± 1.6cd
ICB 6.7 ± 1.5bc 7.1 ± 1.4a 6.5 ± 1.55bc 5.4 ± 1.8cd 6.6 ± 1.6abc 6.4 ± 1.4cd
ICC 7.3 ± 1.4ab 6.9 ± 1.6a 5.9 ± 1.5cd 5.3 ± 1.8cd 6.9 ± 1.7abc 6.1 ± 1.5cd
ICD 7.6 ± 1.3a 6.9 ± 1.5a 5.4 ± 1.7d 4.7 ± 1.7d 6.2 ± 1.81c 5.7 ± 1.5d
ICE 7.6 ± 0.9a 6.9 ± 1.3a 6.8 ± 1.6bc 5.9 ± 1.7bc 7.2 ± 1.2ab 6.8 ± 1.4bc
ICF 7.5 ± 1.1a 6.8 ± 1.4a 6.0 ± 1.4cd 5.7 ± 1.5bcd 7.4 ± 1.2a 6.6 ± 1.2bc
ICG 7.6 ± 0.8a 7.3 ± 1.1a 7.1 ± 1.5ab 6.6 ± 1.7ab 7.3 ± 1.2a 7.2 ± 1.1ab
ICH 7.3 ± 1.1ab 7.4 ± 1.3a 6.8 ± 1.5bc 6.3 ± 1.7bc 6.2 ± 1.6c 6.7 ± 1.2bc 1Control ice cream (IC); Ice cream with 1.0 % orange fiber 1 (ICA), 2 (ICC), 3 (ICE) and 4 (ICG); Ice cream with 1.5 % orange fiber 1 (ICB), 2 (ICD), 3 (ICF), and 4 (ICH). 2Mean
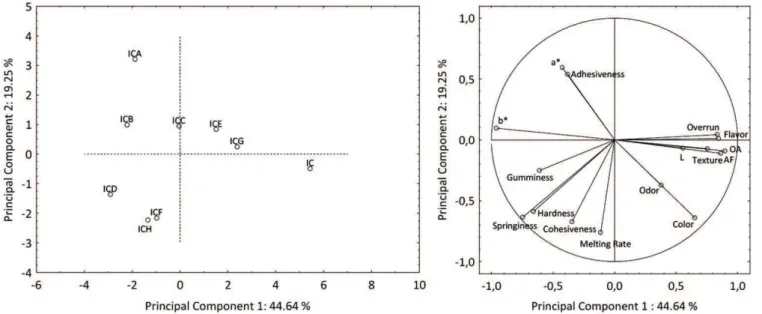
component 2 (PC2) was related to adhesiveness and color
parameters (a* and b*) (Figure 1), and the principal component
4 (PC4) was related to melting rate, hardness, springiness, cohesiveness, and gumminess (Figure 2).
The analysis of the relationship between the PC1 and PC2 (Figure 1) revealed a positive linear correlation between flavor, aftertaste, overall acceptability, and overrun as well as a positive linear correlation between color, texture, odor, and luminosity. These relationships allowed for the discrimination between the ICA, ICB, ICC, ICD, ICF, and ICH samples, which are located in the left side of the figure, whereas the other samples (IC, ICG, and ICE) are located in the right side of the figure. Figure 1 also demonstrates that ICG and ICE are the closest to the control sample (IC) and are, therefore, the most similar with regards to the characteristics analyzed.
PCA allowed the verification of the relationship between the sensory and physicochemical evaluations. The overall acceptance by the judges was higher for the samples with lower hardness and springiness because they are located in opposite quadrants in Figure 1. An opposite relationship was also observed between the color attribute and the instrumental
color parameters (a* and b*), indicating that the samples with
low a* and b* values received high scores for the ice cream color. These results demonstrate that the addition of fiber perceptibly changes the ice cream color.
When the graphs in Figure 1 overlap, the relevant analyses and sensory attributes that are responsible for high acceptability or those that better characterize the sample receptivity are revealed. The IC and ICG samples were distinguished by the highest acceptance scores for all sensory attributes. The ICA and ICB samples had the lowest color and texture scores, most likely because the more intense yellow color characteristic of the fiber 1 (peel, bagasse, and seed) was not submitted to Only tree samples (ICA, ICD, and ICH) showed a significant
difference in texture (p ≤ 0.05) when compared to that of the
control ice cream, indicating that fat reduction and orange fiber addition did not affect the texture of most samples. Similar results were obtained by Karaca et al. (2009), who determined that reduced and low-fat ice cream samples with added fat replacers had texture similar to that of the control. Cadena & Bolini (2011) performed the acceptance test for traditional and light vanilla ice creams and found no significant differences in the acceptance of texture between the samples. The ICG ice cream did not differ significantly from the IC sample in relation to the overall acceptance means values.
Principal component analysis is a statistical technique used to reduce the dimensionality of a dataset containing a large number of inter-related variables. PCA enables the transformation of numerous original variables into new ones, called principal components, given that they are linear combinations of source data. Thus, all of the variables can be reduced because two or three principal components are typically sufficient to explain the majority of the total variability of the original variables (Vainionpää et al., 2004). PCA was used to identify the most important characteristics of each ice cream by analyzing the correlations with the analyzed attributes (Dutcosky, 1996).
In this study, three principal components explained approximately 74 % of the variation of the original variables, resulting in a considerable compression of the data with significant contributions of 44.64 % for the first, 19.25 % for the second, and 9.53 % for the fourth principal components.
The physicochemical and sensory characteristics of the nine ice cream samples were evaluated. During this analysis, the main component 1 (PC1) was primarily related to the values of the sensory attributes (flavor, aftertaste, color, odor, overall
acceptability, and texture), and overrun, whereas the principal
Based on the results obtained, it can be concluded that ice creams supplemented with pretreated orange peel fiber (ICG) did not significantly change the most important physical and sensory properties of the ice creams, such as the color
parameters (L* and a*), melting rate and texture parameters
(hardness, adhesiveness, springiness, and cohesiveness) and did not change the acceptance attributes. Therefore, it was found that pretreating the orange peel is an effective strategy to reduce the bitter taste (characteristic of orange fibers) when using it as a fiber supplement (at 1.0 %) in lemon ice cream without changing the product properties.
Nutritional benefits associated with dietary fiber fortification and fat reduction are appealing features for the development of novel products that can fill market niches.
References
Adapa, S., Dingeldein, H., Schmidt, K. A., & Herald, T. J. (2000). Rheological properties of ice cream mixes and frozen ice creams containing fat and fat replacers. Journal of Dairy
Science, 83(10), 2224-2229.
http://dx.doi.org/10.3168/jds.S0022-0302(00)75106-X
Aime, D. B., Arntfield, S. D., Malcolmson, L. J., & Ryland, D. (2001). Textural analysis of fat reduced vanilla ice cream products. Food Research International, 34(2-3):237-246. Retrieved from: http:// www.sciencedirect.com/science/article/pii/S0963996900001605 http://dx.doi.org/10.1016/S0963-9969(00)00160-5
Akalin, A. S., Karagözlü, C., & Ünal, G. (2008). Rheological properties of reduced-fat and low-fat ice cream containing whey protein isolate and inulin. European Food Research and Technology, 227(3), 889-895. Retrieved from: http://link.springer. com/article/10.1007%2Fs00217-007-0800-z http://dx.doi. org/10.1007/s00217-007-0800-z
Association of Official Analytical Chemist - AOAC. (1990). Official methods of analysis (Vol. 2, 15th ed.). Arlington: AOAC.
hydro-distillation. This color was also evaluated by instrumental analysis using a colorimeter.
The sensory attributes (texture, odor, flavor, aftertaste, color, and overall acceptability) and instrumental color luminosity of the ICG and ICE samples were similar to those of the IC sample (Figure 2). Both samples were supplemented with pre-treated fibers (F3 and F4) at low concentrations (1.0 %). The physicochemical and sensory results of the ICD, ICF, ICG, and ICH samples were the most significantly different from the IC sample.
The ice cream melting rate was better explained by the principal component 4 (PC4). The ICB and ICF samples had the highest melting rates. The ice cream melting rate was directly correlated with the sample hardness. Extremely hard samples also showed high melting rate. This result is different from those of other studies, in which these variables were inversely proportional (Akalin, 2008; El-Nagar et al., 2002).
PCA proved to be an extremely convenient method for the multivariate characterization of the ice cream samples. It was possible to evaluate and correlate the sensory and physical methods, thus demonstrating that the sensory results could be confirmed with the physical tests conducted, such as the color assessment. Physical characteristics, such as texture and melting rate, were also correlated.
4 Conclusions
The use of orange fiber is an effective alternative to fat in ice creams. This is a very promising finding, given that the orange juice industry by-products are used in the production of fat replacers due to their nutritional and functional properties. Notably, their addition did not change important ice cream properties and resulted in a light ice cream with mean fat content reduction of approximately 50 %.
science/article/pii/S0309174001000535 http://dx.doi.org/10.1016/ S0309-1740(01)00053-5
Karaca, O. B., Guven, M., Yasar, K., Kaya, S., & Kahyaoglu, T. (2009) The functional, rheological and sensory characteristics of ice creams with various fat replacers. International Journal of Dairy Technology, 62(1):93-99. Retrieved from: http://onlinelibrary.wiley. com/doi/10.1111/j.1471-0307.2008.00456.x/abstract http://dx.doi. org/10.1111/j.1471-0307.2008.00456.x
Li, Z., Marshall, R., Heymann, H., & Fernando, L. (1997). Effect of milk fat content on flavor perception of vanilla ice cream. Journal of Dairy Science, 80(12), 3133-3141. Retrieved from: http://www. journalofdairyscience.org/ http://dx.doi.org/10.3168/jds.S0022-0302(97)76284-2
Mansour, E. H., & Khalil, A. H. (1997). Characteristics of low-fat beefburger as influenced by various types of wheat fibers. Food
Research International, 30(3-4), 199-205. Retrieved from: http://
www.sciencedirect.com/science/article/pii/S0963996997000434 http://dx.doi.org/10.1016/S0963-9969(97)00043-4
Marín, F. R., Soler-Rivas, C., Benavente-García, O., Castillo, J., & Pérez-Alvarez, J. A. (2007). By-products from different citrus processes as a source of customized functional fibres. Food Chemistry, 100(2), 736-741. Retrieved from: http://www.sciencedirect.com/science/ article/pii/S0308814605009386 http://dx.doi.org/10.1016/j. foodchem.2005.04.040
Marshall, R. T., & Goff, H. D., & Hartel, R. W. (2003). Ice cream (6th ed.). New York: Kluwer Academic Publishers. http://dx.doi. org/10.1007/978-1-4615-0163-3
Meilgaard, M., Civille, G. V., & Carr, B. T. (2007). Sensory evaluation techniques (4th ed.). Boca Raton: CRC Press.
Mendoza, E., García, M. L., Casas, C., & Selgas, M. D. (2001). Inulin as fat substitute in low fat, dry fermented sausages. Meat Science, 57(4), 387-393. Retrieved from: http://www.sciencedirect. com/science/article/pii/S0309174000001169 http://dx.doi. org/10.1016/S0309-1740(00)00116-9
Milani, E., & Koocheki, A. (2011) The effects of date syrup and guar gum on physical, rheological and sensory properties of low fat frozen yoghurt dessert. International Journal of Dairy
Technology, 64(1), 121-129. Retrieved from: http://onlinelibrary.
wiley.com/doi/10.1111/j.1471-0307.2010.00631.x/abstract?denie dAccessCustomisedMessage= &userIsAuthenticated=false http:// dx.doi.org/10.1111/j.1471-0307.2010.00631.x
Prindiville, E. A., Marshall, R. T., & Heymann, H. (1999). Effect of milk fat on the sensory properties of chocolate ice cream. Journal of Dairy Science, 82(7), 1425-1432. Retrieved from: http://www. journalofdairyscience.org/ http://dx.doi.org/10.3168/jds.S0022-0302(99)75369-5
Prindiville, E. A., Marshall, R. T., & Heymann, H. (2000). Effect of milk fat, cocoa butter, and whey protein fat replacers on the sensory properties of lowfat and nonfat chocolate ice cream. Journal of Dairy Science, 83(10), 2216-2223. Retrieved from: http://www.ncbi.nlm. nih.gov/pubmed/11049061 http://dx.doi.org/10.3168/jds.S0022-0302(00)75105-8
Roland, A. M., Phillips, L. G., & Boor, K. J. (1999). Effects of fat content on the sensory properties, melting, color, and hardness of ice cream.
Journal of Dairy Science, 82(1), 32-38. Retrieved from: http://
www.journalofdairyscience.org/article/S0022-0302(99)75205-7/ abstractref http://dx.doi.org/10.3168/jds.S0022-0302(99)75205-7 Roland, A. M., Phillips, L. G., & Boor, K. J. (1999). Effects of fat replacers
on the sensory properties, color, melting, and hardness of ice cream. Journal of Dairy Science, 82(10), 2094-2100. Retrieved from: http:// www.sciencedirect.com/science/article/pii/S0022030299754512 http://dx.doi.org/10.3168/jds.S0022-0302(99)75451-2
Cadena, R. S., & Bolini, H. M. A. (2011). Time-intensity analysis and acceptance test for traditional and light vanilla ice cream. Food Research International, 44(3), 677-683. Retrieved from: http://www. sciencedirect.com/science/article/pii/S0963996910004813 http:// dx.doi.org/10.1016/j.foodres.2010.12.012
Chang, Y., & Hartel, R. W. (2002). Development of air cells in a
batch ice cream freezer. Journal of Food Engineering, 55(1),
71-78. Retrieved from: http://www.sciencedirect.com/science/ article/pii/S0260877401002436 http://dx.doi.org/10.1016/S0260-8774(01)00243-6
Crizel, T. M., Jablonski, A., Rios, A. O., Rech, R., & Flôres, S. H. (2013). Dietary fiber from orange byproducts as a potential fat replacer. LWT - Food Science and Technology, 53(1), 9-14. Retrieved from: http://www.sciencedirect.com/science/journal/00236438/53/1 http://dx.doi.org/10.1016/j.lwt.2013.02.002
Cruz, A. G., Antunes, A. E. C., Sousa, A., Faria, J. A. F., & Saad, S. M. I. (2009). Ice-cream as a probiotic food carrier. Food Research
International, 42(9), 1233-1239. Retrieved from: http://www.
sciencedirect.com/science/article/pii/S0963996909000908 http:// dx.doi.org/10.1016/j.foodres.2009.03.020
Dervisoglu, M., & Yazici, F. (2006). Note. The effect of citrus fibre on the physical, chemical and sensory properties of ice cream. Food
Science and Technology International, 12(2), 159-164. Retrieved
from: http://fst.sagepub.com/content/12/2/159.refs http://dx.doi. org/10.1177/1082013206064005
Dutcosky, S. D. (1996). Análise sensorial de alimentos. Curitiba: Champagnat.
El-Nagar, G., Clowes, G., Tudorica, C. M., Kuri, V., & Brennan, C. S. (2002). Rheological quality and stability of yog-ice cream with added
inulin. International Journal of Dairy Technology, 55(2), 89-93.
http://dx.doi.org/10.1046/j.1471-0307.2002.00042.x
Ferhat, M. A., Meklati, B. Y., Smadja, J., & Chemat, F. (2006). An improved microwave Clevenger apparatus for distillation of essential oils from orange peel. Journal of Chromatography A, 1112(1-2), 121-126. Retrieved from: http://www.sciencedirect. com/science/article/pii/S0021967305024234 PMid:16384566. http://dx.doi.org/10.1016/j.chroma.2005.12.030
Garau, M. C., Simal, S., Rosselló, C., & Femenia, A. (2007). Effect of air-drying temperature on physico-chemical properties of dietary fibre and antioxidant capacity of orange (Citrus aurantium
v. Canoneta) by-products. Food Chemistry, 104(3),
1014-1024. Retrieved from: http://www.sciencedirect.com/science/ article/pii/S0308814607000635 http://dx.doi.org/10.1016/j. foodchem.2007.01.009
Goff, H. D. (2002). Formation and stabilisation of structure in ice-cream and related products. Current Opinion in Colloid &
Interface Science, 7(5-6), 432-437. Retrieved from: http://www.
sciencedirect.com/science/article/pii/S1359029402000766 http:// dx.doi.org/10.1016/S1359-0294(02)00076-6
Guinard, J. X., Zoumas-Morse, C., Mori, L., Uatoni, B., Panyam, D., & Kilara, A. (1997). Sugar and fat effects on sensory properties of ice cream. Journal of Food Science, 62(5), 1087-1094. http://dx.doi. org/10.1111/j.1365-2621.1997.tb15044.x
Hwang, J. Y., Shyu, Y. S., & Hsu, C. K. (2009). Grape wine lees improves the rheological and adds antioxidant properties to
ice cream. LWT - Food Science and Technology, 42(1), 312-318.
Retrieved from: http://www.sciencedirect.com/science/article/pii/ S0023643808000807 http://dx.doi.org/10.1016/j.lwt.2008.03.008 Jimenez-Colmenero, F., Carballo, J., & Cofrades, S. (2001). Healthier
Shaviklo, G. R., Thorkelsson, G., Sveinsdottir, K., & Rafipour, F. (2011). Chemical properties and sensory quality of ice cream fortified with fish protein. Journal of the Science of Food and Agriculture, 91(7), p. 1199-1204. Retrieved from: http://www.ncbi.nlm.nih.gov/ pubmed/21337575 PMid:21337575. http://dx.doi.org/10.1002/ jsfa.4299
Vainionpää, J., Smolander, M., Alakomi, H. L., Ritvanen, R., Rajamäki, T., Rokka, M., & Ahvenainen, R. (2004). Comparison of different analytical methods in the monitoring of quality of modified atmosphere packaged broiler chicken cuts using principal
component analysis. Journal of Food Engineering, 65(2),
273-280. Retrieved from: http://www.sciencedirect.com/science/ article/pii/S0260877404000330 http://dx.doi.org/10.1016/j. jfoodeng.2004.01.025
Voragen, A. G. J. (1998). Technological aspects of functional food-related carbohydrates. Trends in Food Science & Technology, 9(8-9), 328-335. Retrieved from: http://www.sciencedirect.com/science/ article/pii/S0924224498000594 http://dx.doi.org/10.1016/S0924-2244(98)00059-4
Rossa, P. N., Burin, V. M., & Bordignon-Luiz, M. T. (2012). Effect of microbial transglutaminase on functional and rheological properties of ice cream with different fat contents. LWT - Food
Science and Technology, 48(2), 224-230. Retrieved from: http://
www.sciencedirect.com/science/article/pii/S0023643812001405 http://dx.doi.org/10.1016/j.lwt.2012.03.017
Sales, R. L., Volp, A. C. P., Barbosa, K. B. F., Dantas, M. I. D., Duarte, H. S., & Minim, V. P. R. (2008). Preference map of high-fiber ice
cream. Ciência e Tecnologia de Alimentos, 28, 27-31. Retrieved
from: http://www.scielo.br/scielo.php?script=sci_arttext&pid =S0101-20612008000500005 http://dx.doi.org/10.1590/S0101-20612008000500005