Maejo International
Journal of Science and Technology
ISSN 1905-7873 Available online at www.mijst.mju.ac.th Full Paper
Development of Job’s-tears ice cream recipe
Waraluck Khongjeamsiri, Wiwat Wangcharoen*, Suthaya Pimpilai and Wichittra Daengprok
Faculty of Engineering and Agricultural Industry, Maejo University, Chiang Mai 50290, Thailand *Corresponding author, e-mail: wiwat@mju.ac.th
Received: 29 May 2009 / Accepted: 9 October 2009 / Published: 20 October 2009
Abstract: Job’s tears ice cream recipe was developed by varying proportions of Job’s tears, sucrose, salt and coconut milk. Product positioning mapping was used to identify the sensory attributes that were drivers of preference, which appeared to be sweetness, smoothness, richness, and coconut milk and Job's-tears flavours of the product. Cluster analysis was used to differentiate consumers by their preference direction. Nutritional composition, antioxidant capacity and total phenolic content of the final product were also determined.
Key words: Job’s-tears, ice cream, antioxidant capacity, product positioning map, cluster analysis
Introduction
not permitted in ice cream and products made with non-dairy fat must be described by an alternative name. European Community countries permit the use of non-dairy fat but they apply the term “dairy” ice cream where all the fat is milk fat [4].
In Thailand, commercial ice cream products are now legally controlled by Ministry of Public Health Announcements Issue 222 (2001) and 257 (2002), which classify products into 5 categories, viz. dairy ice cream, modified fat ice cream, mixed ice cream, ice cream in liquid or dried or powder forms, and sweet and cold ice cream from non-dairy products [6-7]. Ice cream produced from non-dairy products is easily available in both commercialised and home-made styles. Coconut milk, obtained by squeezing coconut flesh that has been soaked in water, is a well-known raw material used for replacing dairy products in ice cream production [8]. Ice cream made from other liquid foods has been developed such as soy milk ice cream, brown rice ice cream [9-10] and fruit ice cream [11].
Job's-tears (Coix lacryma-jobi) is a kind of cereal used for both food [12-13] and Chinese and Indian medicine [14-16], although it is not widely consumed in Thailand. The potential to develop Job’s-tears-based ice cream has been investigated by us [17]. Thus, this work is aimed to develop Job’s-tears-Job’s-tears-based ice cream recipe which is accepted by the consumers as well as potentially healthful.
Materials and Methods
Ingredients
All ingredients used were commercial products. These were Job’s-tears (Rai Tip brand), sucrose (Mitr Phol brand), salt (Prung Thip brand), coconut milk (Chaokoh brand) and glucose syrup (5 Star Elephant brand).
Study on optimal Job’s-tears content
Job’s-tears seeds were washed, soaked in water for 2 hours, boiled for 40 minutes and blended with water in a ratio of 1:2 (boiled seeds:water) by means of a blender. The blended mixture contained 13-15 % (w/w) of initial total solid (dry weight), which was subsequently adjusted by water addition to four concentrations, i.e. 6, 8, 10 and 12 % (w/w), used for preparing ice cream. Coconut milk, glucose syrup, sucrose and salt at 50, 32, 12 and 0.8 % (w/w) respectively of each diluted mixture were added. The concoction was mixed with the blender and heated at 80 C for 15 min, then cooled rapidly and stored overnight in the refrigerator. It was made into ice cream by means of a compressor ice cream maker (JCS Technic Line Co., Ltd.). The ice cream was packed and kept in the freezer at least 1 week before testing.
Study on concentration of sucrose and salt
The concentration of sucrose in the ice cream was varied at 12 and 20 % of the blended Job’s-tears mixture while that of salt was varied at 0.4 and 0.8 %.
Study on quantity of coconut milk
Sensory property measurement
One hundred consumers were requested to evaluate the sensory attributes of the products, viz. hardness, sweetness, saltiness, Job’s-tears flavour, coconut milk flavour, richness, smoothness and aftertaste, together with their overall preference on each product by scoring each item on a scale of 1 to 10 (least to most).
Chemical analysis of the final product
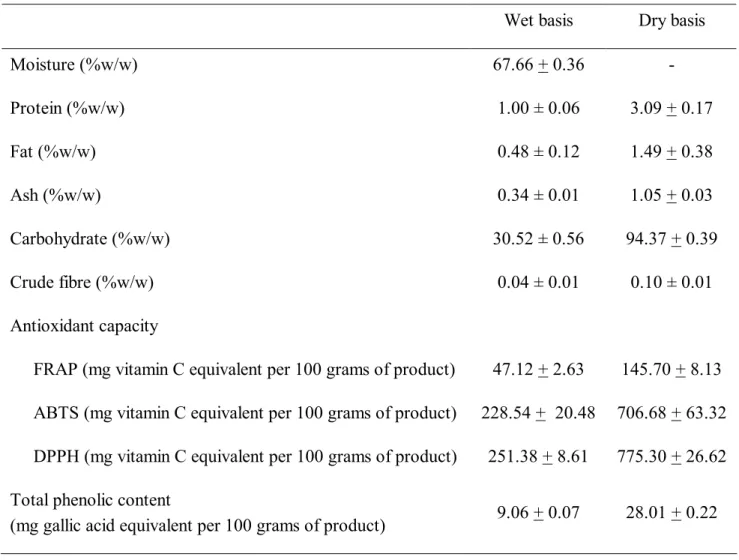
Nutritional data, antioxidant capacity and total phenolic content of the final product were determined. Moisture, protein, fat, ash and crude fibre content were determined in accordance with AOAC methods [18], and carbohydrate content was calculated by subtraction. Antioxidant capacity was evaluated by 3 different methods, namely ferric reducing/antioxidative power (FRAP) assay [19], improved ABTS radical cation decolorisation assay [20] and DPPH free radical scavenging activity [21]. Total phenolic content was analysed by Folin-Ciocalteau micro method [22].
For the analysis of antioxidant capacity and total phenolic content, 2 grams of sample was added with 10 ml of 57% ethanol. The extraction was done by using a vortex mixer for 60 s. The mixture was filtered by Whatman No 1 filter paper and the filtrate was used as the extract sample.
Briefly of FRAP assay, 6 ml of working FRAP reagent (0.1 M acetate buffer:0.02 M FeCl3:0.01 M TPTZ = 10:1:1) prepared daily was mixed with 20 l of the extract sample. The absorbance at 593 nm was recorded after a 30-min incubation at 37 °C.
For ABTS assay, the ABTS+ was produced by reacting 7 mM ABTS stock solution with 2.45 mM postassium persulphate (final concentration) and allowing the mixture to stand in the dark at room temperature for 12-16 hours before use. The ABTS+ solution was diluted with deionised water and 95 % ethanol (1:1) to an absorbance of 0.70 (+ 0.02) at 734 nm. Twenty l of the extract sample was mixed with 6 ml of the diluted ABTS+ solution. The decrease of absorbance was recorded at 1 min after mixing.
In the case of DPPH assay, 400 l of the extract sample was diluted to 5.4 ml using deionised water and 95 % ethanol (1:1) before 0.6 ml of 0.8 mM DPPH solution was added and the mixture shaken vigorously. The decrease of absorbance was recorded at 1 min after mixing. Vitamin C (0-40 µg) were used as standard, and results were reported as mg vitamin C equivalent per 100 grams of product.
To determine total phenolic content, 60 l of the extract sample was diluted with deionised water to 4.8 ml before 300 l of Folin-Ciocalteau reagent was added with shaking. After that, 900 l of 20% sodium carbonate was added with mixing. The mixture was left at 40° C for 30 min before reading of the absorbance at 765 nm. Gallic acid (0-50 µg) was used as standard and results were reported as mg gallic acid equivalent per 100 grams of product.
Statistical analysis
multiple range test were applied to differentiate products by consumer preference. All statistical analysis was done by SPSS 16.0 Family.
Results and Discussion
Study on optimal Job’s-tears content
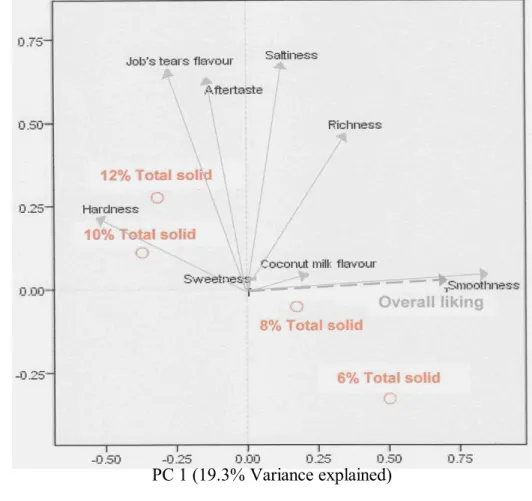
Sensory attributes of ice cream produced from Job’s-tears at 6, 8, 10, and 12 % are reduced to 3 principal components (PCs) with 52.1% variance explained (Figure 1). Product positioning maps created from 3 PCs show that products with more Job’s-tears total solid were harder and stronger in Job’s-tears flavour and aftertaste while those with less total solid were smoother. In addition, smoothness, richness, coconut milk flavour, sweetness and saltiness can be considered as drivers of preference for this step because their vectors are in the same direction of the overall preference vector, especially for smoothness (Figure 1). The smoothness of ice cream is not only due to ingredients but also to the process used in the manufacture [1]. Fats, sweeteners and stabilisers are ingredients influencing the texture of ice cream [2,4,5]. Temperature and pressure of homogenisation should be optimised while freezing and hardening processes have to be very rapid to provide small ice crystals and a smooth body of ice cream [2,3,5]. However, only used ingredients were studied to improve product acceptance in this experiment. The amounts of sugar, salt and coconut milk therefore were varied in further steps.
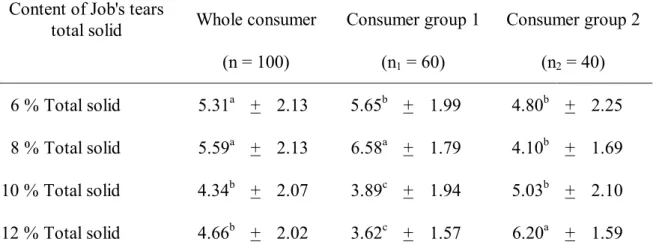
From 100 consumers, the mean overall preference scores of products with 6 and 8 % Job’s-tears were significantly higher than those with 10 and 12 %. However, cluster analysis result show two different directions of consumer preference. Sixty consumers preferred the product with 8 % Job’s- tears while forty preferred that with 12 % (Table 1). Thus, the former composition of Job’s-tears was selected for producing the ice cream in the next step.
Table 1. Overall preference scores (mean + standard deviation) of ice cream produced from 6, 8, 10, and 12 % Job’s-tears
Content of Job's tears
total solid Whole consumer Consumer group 1 Consumer group 2
(n = 100) (n1 = 60) (n2 = 40)
Figure 1. Product positioning maps of ice cream produced from 6, 8, 10 and 12 % Job’s tears
PC
2
(17.
0%
V
ar
ia
nc
e
expl
ai
ne
d)
PC 1 (19.3% Variance explained)
PC 1 (19.3% Variance explained)
PC
3
(15.
8%
V
ar
ia
nc
e
expl
ai
ne
Study on concentration of sucrose and salt
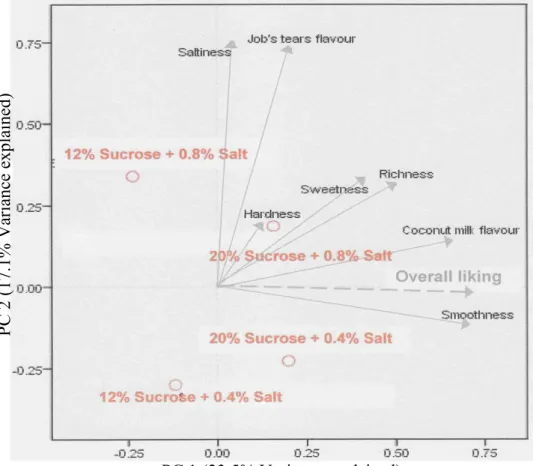
Sucrose and salt were studied together because both of them affect the taste of the products. Sensory attributes from sucrose and salt were reduced to 3 PCs with 55.0 % variance explained. From their product positioning maps (Figure 2), the sweetness of products with 12 and 20 % sucrose was reduced by increasing the quantity of salt, while the saltiness of products with 0.8% salt was also reduced by the amount of sucrose added. This interaction is a physiological factor called suppression [23]. Drivers of product preference in this step seem to be smoothness, richness, coconut milk flavour and sweetness because their vectors are in the same direction of the overall preference vector. In this step, saltiness was not the driver of preference anymore because saltiness perception was suppressed by sweetness, and sweetness is one of the desired tastes for ice cream [5].
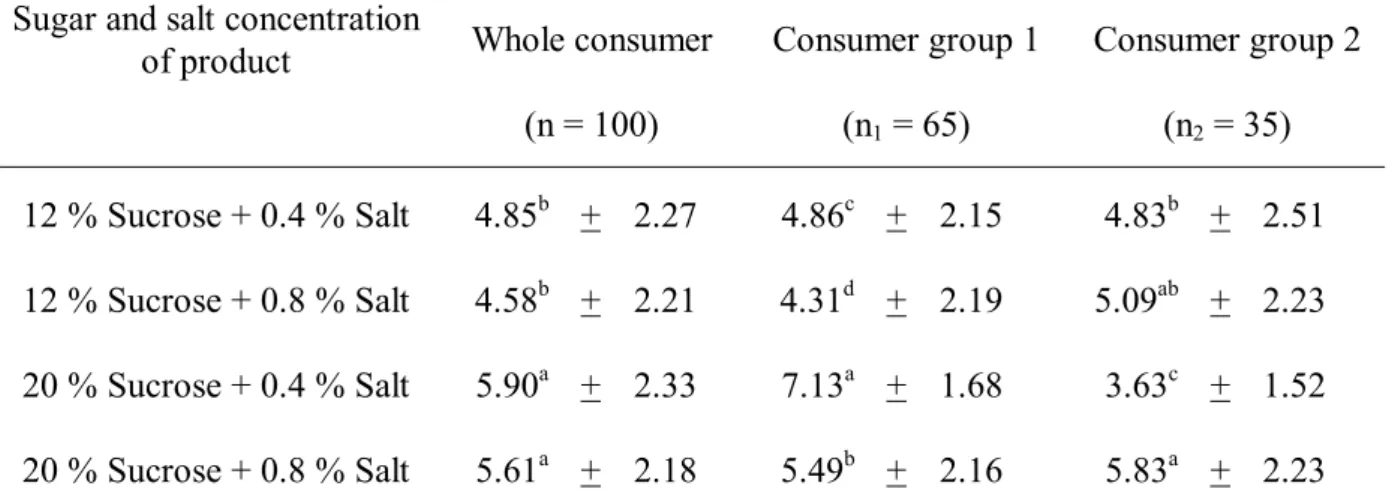
The mean overall preference scores from 100 consumers show that the products with 20% sucrose were preferred to the ones with 12 % sucrose (Table 2). However, different directions of consumer preference were found by cluster analysis. Sixty-five consumers preferred sweet products (20% sucrose + 0.4% salt > 20% sucrose + 0.8% salt > 12% sucrose + 0.4% salt > 12% sucrose + 0.8% salt), while 35 consumers preferred salty products (20% sucrose + 0.8% salt 12% sucrose + 0.8% salt 12% sucrose + 0.4% salt > 20% sucrose + 0.4% salt). Therefore, 20% sucrose and 0.4% salt were selected for producing Job’s-tears ice cream in the next step.
Table 2. Overall preference scores (mean + standard deviation) of ice cream produced from 12 and 20 % sucrose and 0.4 and 0.8 % salt
Sugar and salt concentration
of product Whole consumer Consumer group 1 Consumer group 2
(n = 100) (n1 = 65) (n2 = 35)
Figure 2. Product positioning maps of ice cream produced from 12 and 20% sucrose and 0.4 and 0.8% salt.
PC
2
(17.
1%
V
ar
ia
nc
e
expl
ai
ne
d)
PC 1 (23.5% Variance explained)
PC
3
(14.
4%
V
ar
ia
nc
e
expl
ai
ne
d)
Study on quantity of coconut milk
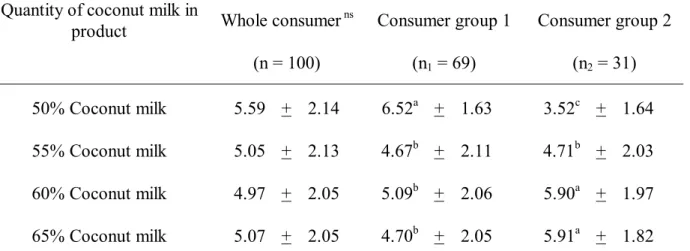
Sensory attributes of products with different quantities of coconut milk were reduced to 2 PCs with 43.2 % variance explained. The product positioning map (Figure 3) shows that products with high coconut milk quantity were richer, sweeter, smoother and stronger in coconut milk and Job’s-tears flavours. Drivers of preference of products in this step seem to be smoothness, richness, coconut milk flavour, sweetness and Job’s-tears flavour because their vectors are in the same direction of the overall preference vector. The mean overall preference scores of products from 100 consumers in this step are not significantly different (p>0.05), but cluster analysis could separate 100 consumers into two different groups (Table 3). Sixty-nine from 100 consumers preferred the product with 50% coconut milk while the rest preferred products with 60-65% coconut milk. This result agrees with the previous work [17] which found that only 36 from 100 consumers wanted more coconut milk in Job’s-tears ice cream. Therefore, the product with 50% coconut milk was selected as the final product in this study.
Figure 3. Product positioning map of ice cream with 50, 55, 60 and 65 % coconut milk
PC
2
(15.
5%
V
ar
ia
nc
e
ex
pl
ai
ne
d)
Table 3. Overall preference scores (mean + standard deviation) of ice cream with different quantities of coconut milk
Quantity of coconut milk in
product Whole consumer ns Consumer group 1 Consumer group 2
(n = 100) (n1 = 69) (n2 = 31)
50% Coconut milk 5.59 + 2.14 6.52a + 1.63 3.52c + 1.64 55% Coconut milk 5.05 + 2.13 4.67b + 2.11 4.71b + 2.03 60% Coconut milk 4.97 + 2.05 5.09b + 2.06 5.90a + 1.97 65% Coconut milk 5.07 + 2.05 4.70b + 2.05 5.91a + 1.82
Note : Means with different letters in the same column were significantly different (p<0.05). ns Means in this column were not significantly different (p>0.05).
Chemical analysis of the final product
Table 4. Nutritional data, antioxidant capacity and total phenolic content (mean + standard deviation) of Job’s-tears ice cream
Wet basis Dry basis
Moisture (%w/w) 67.66 + 0.36 -
Protein (%w/w) 1.00 ± 0.06 3.09 + 0.17
Fat (%w/w) 0.48 ± 0.12 1.49 + 0.38
Ash (%w/w) 0.34 ± 0.01 1.05 + 0.03
Carbohydrate (%w/w) 30.52 ± 0.56 94.37 + 0.39
Crude fibre (%w/w) 0.04 ± 0.01 0.10 ± 0.01
Antioxidant capacity
FRAP (mg vitamin C equivalent per 100 grams of product) 47.12 + 2.63 145.70 + 8.13 ABTS (mg vitamin C equivalent per 100 grams of product) 228.54 + 20.48 706.68 + 63.32 DPPH (mg vitamin C equivalent per 100 grams of product) 251.38 + 8.61 775.30 + 26.62 Total phenolic content
(mg gallic acid equivalent per 100 grams of product) 9.06 + 0.07 28.01 + 0.22
Conclusions
The developed Job’s-tears ice cream recipe was preferred by 69% of the consumers. It consists of a mix containing 8% (w/w) Job’s-tears total solid with added sucrose (20% of the mix), salt (0.4% of the mix) and coconut milk (50% of the mix), together with glucose syrup (32% of the mix). It is therefore composed of 4.0, 45.4, 9.9, 0.2, 24.7, and 15.8 % (w/w) of Job’s tears total solid, water, sucrose, salt, coconut milk, and glucose syrup respectively. The resulting product may be rather high in carbohydrate and low in protein and fat. However, it is very high in antioxidant capacity and therefore potentially healthful.
Acknowledgement
References
1. C. H. Eckles, W. B. Combs and H. Macy, “Milk and milk products”, Tata McGraw-Hill Publishing, New Delhi, 1979.
2. J. Tobias, in “Dairy Technology and Engineering” (Ed. W. J. Harper and C. W. Hall), AVI Publishing, Connecticut, 1976, Ch. 2.
3. V. A. Jones and W. J. Harper, in “Dairy Technology and Engineering” (Ed. W. J. Harper and C. W. Hall), AVI Publishing, Connecticut, 1976, Ch.4.
4. A. H. Varnam and J. P. Sutherland, “Milk and Milk Products: Technology, Chemistry and Microbiology”, Chapman and Hall, London, 1994.
5. R. T. Marshall and W. S. Arbuckle, “Ice Cream”, 5th Edn., Chapman and Hall, New York, 1996. 6. Ministry of Public Health, Announcement Issue 222, “Ice cream”, Ministry of Public Health,
Bangkok, 2001. (in Thai)
7. Ministry of Public Health, Announcement Issue 257, “Ice cream (Issue 2)”, Ministry of Public Health, Bangkok, 2002. (in Thai)
8. M. Moore, “Thai-style ice cream”, Phuket Magazine Vol. 13.1 (no date), Retrieved December 15, 2007, from:
http://www.phuketmagazine.com/html/PM%20Issues/Vol.13.1/Ice%20Cream-%20Thai%20Style.htm
9. K. Wongcharoenkit and M. Chuchom, “Soy milk ice cream”, Special Problem for Bachelor of Science Program in Food Science and Technology, 2005, Maejo University, Thailand. (in Thai) 10. W. Wangcharoen, “Brown rice ice cream and soy milk ice cream”, Workshop on “Processing of
Health Food Products”, 2007, Maejo University, Thailand. (in Thai)
11. N. Tengmongkol (ed.), “Ice Cream”, Sang Daad Publisher, Bangkok, 2004. (in Thai)
12. A. Arber, “The Gramineae - a Study of Cereal, Bamboo, and Grass”, Wheldon and Wesley, New York, 1965.
13. A. Pink, “Gardening for the million”, EText-No.11892, 2004, Retrieved February 20, 2007, from: http://www.gutenberg.org/etext/11892.
14. J. A. Duke and E. S. Ayensu, “Medicinal Plants of China”, Reference Publications, Michigan, 1985. 15. H. Yeung, “Handbook of Chinese Herbs and Formulas”, Institute of Chinese Medicine, Los
Angeles, 1985.
16. R. N. Chopra, S. L. Nayar and I. C. Chopra, “Glossary of Indian Medicinal Plants” (including the supplement), Council of Scientific and Industrial Research, New Delhi, 1986.
17. W. Khongjeamsiri, W. Wangcharoen, S. Pimpilai and W. Daengprok, “Preference direction study of Job’s-tears ice cream”, Maejo Int. J. Sci. Technol., 2007, 1, 137-144.
18. AOAC Internatioanl, “Official Method of Analysis of AOAC International”, 17th Edn., Gaithersburg, Maryland, 2000.
19. I. F. F. Benzie and J. J. Strain, “Ferric reducing / antioxidative power assay: direct measure of total antioxidant activity of biological fluids and modified version of simultaneous measurement of antioxidant power and ascorbic acid concentration”, Methods Enzymol., 1999, 299, 15-27. 20. M. J .T. J. Arts, G. R. M. M. Haenen, H. P. Voss and A. Bast, “Antioxidant capacity of reaction
21. W. Brand-William, M. Cuelier and M. E. Berset, “Use of free radical method to evaluate antioxidant activity”, Lebensm. Wiss. Technol., 1995, 28, 25-30.
22. A. Waterhouse, “Folin-Ciocalteau micro method for total phenol in wine”, (no date), Retrieved May 4, 2005, from: http://waterhouse.ucdavis.edu/phenol/folinmicro.htm.
23. M. Meilgaard, G. V. Civille and B. T. Carr, “Sensory Evaluation Techniques”, 3rd Edn., CRC press, Boca Raton, 1999.
24. Nutrition Division, “Nutrient composition per 100 grams edible portion”, Department of Health, Ministry of Public Health, Bangkok, 1987. (in Thai)
25. U.S. FDA., “Food labeling; nutrient content claims: definition for ‘high potency’ and definition of ‘antioxidant’ for use in nutrient content claims for dietary supplements and conventional foods”, Fed. Regist. 62:49868-49881, U.S. Food and Drug Administration, 1997.
26. C. C. Kuo, M. C. Shih, Y. H. Kuo and W. Chiang, “Antagonism of free-radical-induced damage of adlay seed and its antiprolifrative effect in human histolytic lymphoma U237 monocytic cells”, J. Agric. Food Chem., 2001, 49, 1564-1570.
27. CFSAN., “Guidance for industry: a food labeling guide”, Center for Food Safety and Applied Nutrition, 2008, Retrieved April 15, 2008, from: http://www.cfsan.fda.gov/guidance.html.