http://dx.doi.org/10.1590/2317-1545v39n3160444
Seedling image analysis and traditional tests to evaluate onion seed vigor
11Submitted on 02/29/2016. Accepted for publication on 05/01/2017.
2Departamento de Produção Vegetal, USP/ESALQ, Caixa Postal 9, 13418-900 - Piracicaba, SP, Brasil.
*Corresponding author < nayararob1@gmail.com>
Nayara Roberto Gonçalves
2*, Silvio Moure Cicero
2, Haynna Fernandes Abud
2ABSTRACT – The aim of this study was to verify the possibility of using computerized seedling image analysis to detect differences in vigor among onion seed lots and to compare this analysis with traditional vigor tests. We used five seed lots of two onion cultivars, Bella Catarina and Bella Vista. The Seed Vigor Imaging System (SVIS®) software was used to process the seedling images and assess seedling length and vigor through seedling uniformity and growth indexes. These determinations were compared to traditional tests used to evaluate onion seed vigor: germination percentage and first germination count, seedling emergence percentage and emergence speed, accelerated aging, and electrical conductivity. Results showed that vigor differences among onion seed lots can be identified using the SVIS® in a manner similar to traditional vigor tests; assessments should be performed at five days after sowing.
Index terms: SVIS®, seed analysis, physiological potential.
Análise de imagens de plântulas e testes tradicionais para avaliação
do vigor de sementes de cebola
RESUMO – Objetivou-se com esta pesquisa verificar o uso da análise computadorizada de imagens de plântula na detecção de diferença de vigor em lotes de sementes de cebola e comparar com os testes de vigor tradicionalmente utilizados. Utilizaram-se cinco lotes de sementes de dois cultivares de cebola, Bella Catarina e Bella Vista. Utilizou-se o softwareSeed Vigor Imaging System (SVIS®) para o processamento das imagens de plântulas e obtenção do comprimento de plântulas e dos índices de vigor, de uniformidade e de crescimento de plântulas. Essas determinações foram comparadas aos testes tradicionalmente utilizados para avaliação do vigor de sementes de cebola: porcentagem e primeira contagem de germinação, porcentagem e velocidade de emergência de plântulas, envelhecimento acelerado e condutividade elétrica. Conclui-se que é possível identificar diferenças de vigor entre lotes de sementes de cebola por meio do SVIS®, de forma similar aos testes tradicionais de vigor e a avaliação deve ser feita aos cinco dias após a semeadura.
Termos para indexação: SVIS®, análise de sementes, potencial fisiológico.
Introduction
Vegetable seeds are normally produced with a high level of technology and infrastructure, with the aim of obtaining high quality seeds because the seed market is increasingly competitive. Seeds pass through a rigorous quality control system that involves tests to evaluate their physiological potential and germination. However, tests performed under optimal conditions of temperature, moisture, lighting, and
aeration can overestimate the quality of seed lots for field
use. Therefore, other determinations must be made in order
to classify seed lots in regard to vigor and to more precisely
predict their field performance (Marcos-Filho, 2015)
and, thus, complement the information obtained from the germination test (Dias et al., 2006). Among the vigor tests, the most used are seedling performance tests, in which the speed and uniformity of seedling growth are calculated, and seedling parts are examined (Silva and Cícero, 2014a).
Although the vigor tests commonly used indicate the physiological potential of the seeds, there are still opportunities
to refine these procedures in regard to standardization,
(Marcos-Filho et al., 2006). A promising option for evaluation of seed vigor aiming to resolve these problems is computerized seedling image analysis, which quickly provides consistent information without the subjectivity from the seed analyst (Chiquito et al., 2012).
The first analyses of seedling images to evaluate seed
vigor were proposed by McComark et al. (1990) and Howarth and Stanwood (1993) in lettuce and sorghum seeds. After that, Sako et al. (2001) developed an automated system for evaluating the vigor of lettuce seeds through computerized seedling analysis, the Seed Vigor Imaging System (SVIS®),
which supplies information such as seedling length and indexes of vigor, growth, and uniformity of growth. This software has already been successfully tested on other species, such as melon Filho et al., 2006), soybean (Marcos-Filho et al., 2009), maize (Mondo et al., 2011), sweet corn (Alvarenga et al., 2012), cucumber (Chiquito et al., 2012), rattlepod (Silva et al., 2012), okra (Kikuti and Marcos-Filho, 2013), lettuce (Kikuti and Marcos-Filho, 2012), dry edible bean (Gomes Junior et al., 2014), eggplant (Silva and Cícero, 2014a), and tomato (Silva and Cícero, 2014b).
Up to now, there is no information on the use of computerized seedling image analysis to evaluate onion seed vigor. Thus, the aim of this study was to verify the possibility of using the Seed Vigor Imaging System (SVIS®) to detect
vigor differences among onion seed lots and compare this
information with the one obtained from traditional vigor tests.
Materials and Methods
The study was conducted in the Image Analysis and Seed Analysis Laboratories of the Plant Production Department of the Agriculture College “Luiz de Queiroz”, University of São Paulo (LPV/ESALQ/USP) in Piracicaba - SP, Brazil.
Evaluations were taken on five lots from each of two
onion cultivars, Bella Catarina and Bella Vista. The seeds were placed in sealed aluminized bags, constituting semipermeable packaging, and stored in a climate-controlled environment (20 ± 1 °C and 45%-50% RH). Three evaluations were made, at six-month intervals.
For computerized seedling image analysis, sixteen acrylic boxes (11.0 x 11.0 x 3.5 cm) were used for each cultivar, consisting of eight replicates of 25 seeds for each day of
analysis, at five and six days after sowing. White blotting
paper overlaid with a sheet of blue blotting paper was used as a substrate. The paper was previously moistened with a volume of water equivalent to 2.5 times the weight of the dry substrate. The seeds were distributed over the blue paper, allowing
were kept in a seed germinator at 20 °C (Brasil, 2009). Seedling
images at five and six days after sowing were acquired with an
HP Scanjet 2004 scanner, set up inverted above an aluminum box with dimensions of 60 x 50 x 12 cm, and were managed by Photosmart software with resolution of 300 dpi.
The images were analyzed using the Seed Vigor Imaging System (SVIS®) software. After processing, the images
provided data on seedling length (SL) in centimeters; growth index (GI), which is the proportion of the current size of the seedling in relation to the maximum possible size on the day evaluated; uniformity (UI), represented by the deviation in relation to the maximum; and vigor (VI), based
on the proportion 70:30 of growth/uniformity (Hoffmaster et
al., 2003). The values of the growth, uniformity, and vigor indexes can range from 0 to 1000. The maximum seedling
size at five and six days after sowing was stipulated at 2.0
inches (5.08 cm) and 3.6 inches (9.14 cm), respectively. These determinations were compared to the traditional tests used for evaluation of onion seed vigor.
The germination test was conducted at 20 ºC, where the percentage of normal seedlings was determined having
the first count made on the sixth day after sowing and the final count at the twelfth day after sowing (Brasil, 2009). For
seedling emergence percentage and speed, the commercial substrate Plantmax® was used, and daily counts were made
up to the fifteenth day after sowing. The accelerated aging
test was conducted by uniformly distributing 3.0 g of seeds on an aluminum screen within Gerbox® type boxes containing
40 mL of saturated NaCl solution (40 g of NaCl in 100 mL of water) (Jianhua and McDonald, 1996), which were kept in a B.O.D. chamber at 41 ± 0.3 °C for 72 hours (Rodo and Marcos-Filho, 2003). At the end of this period, the germination test was conducted, as previously described, with evaluation at six days. To verify the uniformity of test conditions, the moisture content of the seeds before and after the aging period was determined. Bulk electrical conductivity was conducted by weighing the seeds on a precision balance (± 0.001 g), with subsequent immersion in 25 mL of deionized water for 24 hours at 25 °C (Dias et al., 2006), and the results were expressed in µS. cm-1. g-1 of seeds.
The moisture content of the seeds was determined by the laboratory oven method at 105 °C for 24 hours (Brasil, 2009), with two replications of 1.0 g for each lot after each storage period and of 0.5 g after the accelerated aging test. The results were expressed in percentage (wet basis).
were conducted; it was necessary to transform the accelerated aging data obtained in the second and third evaluation period,
using the formula . The results were tested
through comparison of means by the Scott-Knott test at 5% probability. In addition, simple Pearson correlation analysis was performed between the traditional tests and the indexes generated by the SVIS®. This was done by clustering the five
lots of both cultivars, Bella Catarina and Bella Vista, with in each evaluation period.
Results and Discussion
The initial moisture content of the onion seed lots from both cultivars Bella Catarina and Bella Vista ranged from 8.2% to 9.4% and from 9.2% to 9.3%, respectively, in the
first evaluation period. In the second period, after six months
of storage, the moisture content ranged from 8.9% to 9.9% for the cultivar Bella Catarina and from 9.7% to 9.9% for the cultivar Bella Vista. In the third evaluation period, after twelve months of storage, the seed moisture content ranged from 8.5% to 9.2% and from 9.3% to 9.5% for the cultivars Bella Catarina and Bella Vista, respectively. The changes in the seed moisture content between the storage periods were due
to the semipermeable type of packaging used. Nevertheless, this variation was in accordance to expected values for hygroscopic equilibrium in the storage environment.
It is important to evaluate the seed moisture content when seed lots are compared, because large variations can compromise interpretation of the results obtained in vigor
tests, especially when the differences are greater than 2% (Marcos-Filho, 1999). Thus, it can be affirmed that the differences in the tests were not influenced by variations
in the moisture contents of the seeds, because the greatest
difference was 1.2%, for the cultivar Bella Catarina in the first
evaluation period.
In the first evaluation period, the cultivar Bella Catarina did not exhibit a significant effect of lots over seeds germination percentage and first germination count, with values ranging
from 91% to 97% and 86% to 93%, respectively (Table 1). A similar germination percentage within lots is always desired when the aim is to evaluate seed vigor tests, because it allows the tests to be evaluated in terms of accuracy and sensitivity
when differentiating seed lots (Marcos-Filho, 2015).
For seedling emergence percentage and speed, the performance of seed lot 5 was lower than the other lots, which
were not significantly different (Table 1). The accelerated aging test, for its part, classified lot 4 as best performer when
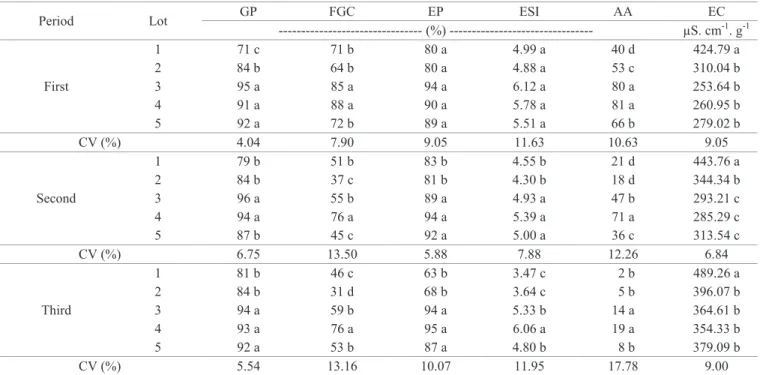
Table 1. Mean values of germination percentage (GP), first germination count (FGC), seedling emergence percentage (EP), seedling emergence speed index (ESI), accelerated aging (AA), and electrical conductivity (EC), of five onion seed
lots of the cultivar Bella Catarina in three evaluation periods.
Period Lot GP FGC EP ESI AA EC
--- (%) --- µS. cm-1. g-1
First
1 91 a 91 a 93 a 6.04 a 47 b 287.02 b
2 93 a 93 a 93 a 6.37 a 55 b 270.55 c
3 92 a 92 a 95 a 6.28 a 54 b 279.23 b
4 96 a 86 a 92 a 5.94 a 85 a 258.65 c
5 97 a 88 a 87 b 5.44 b 54 b 333.72 a
CV (%) 3.34 4.16 3.44 5.47 10.81 2.89
Second
1 89 a 77 a 91 a 5.19 a 6 c 372.58 b
2 90 a 84 a 94 a 5.38 a 15 b 352.07 b
3 94 a 85 a 96 a 5.68 a 11 c 370.23 b
4 91 a 65 b 87 a 4.89 b 55 a 337.01 b
5 91 a 61 b 88 a 4.78 b 20 b 420.26 a
CV (%) 4.57 9.47 5.09 6.37 13.25 7.39
Third
1 88 a 74 a 88 a 5.08 a 0 b 445.14 a
2 95 a 88 a 89 a 5.25 a 0 b 409.67 b
3 91 a 76 a 90 a 5.39 a 0 b 417.22 b
4 93 a 81 a 94 a 5.93 a 16 a 377.47 b
5 89 a 53 b 86 a 4.74 a 1 b 477.97 a
CV (%) 4.45 10.67 6.82 8.55 15.10 6.30
Means followed by the same letter do not differ by the Scott-Knott test at 5% probability.
compared to the other lots, which were not significantly different. The electrical conductivity test (Table 1) classified
lot 5 as the one with the lower vigor and lots 2 and 4 with
the highest vigor. In this first evaluation period, electrical conductivity allowed the lots to be stratified in more vigor
levels than the other tests conducted. This may be explained by the evaluated characteristic, in this case, the integrity of
the membrane system, which is one of the first changes that
occurs in seeds during the deterioration process (Panobianco and Vieira, 2007).
In the second evaluation period (Table 1), no difference
was found between lots in regard to germination percentage and seedling emergence. However, from the results obtained
in the first germination count and seedling emergence speed, lots 1, 2, and 3 were classified as the most vigorous, differing
from the others. In accelerated aging, lot 4 had superior performance, exhibiting greater storage potential, whereas lots 1 and 3 presented lower vigor. In the electrical conductivity
test, only lot 5 was classified as having lowest physiological potential, and there was no difference among the other lots.
After twelve months of storage (third evaluation period), no
difference was found between lots of the cultivar Bella Catarina
for the variables of germination percentage, seedling emergence percentage, and seedling emergence speed (Table 1). By the
accelerated aging test, lot 4 was once more classified as having
greater storage potential, whereas the others did not differ at
such aspect. By the electrical conductivity test, lots 5 and 1 were
classified with lower vigor than lots 2, 3, and 4.
Differences were found in classification of some lots upon
comparing the vigor tests, which can be explained by the fact
that each test evaluates different physiological characteristics
related to the seed deterioration process. Accelerated aging expresses the performance of seeds after a period under conditions of high temperature and relative humidity, from which inferences may be made regarding the storage potential of the lots (Torres and Marcos-Filho, 2003). The electrical conductivity test evaluates the reorganization capacity of the cell membrane system – the more advanced the deterioration process is, the slower the restructuring of cell membranes during imbibition and the greater the electrical conductivity of the solution (Panobianco et al., 2007). Thus, lots with
different vigor levels may be classified in a different way by
these tests (Marcos-Filho, 2015).
Computerized image analysis of seedlings from the seed
lots of the Bella Catarina cultivar, in the first evaluation period, showed that according to the length of the seedlings at five days
after sowing, the lots were separated in more vigor classes than at six days (Table 2). This same result was observed for the vigor and growth indexes, and some factors may be associated
to the differences according to the day of evaluation. The less
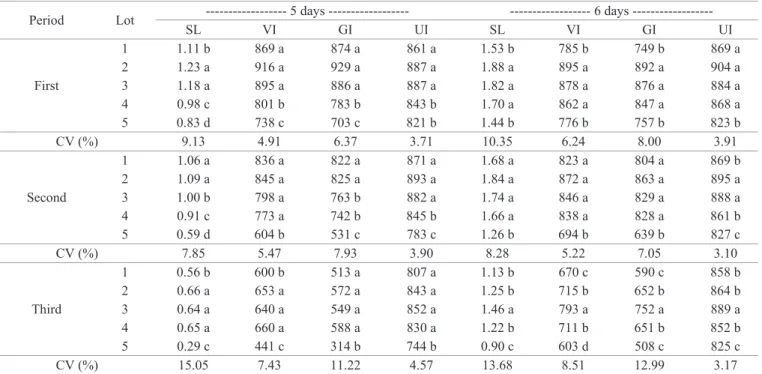
Table 2. Mean values of vigor (VI), growth (GI), uniformity (UI), and seedling length (SL) indexes, obtained by the SVIS®
software at 5 and 6 days after sowing, of five onion seed lots of the cultivar Bella Catarina in the three evaluation periods.
Period Lot --- 5 days --- --- 6 days ---
SL VI GI UI SL VI GI UI
First
1 1.11 b 869 a 874 a 861 a 1.53 b 785 b 749 b 869 a
2 1.23 a 916 a 929 a 887 a 1.88 a 895 a 892 a 904 a
3 1.18 a 895 a 886 a 887 a 1.82 a 878 a 876 a 884 a
4 0.98 c 801 b 783 b 843 b 1.70 a 862 a 847 a 868 a
5 0.83 d 738 c 703 c 821 b 1.44 b 776 b 757 b 823 b
CV (%) 9.13 4.91 6.37 3.71 10.35 6.24 8.00 3.91
Second
1 1.06 a 836 a 822 a 871 a 1.68 a 823 a 804 a 869 b
2 1.09 a 845 a 825 a 893 a 1.84 a 872 a 863 a 895 a
3 1.00 b 798 a 763 b 882 a 1.74 a 846 a 829 a 888 a
4 0.91 c 773 a 742 b 845 b 1.66 a 838 a 828 a 861 b
5 0.59 d 604 b 531 c 783 c 1.26 b 694 b 639 b 827 c
CV (%) 7.85 5.47 7.93 3.90 8.28 5.22 7.05 3.10
Third
1 0.56 b 600 b 513 a 807 a 1.13 b 670 c 590 c 858 b
2 0.66 a 653 a 572 a 843 a 1.25 b 715 b 652 b 864 b
3 0.64 a 640 a 549 a 852 a 1.46 a 793 a 752 a 889 a
4 0.65 a 660 a 588 a 830 a 1.22 b 711 b 651 b 852 b
5 0.29 c 441 c 314 b 744 b 0.90 c 603 d 508 c 825 c
vigorous seeds require more time for organization of the cell and mitochondrial membrane system; therefore, more vigorous seeds initiate translocation of reserves and the other steps of germination at a later time (Marcos-Filho, 2015). In this case, the earlier the evaluation, the greater the lack of uniformity
that may be found and the greater the stratification of the lots. Furthermore, in regard to stratification of the lots in the first evaluation period, lots 1, 2, and 3 presented higher vigor at five
days after sowing. Nevertheless, in the evaluation at six days, only lots 2, 3, and 4 expressed a better performance in the four determinations by the SVIS®.
In the second evaluation period, lot 5 had the worst performance for all variables in both periods (Table 2),
whereas at five days after sowing, in general, lots 1 and 2 were classified as most vigorous, shown by seedling length
and other indexes provided by the SVIS®. At six days
after sowing, lots 1, 2, 3, and 4 did not differ in regard to
physiological potential in seedling length and in the vigor and growth indexes, while the uniformity index highlighted lots 1 and 2 as having greater uniformity of germination.
After twelve months of storage (third evaluation period),
lots 2, 3, and 4 presented greater vigor than lots 1 and 5 at five
days after sowing. Nevertheless, at six days after sowing, the lots were separated into more vigor classes, and lot 3 had the
best performance for all variables. The fact that classification at five days was less detailed than at six days may be related
to seed deterioration after one year of storage. Consequently, smaller seedlings were obtained in all lots, making it more
difficult to segregate them according to vigor.
Aiming to achieve greater reliability in the use of computerized seedling image analysis for evaluation of onion seed vigor, the same tests were conducted with seeds of the cultivar Bella Vista (Table 3).
Initially, higher germination percentages were observed
in lots 3, 4, and 5, which did not differ and had germination
percentages above 90% (Table 3). Lot 2 had germination of
84%, differing from the others, but it remained within the standard for sale of onion seeds, which is 80% for certified and non-certified seeds (Brasil, 1986). Lot 1 had the lowest
mean percentage, with 71% of germination.
From the evaluation of first germination count and of the accelerated aging test in the first evaluation period (Table 3), lots 3 and 4 of the Bella Vista cultivar could be classified as having
the highest vigor. The seedling emergence percentage and
speed did not allow differentiation of the lots in regard to vigor, though the electrical conductivity test allowed classification of lot 1 as having the lowest vigor, differing from the other lots.
Six months after the first evaluation (second evaluation
Table 3. Mean values of germination percentage (GP), first germination count (FGC), electrical conductivity (EC), seedling emergence percentage (EP), seedling emergence speed index (ESI), and accelerated aging (AA), of five onion seed
lots of the cultivar Bella Vista in three evaluation periods.
Period Lot GP FGC EP ESI AA EC
--- (%) --- µS. cm-1. g-1
First
1 71 c 71 b 80 a 4.99 a 40 d 424.79 a
2 84 b 64 b 80 a 4.88 a 53 c 310.04 b
3 95 a 85 a 94 a 6.12 a 80 a 253.64 b
4 91 a 88 a 90 a 5.78 a 81 a 260.95 b
5 92 a 72 b 89 a 5.51 a 66 b 279.02 b
CV (%) 4.04 7.90 9.05 11.63 10.63 9.05
Second
1 79 b 51 b 83 b 4.55 b 21 d 443.76 a
2 84 b 37 c 81 b 4.30 b 18 d 344.34 b
3 96 a 55 b 89 a 4.93 a 47 b 293.21 c
4 94 a 76 a 94 a 5.39 a 71 a 285.29 c
5 87 b 45 c 92 a 5.00 a 36 c 313.54 c
CV (%) 6.75 13.50 5.88 7.88 12.26 6.84
Third
1 81 b 46 c 63 b 3.47 c 2 b 489.26 a
2 84 b 31 d 68 b 3.64 c 5 b 396.07 b
3 94 a 59 b 94 a 5.33 b 14 a 364.61 b
4 93 a 76 a 95 a 6.06 a 19 a 354.33 b
5 92 a 53 b 87 a 4.80 b 8 b 379.09 b
CV (%) 5.54 13.16 10.07 11.95 17.78 9.00
period), lots 3 and 4 maintained the highest mean values for
germination percentage (Table 3). The other vigor tests confirmed this tendency of classification, although the first germination count and accelerated aging stratified the lots in more vigor levels.
These tests highlighted lot 4 as having the best performance, followed by lot 3, while the seedling emergence percentage, the seedling emergence speed index, and electrical conductivity grouped lots 3, 4, and 5 together as the most vigorous.
Kikuti and Marcos-Filho (2012), studying lettuce seeds, found that the accelerated aging test and germination speed
test were the tests that best classified the lots in different levels
of vigor and that the seedling growth index and primary root length obtained from the SVIS® software led to results similar
to those of the traditional tests, and they were effective for
evaluating lettuce seed vigor. These same authors highlight the speed in obtaining results from the use of the SVIS®, along
with less human interference during evaluations.
In the third evaluation period, classification of the lots
followed the same pattern found in the previous periods. Lot 4 stood out as the most vigorous, for all the tests, and was always followed by lot 3 (Table 3). The most sensitive tests stratify lots into vigor levels during this evaluation period were
first germination count and seedling emergence speed, which
separated the lots into four and three classes, respectively. The results obtained from computerized seedling image
analysis during the first two evaluation periods for the
cultivar Bella Vista, initially and after six months of storage, distinguished lots 3 and 4 as possessing highest vigor and lot 2
as the lowest, at both five and six days after sowing (Table 4). In
the last evaluation period, though following the same tendency as the previous periods, lot 4 stood out as the most vigorous,
highlighted by seedling length at five days and by seedling
length, and vigor and growth indexes at six days.
Homogeneity was observed in the classification of the lots at five and at six days after sowing, for all three evaluation
periods. This result is positive from the perspective that
enables the recommendation of evaluations at five days after
sowing, since this allows greater speed in obtaining vigor results without compromising the quality of the information. Mondo et al. (2011) found vigor evaluation for maize seeds to
be effective in young seedlings at two days after sowing and two days before the first germination count.
Correlation between the traditional tests and image analysis
is important for adaptation or refinement of the methodology
evaluated, especially for determining the best age of seedlings to conduct the analysis. Interpretation of the magnitude of the
correlation coefficients is still considered complex, considering
that the standards of reference are subjective, and there are
no defined values yet for these correlations. However, there
is consensus that the nearer the correlation is to -1 or 1, the
Table 4. Mean values of vigor (VI), growth (GI), uniformity (UI), and seedling length (SL) indexes, obtained by the SVIS®
software at 5 and 6 days after sowing, of five onion seed lots of the cultivar Bella Vista in the three evaluation periods.
Period Lot --- 5 days --- --- 6 days ---
SL VI GI UI SL VI GI UI
First
1 0.79 b 721 b 687 a 802 b 1.42 b 753 b 721 b 830 b
2 0.50 d 590 d 535 c 721 c 1.09 c 667 c 619 c 784 c
3 0.92 a 770 a 738 a 845 a 1.64 a 813 a 793 a 862 a
4 0.92 a 773 a 732 a 870 a 1.66 a 818 a 795 a 875 a
5 0.70 c 673 c 624 b 801 b 1.40 b 747 b 712 b 831 b
CV (%) 9.63 5.45 9.06 4.72 11.13 6.29 8.13 4.53
Second
1 0.63 b 627 b 559 b 793 b 1.21 b 710 b 668 b 810 b
2 0.47 c 550 c 475 c 728 c 0.94 c 603 c 529 d 779 c
3 0.73 a 668 a 600 a 829 a 1.58 a 789 a 753 a 875 a
4 0.77 a 693 a 628 a 848 a 1.56 a 791 a 755 a 878 a
5 0.57 b 605 b 534 b 771 b 1.24 b 690 b 629 c 834 b
CV (%) 16.51 8.30 11.74 6.31 9.53 5.54 7.67 4.51
Third
1 0.46 c 567 b 490 b 751 b 0.74 c 549 c 459 c 761 b
2 0.22 d 415 c 328 c 617 c 0.70 c 558 c 492 c 715 c
3 0.57 b 626 a 557 a 789 a 1.07 b 656 b 581 b 832 a
4 0.66 a 660 a 588 a 830 a 1.28 a 746 a 705 a 844 a
5 0.41 c 539 b 461 b 723 b 1.13 b 693 b 645 a 805 a
CV (%) 18.53 9.73 15.09 6.49 16.00 8.75 13.14 5.00
stronger is the dependence of one variable in relation to another. Figueiredo Filho and Silva Junior (2009) cited that a correlation
coefficient from 0.1 to 0.3 is considered weak, from 0.4 to 0.6,
moderate, and above 0.7, strong.
The highest correlations were found between the tests of
first germination count, seedling emergence percentage and
speed index, and the determinations of the SVIS®, both at five
and at six days after sowing (Table 5). This high correlation can be explained from the fact that all these tests evaluate
seedling performance, reinforcing the effectiveness and
corroboration of seedling image analysis with the evaluation of onion seeds vigor.
The correlation between the determinations obtained by the SVIS® and the accelerated aging test and electrical
conductivity test were all significant, except for uniformity at five and six days. However, this correlation was moderate. This observation confirms the information obtained during
the previous analyses, in which, in spite of coincidence during
classification of lots with higher and lower vigor, lots with
intermediate vigor respond in diverse manners depending on the test and evaluation period, and this is expected upon
comparing different vigor tests.
Conclusions
Vigor differences can be identified between onion seed
lots through the Seed Vigor Imaging System (SVIS®) in a
manner similar to traditional vigor tests. Evaluation should be
performed at five days after sowing.
References
ALVARENGA, R.O.; MARCOS-FILHO, J.; GOMES JUNIOR, F.G. Avaliação do vigor de sementes de milho por meio da análise computadorizada de imagens de plântulas. Revista Brasileira de Sementes, v.34, n.3, p.488-494, 2012. http://www.scielo.br/pdf/rbs/
v34n3/17.pdf
BRASIL. Ministério da Agricultura, Pecuária e Abastecimento. Portaria no. 457, de 18 de dezembro de 1986. Estabelece os padrões de sementes olerícolas para distribuição. Diário Oficial da União, Poder Executivo, Brasília, DF, p.19653, 23 dez. 1986. 395p.
BRASIL. Ministério da Agricultura, Pecuária e Abastecimento. Regras para análise de sementes. Ministério da Agricultura, Pecuária e Abastecimento. Secretaria de Defesa Agropecuária. Brasília, DF: MAPA/ACS, 2009. 395p. http://www.agricultura.gov.br/arq_editor/ file/2946_regras_analise__sementes.pdf
CHIQUITO, A.A.; GOMES JUNIOR, F.G.; MARCOS-FILHO, J. Assessment of physiological potential of cucumber seeds using the software Seedling Vigor Imaging System® (SVIS®). Revista Brasileira de Sementes, v.34, n.2, p.255-263, 2012. http://www. scielo.br/pdf/rbs/v34n2/10.pdf
DIAS, D.C.F.S.; BHERING, M.C.; TOKUHISA, D.; HILST, P.C. Teste de condutividade elétrica para avaliação do vigor de sementes de cebola. Revista Brasileira de Sementes, v.28, n.1, p.154-162, 2006. http://www.scielo.br/pdf/rbs/v28n1/a22v28n1.pdf
FIGUEIREDO FILHO, D.B.; SILVA JUNIOR, J.A. Desvendando os mistérios do coeficiente de correlação de Pearson (r). Revista Política Hoje, v.18, n.1, p.115-146, 2009. http://www.revista.ufpe. br/politicahoje/index.php/politica/article/viewFile/6/6
GOMES JUNIOR, F.G.; CHAMMA, H.M.C.P.; CÍCERO, S.M. Automated image analysis of seedling for vigor evaluation of common bean seeds. Acta Scientiarum, v.36, n.2, p.195-200, 2014. http://www.scielo.br/pdf/asagr/v36n2/v36n2a08.pdf
HOFFMASTER, A.L.; FUJIMURA, K.; McDONALD, M.B.; BENNET, M.A. An automated system for vigour testing three-day-old soybean seedlings. Seed Science and Technology, v.31, p.701-713, 2003. http://www.ingentaconnect.com/content/ista/ sst/2003/00000031/00000003/art00019
HOWARTH, M.S.; STANWOOD, P.C. Measurement of seedling growth rate by machine vision. Transactions of American Society of Agricultural Engineering, v.36, n.3, p.959-963, 1993. http://pubag. nal.usda.gov/pubag/downloadPDF.xhtml?id=16226&content=PDF
Table 5. Estimated simple Pearson correlation coefficients between the traditional vigor tests, first germination count (FGC),
emergence percentage (EP), emergence speed index (ESI), accelerated aging (AA), and electrical conductivity, and the determinations obtained by the SVIS®, seedling length (SL), and vigor (VI), growth (GI), and uniformity (UI)
indexes, 5 and 6 days after sowing for five onion seed lots of the cultivars Bella Catarina and Bella Vista.
Traditional tests --- 5 days --- --- 6 days ---
SL VI GI UI SL VI GI UI
FGC 0.8056* 0.8197* 0.7948* 0.8521* 0.7790* 0.7964* 0.7774* 0.7924*
EP 0.6065* 0.6012* 0.5634* 0.7443* 0.7120* 0.7153* 0.6793* 0.8396*
ESI 0.7390* 0.7483* 0.7253* 0.7753* 0.7554* 0.7774* 0.7550* 0.7946*
AA 0.5100* 0.5116* 0.5307* 0.3354 0.5520* 0.5420* 0.5616* 0.3000
EC -0.5865* -0.5855* -0.6036* -0.3946* -0.6244* -0.6144* -0.6284* -0.4099*
JIANHUA, Z.; McDONALD, M.B. The saturated salt accelerated aging test for small-seeded crops. Seed Science and Technology, v.25, p.123-131, 1996. http://cat.inist. fr/?aModele=afficheN&cpsidt=2682143
KIKUTI, A.L.P.; MARCOS-FILHO, J. Seedling imaging analysis and traditional tests to assess okra seed vigor. Journal of Seed Science, v.35, n.4, p.443-448, 2013. http://www.scielo.br/pdf/jss/ v35n4/05.pdf
KIKUTI, A.L.P.; MARCOS-FILHO, J. Testes de vigor em sementes de alface. Horticultura Brasileira, v.30, p.44-50, 2012. http://www. scielo.br/pdf/hb/v30n1/v30n1a08
MARCOS- FILHO, J. Seed vigor testing: an overview of the past, present and future perspective. Scientia Agricola, v.72, n.4, p. 365-374, 2015. http://www.scielo.br/pdf/sa/v72n4/0103-9016-sa-72-4-0363.pdf
MARCOS-FILHO, J. Teste de envelhecimento acelerado. In: KRZYZANOWSKI, F.C.; VIEIRA, R.D.; FRANÇA-NETO, J.B. (Ed.). Vigor de sementes: conceitos e testes. Londrina: ABRATES, 1999. cap.3, p.1-24.
MARCOS-FILHO, J.; BENNETT, M.A.; McDONALD, M.B.; EVANS, A.F.; GRASSBAUGH, E.M. Assessment of melon seed vigour by an automated computer imaging system compared to traditional procedures. Seed Science and Technology, v.34, n.2, p. 485-497, 2006. http://www.ingentaconnect.com/content/ista/ sst/2006/00000034/00000002/art00023
MARCOS-FILHO, J.; KIKUTI, A.L.P.; LIMA, L.B. Métodos para avaliação do vigor de sementes de soja, incluindo a análise computadorizada de imagens. Revista Brasileira de Sementes, v.31, n.1, p.102-112, 2009. http://www.scielo.br/pdf/rbs/v31n1/a12v31n1.pdf
McCOMARK, A.C.; KEEF, P.D.; DRAPER, R.S. Automated vigour testing of field vegetables using image analysis. Seed Science and Technology, v.18, n.1, p.103-112, 1990. http://www.cabdirect.org/ abstracts/19920314171.html
MONDO, V.H.V.; DIAS, M.A.N.; McDONALD, M.B. Seed vigor imaging system for two-day-old corn seedling evaluation. Seed Technology, v.33, n.2, p.191-196, 2011. http://www.jstor.org/ stable/23433428?seq=1#page_scan_tab_contents
PANOBIANCO, M.; VIEIRA, R.D.; PERECIN, D. Electrical conductivity as an indicator of pea seed aging of stored at different temperatures. Scientia Agricola, v.64, n.2, p.119-124, 2007. http:// www.scielo.br/pdf/sa/v64n2/a03v64n2.pdf
PANOBIANCO, M.; VIEIRA, R.D. Electrical conductivity and deterioration of soybean seeds exposed to different storage conditions. Revista Brasileira de Sementes, v.29, n. 2, p.97-105, 2007. http://www.scielo.br/pdf/rbs/v29n2/v29n2a13.pdf
RODO, A.B.; MARCOS-FILHO, J. Accelerated aging and controlled deterioration for the determination of the physiological potential of onion seeds. Scientia Agricola, v.60, n.3, p.465-469, 2003.http:// www.scielo.br/pdf/sa/v60n3/16399.pdf
SAKO, Y.; McDONALD, M.B.; FUJIMURA, K.; EVANS, A.F.; BENNETT, M.A. A system for automated seed vigour assessment. Seed Science and Technology, v.29, n.3, p.625-636, 2001. ftp://199.133.61.40/pub/incoming/RSinARS/cssa/McDonald2.pdf
SILVA, C.B.; LOPES, M.M.; MARCOS-FILHO, J.; VIEIRA, R.D. Automated system of seedling image analysis (SVIS) and electrical conductivity to assess sun hemp seed vigor. Revista Brasileira de Sementes, v.34, n.1, p.55-60, 2012. http://www.scielo.br/pdf/rbs/ v34n1/a07v34n1.pdf
SILVA, V.N.; CÍCERO, S.M. Análise de imagens de plântulas para avaliação do potencial fisiológico de sementes de berinjela. Horticultura Brasileira, v.32, n.2, p.145-151, 2014a. http://www. scielo.br/pdf/hb/v32n2/0102-0536-hb-32-02-00145.pdf
SILVA, V.N.; CÍCERO, S.M. Image seedling analysis to evaluate tomato seed physiological potential. Revista Ciência Agronômica, v.45, n.2, p.327-334, 2014b. http://www.scielo.br/pdf/rca/v45n2/ a14v45n2.pdf