Food Science and Technology ISSN 0101-2061
DI:
D http://dx.doi.org/10.1590/1678-457X.6624
1 Introduction
Fish is one of most important animal source of food for a healthy diet. It is rich in amino acids, unsaturated fatty acids, vitamins, and trace metals. Furthermore, it is easy to digest due to lack of connective tissue (Burger et al., 1999; Kızılaslan & Nalıncı, 2013; Dğuzhan et al., 2009; Turan et al., 2006). Several researchers have investigated the nutritional value of fish and its importance in human diet from various perspectives. Some studies revealed that fish consumption helps preventing cardiovascular diseases, high blood pressure, cholesterol, Alzheimer’s disease, and various types of cancer (Barberger-Gateau et al., 2002; McNaughton et al., 2008; Pieniak et al., 2008; Turan et al., 2006; Verbeke & Vackier, 2005).
It is a well-known fact that the production of fish and fisheries worldwide is approximately 154 million tons per year, and their consumption is 18.5 per capita per year. Turkey has a crucial potential in terms of fishery products due to its lakes, dams, and rivers and also because it is surrounded by sea on three sides. Having 8300 km of shoreline and more than 1.5 million hectares of inland water, Turkey’s consumption of fish and seafood is lower than the world average consumption, 8.2 kg per capita per year (Aydın et al., 2011; Food and Agriculture Drganization of the
United Nations, 2013). Studies conducted in different regions of Turkey showed that fish consumption is between 5.06 and 13.41 kg per capita per year (Cevger et al., 2008; Erdal & Esengün, 2008; Hatırlı et al., 2007; Karakaş, 2010; Karakuş et al., 2008; Kızılaslan & Nalıncı, 2013; Dğuzhan et al., 2009). Additionally, local studies in Turkey, except for Çolakoğlu et al. (2006), also show that fish consumption in Turkey is far below the world and EU average consumption. Aydın et al. (2011) reported that fish and fishery product consumption in Turkey steadily increased from 1994 to 2006. Can et al. (2012) found that an increase in and/or maintenance of the level of fish consumption will lead to a rise in production and have a positive effect on employment and exports.
Fish consumption, frequency, and preferences are affected by consumers’ geographic, social, and cultural characteristics (Burger et al., 1999; Pieniak et al., 2011; Verbeke & Vackier, 2005). It is known that food preferences are also affected by a number of sensory (taste, smell, texture etc…) and non-sensory factors (behavior, beliefs, personal characteristics, risk perception, etc…) (Honkanen et al., 2005). In Turkey, fish is mostly consumed fresh, while in other countries, it is generally consumed processed
Fish consumption preferences and factors influencing it
Mehmet Ferit CAN1*, Aytekin GÜNLÜ2, Hayriye Yeşim CAN3
Received 21 Jan., 2015 Accepted 19 Mar., 2015
1 Department of Animal Health Economics and Management, Faculty of Veterinary Medicine, Mustafa Kemal University, Antakya, Hatay, Turkey 2 Department of Livestock Economics and Management, Faculty of Veterinary Medicine, Selçuk University, Selçuklu, Konya, Turkey
3 Department of Food Hygiene and Technology, Faculty of Veterinary Medicine, Mustafa Kemal University, Antakya, Hatay, Turkey
*Corresponding author: [email protected]
Abstract
Fish consumption preferences are affected by individuals’ socioeconomic characteristics. The aims of the present paper were (i) to obtain information on fish consumption level and frequency; (ii) to investigate the associations between the socioeconomic characteristics of consumers and their preferences; and (iii) to examine the influence of determinants on fish consumption. Data were gathered through a questionnaire completed by a total of 127 randomly selected individuals from different socioeconomic backgrounds from the Antakya, Turkey. The average consumption was found to be 2.98 kg/person/year for fish. Anchovies, gilt-head sea bream, and sea bass were reported as the most consumed three species, respectively. Significant differences in fish consumption were found among age groups, gender groups, and education groups, as well as between marital statuses. A majority of the consumers eat fish once a month throughout the year or only during the winter months. Fish consumption level and frequency were significantly positively correlated with education (p<0.01), income (p<0.05) and total meat consumption (p<0.01). The stepwise multiple regression model explained 41.7% (p<0.01) of the total variance for fish consumption. The amount and frequency of the consumption in the region, which is very far below the world and Turkey average especially for lower socioeconomic groups and for less-consumed fish species, can be increased by certain policies, such as training, advertising and different marketing strategies. Moreover, consumption should be distributed equally throughout the year instead of consuming only in certain seasons.
Keywords: fish; consumer; consumption; economic; preference.
(Food and Agriculture Drganization of the United Nations, 2013). Fish consumption figures in Turkey may significantly vary between the coastal and inland regions. Antakya is a province that reflects the social, economic, and cultural status of the Middle East and Turkey, with its multi-cultural ethnic structure and geographic location in the Eastern Mediterranean Region (Doğruel & Leman, 2009).
To our knowledge, there are no studies on the factors affecting fish consumption preferences in that region. The aims of the present paper were (i) to obtain information on fish consumption level and frequency; (ii) to investigate the associations between the socioeconomic characteristics of consumers and their preferences; and (iii) to examine the influence of determinants on fish consumption. It is believed that the results of this research will assist stakeholders in the decision-making process regarding the amount of production, product diversity, and sales policies, and it can also contribute to nutrition policies in both regional and national scales.
2 Material and methods 2.1 Data collection
Primary data were gathered through a questionnaire answered by 127 randomly selected individuals that have different socio-cultural and socio-economic backgrounds and are from Antakya, Turkey, a medium-sized city located in the Mediterranean region of south–central Turkey (36°15’N, 36°08’E), near the border with Syria. It has a multi-ethnic and multicultural population (Doğruel & Leman, 2009). The minimum number of sample size for this study was calculated according to the following assumptions; expected fish consumption rate of 91%, obtained from pre-tested questionnaires; sampling error of 5%; and 95% confidence interval (Ören & Biçkes, 2011; Rodriguez del Aguila & Gonzalez-Ramirez, 2013). Data collection began in February 2012 and continued until the end of May 2012. Prior to the start of the field research, the questionnaire was pre-tested on consumers for appropriate changes if necessary (Verbeke & Viaene, 1999).
2.2 Data evaluation
To calculate annual fish consumption for each respondent, 22 of the most commonly consumed fish species were determined using pre-tested questionnaires. Afterwards, the questionnaires on annual fish consumption were answered. Fish consumption frequency was measured using a five-point category scale and coded in descending order as follows: (I) more than once a week, (II) once a week, (III) more than once a month (two or three times), (IV) once a month, and (V) more than once a year (Pieniak et al., 2011). Consumers’ annual consumption levels were divided into subgroups according to their age, gender, marital status, profession, education level, and income level. The subgroups’ consumption levels were compared to each other.
2.3 Statistical analysis
Scatter diagrams were used to investigate the possible relationship between variables. The relationship between the consumers’ socioeconomic characteristics and fish consumption
levels and frequency were analyzed using correlation coefficients. The Fisher’s exact test (Chi-square) was used to verify possible associations between the consumers’ characteristics and fish consumption habits (Can, 2014; Can & Altuğ, 2014). Multiple linear regression (MLR) was used to examine the influence of determinants on fish consumption. In this study, fish consumption level was selected as the dependent variable. Age of consumer, income level, total meat consumption (except for fish), the total number of fish species consumed by the responents, and the consumer gender (used as a dummy variable) were selected as the independent candidate variables. Stepwise procedures were used and a model was constructed. Stepwise regression procedures have been used to identify only the predictive attributes that significantly improve the regression at given level. This method is explained as a combination of forward selection and backward elimination procedures (Draper & Smith, 1998; Qiu et al., 2010). In the present study, the linear relationship between each dependent and independent variable taken into account was examined using scatter diagrams. Autocorrelation and multicollinearity were examined by Durbin-Watson statistics and Variance Inflation Factors (VIF), respectively. In order to reduce the influence of extreme values and make the distribution closer to the normal distribution, a logarithmic transformation (using log10) was applied to all continuous variables. The MLR can be formulated as follows (Equation 1),
Y = β0 + β1X1 + β2X2 +……..+ βkXk + Ɛ (1)
where: Y is the dependent variable, X is the independent or regressor variable, k is the number of independent variables, β is the constant and subsequent β are the coefficients, and Ɛ is a term that includes the effects of unmodelled sources of variability that affect the dependent variable (Agha & Alnahhal, 2012).
The final dependent and independent variables are as follows (Equation 2):
log10Y = β0+ β1log10X1+ β2 log10X2 +Ɛ (2)
where: Y is the fish consumption level (kg/year), X1 is the total mumber of fish species consumed by the individuals (number), and X2 is the age of consumers (year).
3 Results and discussion
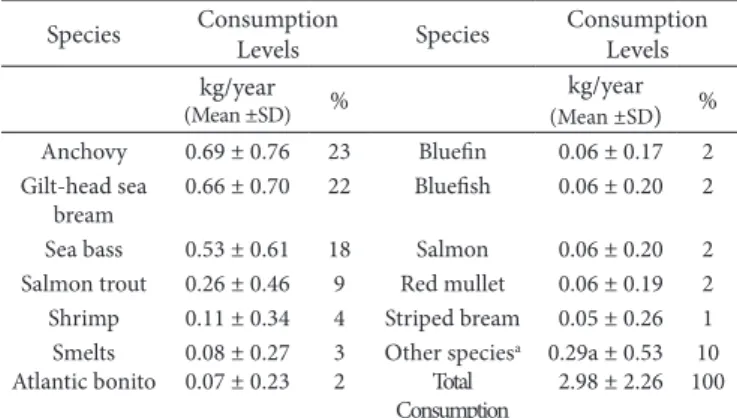
In this study, the respondents’ average fish consumption was 2.98 kg/year. This is equivalent to 13% of the 22.9 kg, which was found to be the respondents’ total annual meat consumption (19.92 kg is other types of meat and 2.98 kg is fish meat). Annual fish consumption levels according to the amount and number are shown in Table 1. Anchovies, gilt-head sea bream, and sea bass were reported as the three most consumed and preferred species, respectively. The five most frequently consumed fish species accounted for 76% of total consumption. Dnly twelve respondents (9% of the total respondents) reported that they had never ate fish and fish products.
Consumption level between students and young people was almost two times greater than that of the other professions and age groups, respectively. Table 2 shows that there were no significant differences in consumption level between profession
and income groups. Females’ annual fish consumption level was 1.19 kg more than that of males’ consumption level.
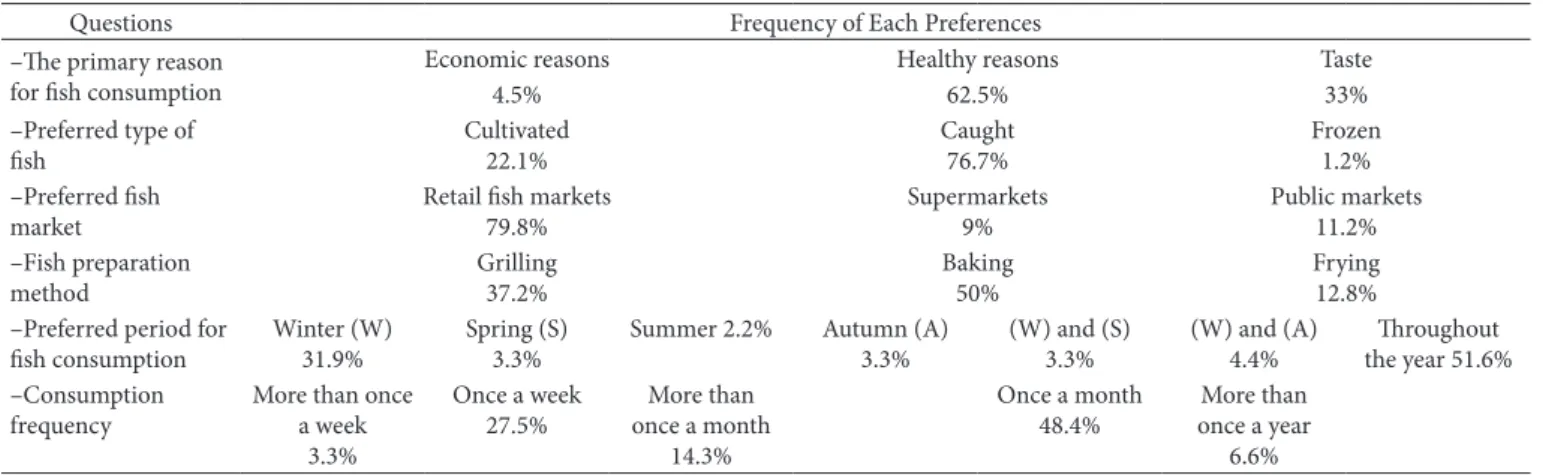
Certain consumers’ habits and preferences are summarized in Table 3. As a result of this study, it was detected that health concerns play an important role in the selection of fish consumption. The majority of the consumers eat fish once a month throughout the year or during the winter only. Baking was indicated as the preferred method of preparing fish.
Significant associations between the respondents’ socioeconomic factors and consumption preferences are presented in Table 4. There was a significant relationship between education level and “the primary reason for fish consumption”; education level and “fish preparation method”; gender and “fish preparation method”; and income level and “preferred type of fish”. There was no association between “primary reason for fish consumption”, “preferred type of fish”, and “fish preparation method” with the other consumers’ characteristics and preferences (Chi-square).
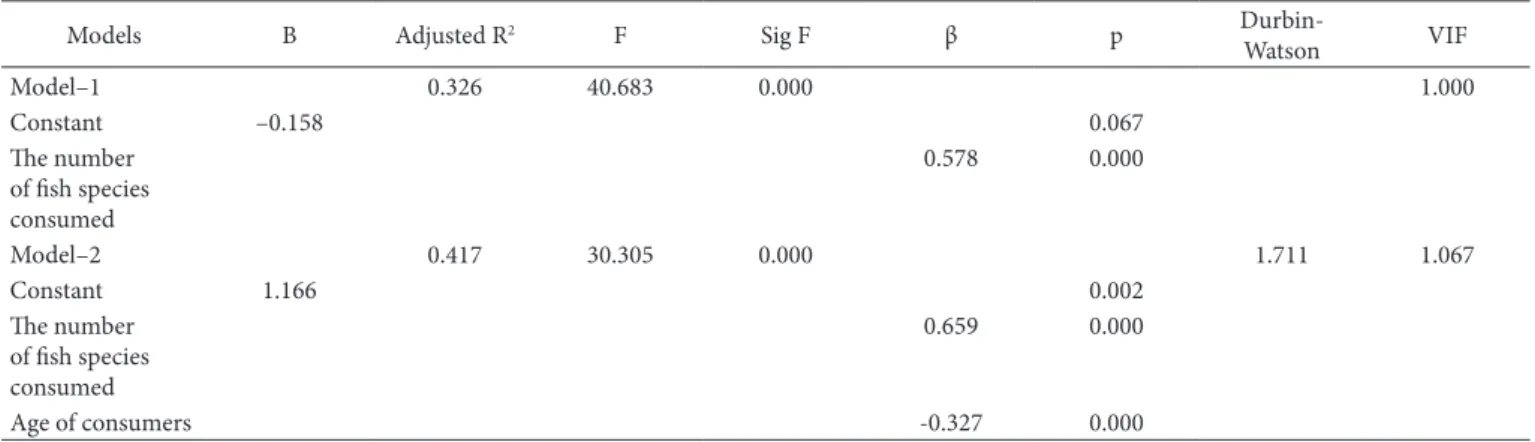
Correlations between consumers’ characteristics and fish consumption values are summarized in Table 5. There were significant and positive correlations between consumption values and education (p<0.01), income (p<0.05), and total meat consumption (except for fish) (p<0.01). The correlation matrix of the variables involved, the model, and regression model results are given in Table 6 and 7. Regression analysis indicated that the model does not show major autocorrelation (see Durbin-Watson statistics) and multicollinearity (see VIF statistics) problems. As a result of regression analysis, it was found that 41.7% (p<0.01) of the total variance were explained by the model. The total number of fish species consumed by the responents and the age of the consumers were found to be significant predictors for fish consumption. The following MLR formula was obtained (Equation 3):
Fish consumption (kg/year) = 1.166 + 0.659
(total number of fish species consumed) – 0.327 (consumer’s age) (3)
Consumers’ specific opinions about fish consumption and prices, as well as the primary issues and problems observed at the fish markets are given in Figure 1. According to the majority of the respondents, public fish consumption was quite low. In retail fish markets, the most important factor to be improved is hygiene. It was found that if production is increased and public awareness and perception is changed in a positive way, this will lead to increased fish consumption. According to a small number of respondents (12%), believe that inspections by government agencies and monetary penalties concerning retail fish markets are adequate. However, 73% and 15% of the respondents would like to increase inspections by government agencies and monetary penalties, respectively.
Although Antakya is a coastal city, its fish consumption is very low. The reason for this may be that red meat plays an important role in the dietary habits in the Middle East and Turkey. It is known that people prefer chicken to white meat, and that bovine meat is the preferred type of red meat in Turkey (Cevger et al., 2008; Karakuş et al., 2008; Şeker et al., 2011). Fish consumption levels in Antakya, 8.16 g/day, is quite below the average in Turkey (~19 g/day), the EU (~48 g/day), and the world Table 1. Annual fish consumption considering the most commonly
consumed species in the province of Antakya.
Species Consumption
Levels Species
Consumption Levels kg/year
(Mean ±SD) %
kg/year
(Mean ±SD) % Anchovy 0.69 ± 0.76 23 Bluefin 0.06 ± 0.17 2 Gilt-head sea
bream
0.66 ± 0.70 22 Bluefish 0.06 ± 0.20 2
Sea bass 0.53 ± 0.61 18 Salmon 0.06 ± 0.20 2 Salmon trout 0.26 ± 0.46 9 Red mullet 0.06 ± 0.19 2 Shrimp 0.11 ± 0.34 4 Striped bream 0.05 ± 0.26 1
Smelts Atlantic bonito
0.08 ± 0.27 0.07 ± 0.23
3 2
Dther speciesa
Total Consumption
0.29a ± 0.53 2.98 ± 2.26
10 100
aThe consumption level of Haddock, Catfish, Grouper, Grey Mullet, Carp, Flounder,
Mussels, Calamari, Squid, Sardines that were lower than 0.05 kg/year (less than 1% of the total consumption) were classified as other species.
Table 2. Annual fish consumption levels according to different socioeconomic subgroups in the province of Antakya.
Personal
Characteristics N %
Fish Consumption
(kg/year) (Mean ±SD) p-Value ―Age
Young 36 31 4.38 ± 2.98 < 0.01
Middle-aged 64 56 2.32 ± 1.63
Elderly 15 13 2.32 ± 0.74
―Gender
Male 72 34 2.59 ± 1.69 < 0.05
Female 43 66 3.76 ± 2.99
―Marital Status
Single 37 32 3.92 ± 2.99 < 0.01
Married 78 68 2.40 ± 1.42
―Profession
Public Dfficer 44 38 2.79 ± 1.69 > 0.05 Private Sector 36 32 2.84 ± 2.40
Self-Employed 16 14 2.25 ± 2.14
Retired 6 5 2.51 ± 0.71
Student 13 11 4.57 ± 3.06
―Education Level
Primary School 10 9 0.98 ± 0.63 < 0.01 High School
University Degree 37 46
32 40
2.22 ± 1.04 3.52 ± 2.51 Graduate Degree 22 19 3.76 ± 2.70 ―Income Class
(TLa/month)
Less than 999 42 37 2.93 ± 2.81 > 0.05
1000-1999 55 30 2.81 ± 1.99
2000-2999 20 17 3.38 ± 2.08
3000-4999 10 9 2.56 ± 1.45
More than 5000 8 7 3.33 ± 1.31 ―All respondents 115 100 2.98 ± 2.26
(min:0.25, max:11.50)
9% of the respondents reported that they never consume fish because of the taste, smell and bones. Cevger et al. (2008) found that twenty-two percent of the students at Ankara University do not consume any fish at all, and the daily average fish consumption is 15 g. The present study has revealed that consumption levels of single individuals and students, which constitute the young population, are higher than that of other groups’. This situation may have a positive effect on fish consumption in the future.
The types of fish that are produced in Turkey are trout, sea bass, and gilt-head sea bream, and the types that are most frequently caught are anchovy, Atlantic bonito, and black spot sea bream, respectively. Anchovies, which are caught in the Black Sea and the Marmara Sea, account for 52% (163.981 tons) of all fish types that are caught in Turkey (Turkish Statitical Institute,
Table 3. Consumer preferences for fish consumption in the province of Antakya.
Questions Frequency of Each Preferences
–The primary reason for fish consumption
Economic reasons Healthy reasons Taste
4.5% 62.5% 33%
–Preferred type of fish
Cultivated 22.1%
Caught 76.7%
Frozen 1.2% –Preferred fish
market
Retail fish markets 79.8%
Supermarkets 9%
Public markets 11.2% –Fish preparation
method
Grilling 37.2%
Baking 50%
Frying 12.8% –Preferred period for
fish consumption
Winter (W) 31.9%
Spring (S) 3.3%
Summer 2.2% Autumn (A) 3.3%
(W) and (S) 3.3%
(W) and (A) 4.4%
Throughout the year 51.6% –Consumption
frequency
More than once a week
3.3%
Dnce a week 27.5%
More than once a month
14.3%
Dnce a month 48.4%
More than once a year
6.6%
Table 4. Associations between socioeconomic factors and certain consumption preferences.
Economic reasons Healthy reasons Taste Total
–Education Level N % N % N % N %
Primary 0 0 7 70.0 3 30.0 10 100
High 0 0 27 72.9 10 27.1 37 100
Graduate 5 10.8 19 41.4 22 47.8 46 100
Postgraduate 0 0 18 81.8 4 18.2 22 100
Fisher’s exact Chi-square χ² = 12 676 ; p < 0.05
–Education Level Grilling Baking Frying Total
Primary 0 0 10 100 0 0 10 100
High 10 27.0 23 62.2 4 10.8 37 100
University degree 22 47.8 20 43.4 4 8.6 46 100
Graduate degree 10 45.4 5 22.7 7 31.8 22 100
Fisher’s exact Chi-square χ² = 15 221 ; p < 0.01
–Gender Grilling Baking Frying Total
Female 14 32.6 16 37.2 13 30.2 43 100
Male 28 38.8 40 55.6 4 5.6 72 100
Fisher’s exact Chi-square χ² = 8 850 ; p < 0.05
–Income Class Cultivated Caught Total
Less than TL 999 4 9.6 38 90.4 42 100
TL 1000 – TL 2999 14 25.4 41 74.6 55 100
More than TL 3000 8 44.4 10 55.6 18 100
Fisher’s exact Chi-square χ² = 6 844 ; p < 0.05
2011). It is envisaged that the interest in the above mentioned fish types will continue in the coming years, as well. Dther studies conducted in Turkey have also revealed that anchovies are the most frequently consumed type of fish in Turkey (Erdal & Esengün, 2008; Karakaş, 2010; Kızılaslan & Nalıncı, 2013; Dğuzhan et al., 2009). A study conducted on Asian Americans revealed that the most frequently consumed types of fish are salmon and tuna, and the most frequently consumed type of seafood is shellfish. Furthermore, this study on Asian Americans also revealed that more than 75% of the participants consumed shrimp and crab on regular basis (Sechena et al., 2003).
The season and frequency of fish consumption are other important issues. Fifty-one percent of the participants in the current study consume fish throughout the year (Table 3). Erdal & Esengün (2008) indicated that fish consumption particularly increases during the winter. In our opinion, consuming fish throughout the year is better for a balanced and healthy diet. Forty-eight percent of the participants in this study stated that they consume fish once a month, and 27% said they consume fish once a week. The ratio of participants who consume fish
more than once a week is only 3% (Table 3). A study carried out by Çolakoğlu et al. (2006) in Turkey revealed that 46% of consumers eat fish at least once a week. In the United States, the ratio of people who consume seafood regularly or frequently (once or more than once a week) is 46%, the ratio of those who consume fish a couple of times a month is 29%, and the ratio of those who consume fish at least once a month or less frequently is 25% (Hicks et al., 2008). It was also found that twenty-five percent of the consumers in Belgium, Denmark, and the Netherlands, and 75% of the consumers in Spain consume fish at least twice a week (Pieniak et al., 2008).
It is known that education and income levels might have an effect on fish consumption (Burger et al., 1999; Hicks et al., 2008). In the present study, a meaningful relationship was found between education and consumption level and frequency (Table 5). Myrland et al. (2000) stated that university graduates consume more fish compared to others. A study conducted in France revealed that individuals who have a Bachelor’s degree are more interested in fish-based diets (Barberger-Gateau et al., 2002). A study conducted in the United States revealed, however, that there is an inverse relation between fish consumption and education and income levels, which does not correspond to the general literature reviews (Burger et al., 1999). Çolakoğlu et al. (2006) stated that there is no association between education level and fish consumption and frequency, but unlike the outcome of the present study, there is a meaningful relationship between income level and fish consumption. Verbeke & Vackier (2005) mentioned that people with lower income and in the younger age groups tend to consume less fish, but there is no meaningful relationship between education and fish consumption frequency. Sechena et al. (2003) stated there is no significant difference between men and women or among different age groups; however, Sarıözkan et al. (2007) claimed that women consume more fish than men. We found a significant difference in consumption between people of different genders and age groups. It was found that only a small proportion of variance was explained by our model. The model can be better explained by including other demographic factors which were not considered in the present study. Also logistic regression model may be more informative to explain fish consumption preferences. Further comprehensive studies are needed to estimate the influence of socio-economic and demographic determinants of fish consumption.
Table 5. Correlations between consumers’ characteristics and fish consumption level values.
Consumers’ Characteristics
Consumption Level (kg/year)
Consumption Frequency Coefficienta p-Value Coefficientb p-Value Age of consumer –0.147 > 0.05 0.013 > 0.05 Educational level 0.360 < 0.01 0.301 < 0.01 Income level 0.224 < 0.05 0.265 < 0.05 Meat consumption
(except for fish)
0.310 < 0.01 0.385 < 0.01
aPearson’s coefficients. bSpearman’s coefficients were used.
Table 6. Correlation matrix of the variables involved the regression model.
Variables (I) (II) (III) (IV) (V)
Fish consumption (I) 1 Age of consumers (II) –0.147 1 Income level (III) 0.224 0.460 1 Meat consumption (except
for fish) (IV)
0.310 –0.343 0.252 1
The number of fish species consumed (V)
0.525 0.278 0.545 0.093 1
Table 7. Regression analysis results for fish consumption level.
Models B Adjusted R2 F Sig F β p
Durbin-Watson VIF
Model–1 0.326 40.683 0.000 1.000
Constant –0.158 0.067
The number of fish species consumed
0.578 0.000
Model–2 0.417 30.305 0.000 1.711 1.067
Constant 1.166 0.002
The number of fish species consumed
0.659 0.000
Compared to other types of food, fish may be considered expensive by consumers (Pieniak et al., 2008). In Turkey eating fish is misinterpreted as a luxury and that it only contributes to 3% of the amount needed to correct protein deficiency (Aydın et al., 2011). According to a study conducted in Amasya, Turkey, 60% of fish consumers find the prices affordable and 30% find the prices high (Kızılaslan & Nalıncı, 2013). In the present study, a significant relationship between fish consumption level and income was detected (Table 6). Although price of fish is important and it is considered as expensive by 52% of the respondents (Figure 1), consumption cannot be increased by production or price policies alone. In our opinion, the most important reason is the fact that fish consumption habits are closely related to the cultural and geographic variables. It should also be noted that the income and price elasticity of the demand for fish is low (<1) in Turkey (Hatırlı et al., 2007; Akbay et al., 2008). Dn the other hand, 38% of the consumers believe that fish consumption can be increased through social awareness. The results of the Fisher’s exact Chi-square analysis indicated that there was a significant relationship between income class and “preferred type of fish”. It is understood that consumption of cultivated fish significantly increases with income (Table 4).
Freshness is another important factor affecting fish consumption. Nearly all of the participants in the present study (98%) preferred fresh fish to processed fish. Although the majority of consumers
claimed that they evaluate the quality of fish and seafood according to their freshness (Bose & Brown, 2000); nevertheless, it is known that it is difficult for consumers to make such an evaluation (Hicks et al., 2008). The use of “quality assurance programs” can bring significant benefits to the industry and consumers (Bose & Brown, 2000). Dther important factors affecting fish consumption are fish bones, smell, and taste (Pieniak et al., 2008). Consumers’ perception of the smell of fish, fish bones, and fish price is not as positive as their perception of its health benefits (Verbeke & Vackier, 2005). Leek et al. (2000) stated that fish bones are one of the most important factors reducing consumption frequency, and they added that fish bones cause problems in cooking and preparation.
in the present study (62%) consume fish to stay healthy and have a balanced diet (Table 3). The significant relationship between educational level and “the reason why consumers prefer fish” also corroborates this finding (Table 4). Furthermore, the preferred method of preparation is oven baking, which can be related to consumers’ desire to consume fish in a health way (Table 3). According to the Chi-square test, it can be said that healthy reasons play an important role in the consumption decision, especially among those with higher levels of education (Table 4).
Çolakoğlu et al. (2006) stated that fish is most frequently purchased from wholesale fish markets and supermarkets, respectively. A study carried out in the United States revealed that seafood is purchased most frequently from supermarkets, street sellers, and restaurants (Sechena et al., 2003). In the current study, it was found that fish is most frequently purchased from fish markets (80%) and supermarkets. A significant number of the consumers indicated that the greatest problem in retail fish markets is hygiene deficiencies (Figure 1), and they believe that the Ministry of Food, Agriculture, and Livestock should increase the number of routine audits.
It has been claimed that in order to increase consumption, the health benefits of eating fish and fishery products should be better explained by the fishing industry (Aydın et al., 2011). It is thought that a lack of advertisement campaigns to increase consumers’ awareness and attract their attention might have had a negative impact on fish consumption. It can be said that organizational structure problems such as, storing, stocking, and transportation in the fishing industry also adversely affect the consumption indirectly (Can et al., 2012).
4 Conclusion
Although academicians, media, and public institutions often mention the association between fish consumption and health, it has been revealed that fish consumption in Antakya is far below the average consumption in Turkey and in the world. Another important issue that is as important as the level of consumption is the frequency of consumption. Fish consumption should not be increased within certain months only, but rather be distributed equally throughout the year. Because of the existing traditional eating habits, low price and demand elasticity for purchasing fish, and some structural problems in the fishing industry, a remarkable increase in fish consumption should not be expected in the near future. Government agencies, private sector, and occupational organizations can play an active role in changing consumption habits and preferences of consumers. In conclusion, priority should be given to training and mass advertising campaigns with the goal of increasing consumption and improving hygiene standards in the fish supply chain.
References
Agha, S. R., & Alnahhal, M. J. (2012). Neural network and multiple linear regression to predict school children dimensions for ergonomic school furniture design. Applied Ergonomics, 43(6), 979-984. http:// dx.doi.org/10.1016/j.apergo.2012.01.007. PMid:22365329
Akbay, C., Bilgiç, A., & Miran, B. (2008). Demand estimation for basic food products in Turkey. Turkish Journal of Agricultural Economics,
14(2), 55-65.
Aydın, H., Dilek, M. K., & Aydın, K. (2011). Trends in fish and fishery
products consumption in Turkey. Turkish Journal of Fisheries
and Aquatic Sciences, 11(3), 499-506. http://dx.doi.org/10.4194/
trjfas.2011.0318.
Barberger-Gateau, P., Letenneur, L., Deschamps, V., Pérès, K., Dartigues, J. F., & Renaud, S. (2002). Fish, meat, and risk of dementia: cohort study. BMJ (Clinical Research Ed.), 325, 932-933. http://dx.doi. org/10.1136/bmj.325.7370.932. PMid:12399342
Bose, S., & Brown, N. (2000). A preliminary investigation of factor affecting seafood consumption behavior in the inland and coastal regions of Victoria, Australia. Journal of Consumer Studies &
Home Economics, 24(4), 257-262
http://dx.doi.org/10.1111/j.1470-6431.2000.00157.x.
Burger, J., Stephens, W. L., Jr., Boring, C. S., Kuklinski, M., Gibbons, J. W., & Gochfeld, M. (1999). Factors in exposure assessment: ethnic and socioeconomic differences in fishing and consumption of fish caught along the Savannah River. Risk Analysis, 19(3), 427-438. http:// dx.doi.org/10.1111/j.1539-6924.1999.tb00418.x. PMid:10765415 Can, M. F. (2014). A socio-economic analysis of small ruminant breeders’
membership relations and organizational effectiveness. Ankara
Üniversitesi Veteriner Fakültesi Dergisi, 61, 119-124.
Can, M. F., & Altuğ, N. (2014). Socioeconomic implications of
biosecurity practices in small-scale dairy farms. The Veterinary
Quarterly, 34(2), 67-73. http://dx.doi.org/10.1080/01652176.2014.
951130. PMid:25174643
Can, M. F., Serpin, D., & Can, M. F. (2012). The current situation of small scale fisheries in İskenderun Bay: İskenderun, Arsuz and Konacik.
Atatürk University Journal of Veterinary Science, 7(3), 167-175.
Cevger, Y., Aral, Y., Demir, P., & Sarıözkan, S. (2008). The situation of animal products consumption and consumer preferences among intern students at the Ankara University Faculty of Veterinary Medicine. Ankara Üniversitesi Veteriner Fakültesi Dergisi, 55, 189-194. Çolakoğlu, F. A., İşmen, A., Özen, Ö., Çakır, F., Yığın, Ç., & Drmancı,
H. B. (2006). The evaluation of fish consumption in Çanakkale, E.U.
Journal of Fisheries and Aquatic Sciences, 23(3), 387-392.
Doğruel, F., & Leman, J. (2009). ‘Conduct’ and ‘Counter-conduct’ on the southern border of Turkey: Multicultural Antakya. Middle Eastern
Studies, 45(4), 593-610. http://dx.doi.org/10.1080/00263200903009650.
Draper, N. R., & Smith, H. (1998). Selecting the “Best” Regression Equation. In N. R. Draper & H. Smith, Applied Regression Analysis
(3rd ed.). Hoboken, NJ: John Wiley & Sons, Inc. http://dx.doi. org/10.1002/9781118625590.
Erdal, G., & Esengün, K. (2008). The analysis of the factors affecting fish consumption in Tokat Province by logit model, E.U. Journal of
Fisheries and Aquatic Sciences, 25, 203-209.
Food and Agriculture Drganization of the United Nations – FAD (2013,
Jun 14). Statistical databases. Retrieved from http://faostat3.fao.org
Hatırlı, S. A., Öztürk, E., & Aktaş, A. R. (2007). An analysis of demand of red meat, fish and chicken using full demand system approach.
Journal of Suleyman Demirel University Institue of Social Sciences,
6, 211-221.
Hicks, D., Pivarnik, L., & McDermott, R. (2008). Consumer perceptions about seafood –an internet survey. Journal of Foodservice, 19(4), 213-226. http://dx.doi.org/10.1111/j.1748-0159.2008.00107.x. Honkanen, P., Dlsen, S. D., & Verplanken, B. (2005). Intention to
from five European countries. BMC Public Health, 8(1), 306. http:// dx.doi.org/10.1186/1471-2458-8-306. PMid:18783593
Qiu, Y., Fu, B., Wang, J., Chen, L., Meng, Q., & Zhang, Y. (2010). Spatial prediction of soil moisture content using multiple-linear regressions in a gully catchment of the Loess Plateau, China. Journal
of Arid Environments, 74(2), 208-220. http://dx.doi.org/10.1016/j.
jaridenv.2009.08.003.
Rodriguez del Águila, M. M., & González-Ramírez, A. R. (2013). Sample size calculation. Allergologia et immunopathologia, 42(5), 485-492. http://dx.doi.org/10.1016/j.aller.2013.03.008.
Sarıözkan, S., Cevger, Y., Demir, P., & Aral, Y. (2007). The consumption situation and habits of livestock products among the students of Erciyes University Veterinary Faculty. Journal of Health Science,
16(3), 171-179.
Sechena, R., Liao, S., Lorenzana, R., Nakano, C., Polissar, N., & Fenske, R. (2003). Asian American and Pacific Islander seafood consumption — a community-based study in King County, Washington. Journal of
Exposure Analysis and Environmental Epidemiology, 13(4), 256-266.
http://dx.doi.org/10.1038/sj.jea.7500274. PMid:12923552 Şeker, İ., Özen, A., Güler, H., Şeker, P., & Özden, İ. (2011). Red meat
consumption behavior in Elazığ and consumers’ opinion in animal welfare summary. Kafkas Universitesi Veteriner Fakultesi Dergisi,
17(4), 543-550.
Turan, H., Kaya, Y., & Sönmez, G. (2006). Position in human health and food value of fish meat. Journal of Fisheries and Aquatic Sciences,
23, 505-508.
Turkish Statitical Institute – TURKSTAT (2011). Agriculture, Fisheries
statistics (213 p., Turkey’s Statistical Yearbook). Ankara, Turkey:
TURKSTAT.
Verbeke, W., & Vackier, I. (2005). Individual determinants of fish consumption: application of the theory of planned behaviour.
Appetite, 44(1), 67-82. http://dx.doi.org/10.1016/j.appet.2004.08.006.
PMid:15604034
Verbeke, W., & Viaene, J. (1999). Beliefs, attitude and behaviour towards fresh meat consumption in Belgium: empirical evidence from a
consumer survey. Food Quality and Preference, 10(6), 437-445.
http://dx.doi.org/10.1016/S0950-3293(99)00031-2. Karakaş, G. (2010). A research on the determination of factors affecting
of consumer decisions on meat and meat products in urban area of
Tokat province (Master’s Thesis). Gaziosmanpasa University, Institute
of Life Sciences, Turkey.
Karakuş, K., Aygün, T., & Alarslan, E. (2008). Consumption habits of meat in center town of Gaziantep Province. Yüzüncü Yıl Üniversitesi,
Ziraat Fakültesi, Tarım Bilimleri Dergisi, 18(2), 113-120.
Kızılaslan, H., & Nalıncı, S. (2013). The fish meat consumption habits of households and the factors affecting their fish meat consumption
in the province of amasya. Gaziosmanpaşa Bilimsel Araştırma
Dergisi, 5, 61-75.
Leek, S., Maddock, S., & Foxall, G. (2000). Situational determinants of fish consumption. British Food Journal, 102(1), 18-39. http://dx.doi. org/10.1108/00070700010310614.
McNaughton, S. A., Ball, K., Mishra, G. D., & Crawford, D. A. (2008). Dietary patterns of adolescents and risk of obesity and hypertension.
The Journal of Nutrition, 138(2), 364-370. PMid:18203905.
Myrland, D., Trondsen, T., Johnston, R. S., & Lund, E. (2000). Determinants of seafood consumption in Norway: lifestyle, revealed preferences, and barriers to consumption. Food Quality and Preference, 11(3), 169-188. http://dx.doi.org/10.1016/S0950-3293(99)00034-8. Dğuzhan, P., Angiş, S., & Atamanalp, M. (2009). A research on the
habits fish products consumption of consumers determination in Erzurum. In Proceedings of the XV. National Fisheries Symposium, Rize, Turkey.
Ören, K., & Biçkes, M. (2011). Effects of personality traits on entrepreneurship potential: A study on higher education students in Nevşehir. The Journal of Faculty of Economics and Administrative Sciences, 16(3), 67-86.
Pieniak, Z., Kołodziejczyk, M., Kowrygo, B., & Verbeke, W. (2011). Consumption patterns and labelling of fish and fishery products in Poland after the EU accession. Food Control, 22(6), 843-850. http:// dx.doi.org/10.1016/j.foodcont.2010.09.022.