ORIGINAL RESEARCH ARTICLE
Locally harvested foods support serum
25-hydroxyvitamin D sufficiency in an indigenous
population of Western Alaska
Bret Luick
1*, Andrea Bersamin
1and Judith S. Stern
21
Center for Alaska Native Health Research, Institute of Arctic Biology, University of Alaska Fairbanks, Fairbanks, AK, USA;2Department of Nutrition, University of California, Davis, CA, USA
Background.Low serum vitamin D is associated with higher latitude, age, body fat percentage and low intake of fatty fish. Little documentation of vitamin D concentrations is available for Alaska Native populations.
Objective.This study was undertaken to investigate serum 25-hydroxyvitamin D (25(OH)D) concentrations of the Yup’ik people of southwestern Alaska in relation to demographic and lifestyle variables, particularly with the use of locally harvested (local) foods.
Design.Cross-sectional study.
Methods.We estimated 25(OH)D, dietary vitamin D and calcium, percent of energy from local foods and
demographic variables in 497 Yup’ik people (43% males) aged 1492 residing in southwestern Alaska.
Sampling was approximately equally divided between synthesizing and non-synthesizing seasons, although the preponderance of samples were drawn during months of increasing daylight.
Results.Mean vitamin D intake was 15.1920.2mg/d, while local foods accounted for 22.9917.1% of energy intake. The leading sources of vitamin D were local fish (90.1%) followed by market foods. Mean 25(OH)D
concentration was 95.6940.7 nmol/L. Participants in the upper 50th percentile of 25(OH)D concentration
tended to be older, male, of lower body mass index, sampled during the synthesizing season, and among the upper 50th percentile of local food use.
Conclusions. A shift away from locally harvested foods will likely increase the risk for serum 25(OH)D insufficiency in this population.
Keywords: Vitamin D;25-hydroxyvitamin D;Alaska Natives;Traditional Foods;Seasonality;Dietary transition
*Correspondence to: Bret Luick, Center for Alaska Native Health Research, Institute of Arctic Biology, 311 Irving I, Box 757000, University of Alaska Fairbanks, Fairbanks, AK 99775-7000, USA,
Email: [email protected]
Received: 30 August 2013; Revised: 10 February 2014; Accepted: 20 February 2014; Published: 20 March 2014
V
itamin D insufficiency is a widespread public health problem (14) that is more prevalent athigher latitudes because of reduced or nearly non-existent cutaneous (UV-B sunlight driven) pre-vitamin D synthesis for most of the year (57). Chronic vitamin D
insufficiency results in rickets and osteoporosis and is associated with increased risk for a variety of conditions such as heart disease, stroke and type 2 diabetes (2,8). Supplementation has been associated with reduction in overall mortality (9). The majority of serum 25(OH)D, the accepted standard for monitoring vitamin D status, is derived from cutaneous production, and at higher lati-tudes low serum 25(OH)D may be expected throughout much of the year (5,10,11). Dietary vitamin D can be an important contributor to serum 25(OH)D, although the
vitamin D content of most Western diets is low (12,13). By comparison, the diet of Yup’ik Eskimos of Western Alaska is marked by locally harvested (local) foods remarkably rich in vitamin D through consumption of fatty fish, fish roe and wild game (14,15). While evidence indicates that vitamin D intake among Yup’ik Eskimos is currently adequate, we also know that local food use is in long-term decline, which may eventually compromise vitamin D intake, especially among youth (16). Yup’ik Eskimos are typically low consumers of dairy products, consistent with reported low lactose tolerance (17,18) and low calcium intake (14,15).
The combination of living at a relatively high latitude, along with few opportunities for sun exposure and high variability in fatty fish intakes and limited use of fortified
International Journal of Circumpolar Health 2014.#2014 Bret Luick et al. This is an Open Access article distributed under the terms of the Creative Commons CC-BY 4.0 License (http://creativecommons.org/licenses/by/4.0/), allowing third parties to copy and redistribute the material in any medium or format and to
dairy products, provided a unique opportunity to investi-gate the impact of changing dietary patterns on vitamin D status. The primary objectives of this study were to assess serum 25(OH)D concentrations among residents of Western Alaska and to identify demographic character-istics associated with 25(OH)D status. This research can identify the demographic and behavioural characteristics that, during this period of dietary change, predict risk of vitamin D insufficiency.
Methods
Study population and design
The study participants included 213 men and 284 women drawn from the Center for Alaska Native Health Study. This study was an interdisciplinary investigation of ge-netic, nutritional and behavioural risk factors for obesity and chronic diseases among Alaska Natives (1921). The
study protocol, using circum-annual convenience sam-pling, has been published previously (16). Briefly, residents of 6 remote communities and one town in the Yukon Kuskokwim River Delta, Alaska, were recruited to par-ticipate in the study via fliers, word of mouth and the locally popular Very High Frequency radio. A local field assistant was hired to assist in the recruitment process in each community. All male and non-pregnant female Yup’ik Eskimos]14 years old were eligible to participate. Fully informed written consent, and assent required for minors, was obtained from all participants. Height, weight, circumferences and skin-fold thickness were mea-sured. Also, age, diet, socio-demographic characteristics, health and wellness were accounted for along with a blood sample. This paper presents findings from observations and samples collected between December 2003 and March 2005.
The University of Alaska at Fairbanks, the University of California at Davis and the Yukon Kuskokwim Health Corporation Institutional Review Boards approved the study protocol.
The Yukon Kuskokwim Delta is located in Western Alaska, approximately 608N, and is home to approxi-mately 16,500 Alaska Natives living predominantly in small remote communities (populationsB500). The com-munities were accessed primarily by local air service companies as there is no road system. According to Census 2000 data, the median age in the census area is 25.3 years, compared to 35.3 in the US population. The majority of the population, particularly the younger generation, is bilingual, speaking both Yup’ik and English; 65.6% reported that a language other than English was spoken at home.
Dietary assessment
Diet was assessed using interviewer administered 24-hour recall (24HR); a subsample of participants (n293)
also completed a 3-day diet record. Diet data were collected from each participant by certified interviewers using computer-assisted 24-hour dietary recall software (Nutrition Data System for Research [NDS-R] software version 4.06) (22). The NDS-R database contains estima-tion of vitamin D concentraestima-tions for all foods, based on the currently available evidence. Many Alaskan Native foods are found in the database. Foods missing from the data-base were either substituted for similar food items when appropriate or the food was added to the database by request. Since data from the 3-day food record and 24-hour recall were collected using different methodolo-gies, nutrient estimations from each were standardized and combined to yield a single value using SPSS software (version 13.0, 2004, SPSS, Inc., Chicago, IL). The 4 stan-dardized observations were then averaged and the single resulting value back-transformed to the original units on the basis of the mean of the 24-hour dietary recall. Unlike the 3-day diet records, the 24-hour dietary recall was available for all participants. Data from participants without a 3-day food record (n204) were used as is.
Local foods were defined as those foods harvested from the local environment and included berries, marine mammals, fish, game animals and wild greens (23). The contribution of locally harvested foods to mean energy intake was calculated on the basis of energy. Mixed foods were dis-aggregated, so only locally harvested ingredients were included in the calculation. Among locally consumed foods, foods of animal origin, comprising fish and fish roe (52.3%), seal oil (17.0%), game meat (14.2%), game fowl (10.5%), organ meats (2.0%), shellfish (1.2%) and animal fat (0.2%), accounted for 97.2% of the energy source. The remaining 2.8% of estimated locally harvested food energy intake comprised berries and wild greens (14).
Biochemical assessment
Sample handling has been described previously (24). Briefly, blood specimens were collected by venipuncture after at least 8 hours of fasting and isolated red cell and serum fractions held at 208C in the field until placed in
408C long-term storage. Total vitamin D was analyzed
by radioimmunoassay (Diasorin, Inc.).
Data analyses
Statistical tests were performed with JMP 10 (SAS Institute, Cary, North Carolina, 2012). A 2-sided P-value
B0.05 was considered statistically significant. Age cate-gories were set to: 1419, 2049 and ]50, consistent
with serum 25(OH)D subsample stratification and earlier reporting (21). The seasonality of sampling date was defined as either synthesizing, corresponding to the semi-annual period with longer average day length (22 March
21 September), or non-synthesizing (22 September21
Summary statistic P-values were calculated byt-tests. The Pearson Chi-square (x2) test was used as a main effects
test of the equality of distributions in cross-tabulations. The relationship between age, body mass index (BMI, 025, 2530, ]30), gender and season; intake of vitamin
D, calcium and local foods; and 25(OH)D was evaluated by multiple regression. The intakes were split at the median value. Multicollinearity was estimated by the variance inflation factor, and while there are no formal cut-off criteria, we used a comparatively conservative value of 5 (25). No variables exceeded these criteria (the maximum was 1.5) and none were excluded. Since the current analyses sought to evaluate relationships between intake and a biological marker, the median values were used for cut-off points. Evaluation of the adequacy of intakes and 25(OH)D were based on current guidelines (26). The association between vitamin D and local food intake was evaluated with Spearman’s rho statistic.
Results
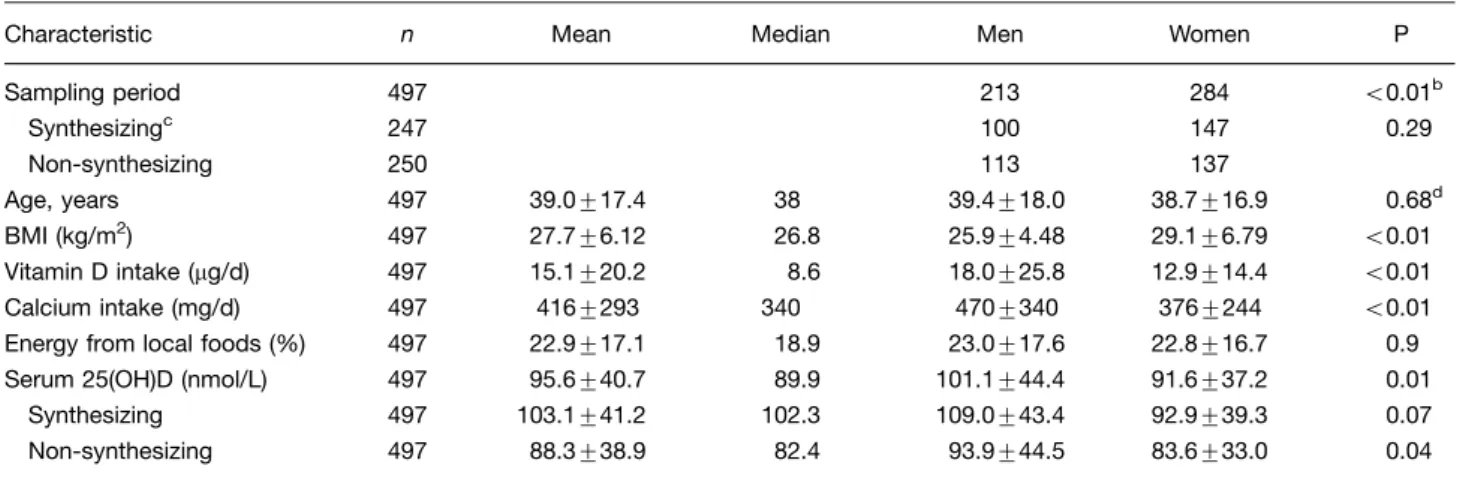
Demographic and clinical characteristics of participants are summarized by gender (Table I). Sampling occurred throughout the year and was closely divided between synthesizing (N247) and non-synthesizing (N250)
seasons (x20.018, P0.89). More samples were drawn
on days when sunlight was gaining (winter solstice
summer solstice, N430) as opposed to decreasing
(sum-mer solsticewinter solstice, N67, x2277, PB0.01)
(data not shown). Age distribution, dietary intake of vitamin D and calcium, and 25(OH)D concentrations were similar between the genders. The study mean BMI was 27.7, with BMI significantly higher among women than men (r0.41, PB0.01). Mean BMI exceeded the
normal range cut-off point of 25 in both genders.
Dietary and serum Vitamin D was positively associated with consumption of local foods (r0.52, PB0.01). The
mean serum 25(OH)D across all participants was suffi-cient (]50 nmol/L). Estimated calcium intakes largely failed to meet current dietary recommendations.
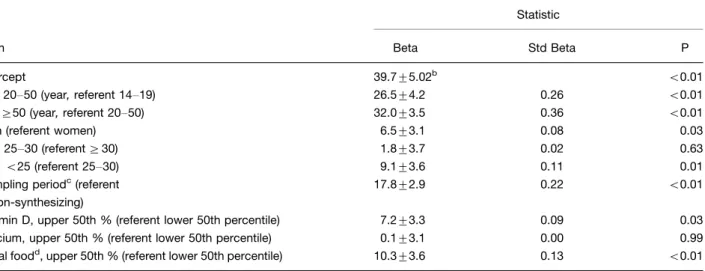
Frequency distributions for demographic, dietary and clinical characteristics, and season were calculated by quartile of 25(OH)D (Table II). The quartile cut-off points were 66.1, 89.9, 119.8 nmol/L, p50.05. Age, sampling period, vitamin D intake and energy from local foods showed significant inequalities in 25(OH)D distributions. Regression analysis was used to estimate the relation-ship between 25(OH)D concentration and categories of age, gender, BMI, sampling period, and vitamin D, calcium and local food intakes (Table III). The lowest referent state was assigned to the independent variable category associated with the lowest estimated 25(OH)D concentrations, corresponding to age category 1419,
women, BMI30, winter sampling period, and the lower 50th percentile of vitamin D, calcium and traditional food intakes. With all predictor variables in their lowest referent state, serum 25(OH)D was estimated to be 39.795 nmol/L. The value of beta indicates the expected change in 25(OH)D from referent state with a change in the independent variable category. Therefore, a member of the 20- to 50-year-old age category was estimated to be 26.5 nmol/L higher in 25(OH)D, relative to 14- to 19-year-olds. Likewise, lower BMI, male gender, summer sampling period, and higher vitamin D and local food intakes were associated with a higher predicted 25(OH)D concentra-tion. The standardized betas indicated that the largest predictor of 25(OH)D concentration was age, followed by sampling period and diet.
Dietary vitamin D was largely derived from locally har-vested foods (Table IV). Fish, primarily locally harhar-vested
Table I. Age, dietary and clinical characteristics of 497 Alaska Native men and womena
Characteristic n Mean Median Men Women P Sampling period 497 213 284 B0.01b
Synthesizingc 247 100 147 0.29 Non-synthesizing 250 113 137
Age, years 497 39.0917.4 38 39.4918.0 38.7916.9 0.68d BMI (kg/m2) 497 27.796.12 26.8 25.994.48 29.196.79 B0.01 Vitamin D intake (mg/d) 497 15.1920.2 8.6 18.0925.8 12.9914.4 B0.01 Calcium intake (mg/d) 497 4169293 340 4709340 3769244 B0.01 Energy from local foods (%) 497 22.9917.1 18.9 23.0917.6 22.8916.7 0.9 Serum 25(OH)D (nmol/L) 497 95.6940.7 89.9 101.1944.4 91.6937.2 0.01
Synthesizing 497 103.1941.2 102.3 109.0943.4 92.9939.3 0.07 Non-synthesizing 497 88.3938.9 82.4 93.9944.5 83.6933.0 0.04
BMIbody mass index.
aData include counts, means
9standard deviation and medians.
bPearson
x2, like values. P0.29 for sampling differences by sex by season. cMarch 22
September 21.
d
Table II. Frequency distribution by quartile of serum 25-OHD among 497 Alaska Native men and women of demographic, dietary and clinical characteristics, and seasona
Variable 1 2 3 4 Pb
Median [IQR] 52.4 [17.564.9] 77.4 [67.489.9] 104.8 [92.4120] 147 [122270]
Age B0.01
B20 57 (11.5) 28 (5.6) 8 (1.6) 3 (0.6) 2049 60 (12.1) 85 (17.1) 63 (12.7) 45 (9.1)
]50 7 (1.4) 17 (3.4) 56 (11.3) 68 (13.7)
Gender 0.09 Men 77 (15.5) 72 (14.5) 79 (15.9) 56 (11.3)
Women 47 (9.5) 58 (11.7) 48 (9.7) 60 (12.1)
BMI 0.43
B25 55 (11.1) 47 (9.5) 38 (7.6) 45 (9.1) 2529.9 35 (7) 45 (9.1) 47 (9.5) 38 (7.6) ]30 34 (6.8) 38 (7.6) 42 (8.5) 33 (6.6)
Sampling period B0.01 Non-synthesizingc 79 (15.9) 73 (14.7) 54 (10.9) 44 (8.9)
Synthesizing 45 (9.1) 57 (11.5) 73 (14.7) 72 (14.5)
Vitamin D intake B0.01 Lower 96 (19.3) 66 (13.3) 59 (11.9) 29 (5.8)
Upper 28 (5.6) 64 (12.9) 68 (13.7) 87 (17.5)
Calcium intake 0.11 Lower 53 (10.7) 65 (13.1) 62 (12.5) 68 (13.7)
Upper 71 (14.3) 65 (13.1) 65 (13.1) 48 (9.7)
Percent of energy from locally harvested foods B0.01 Lower 84 (16.9) 66 (13.3) 60 (12.1) 38 (7.6)
Upper 40 (8) 64 (12.9) 67 (13.5) 78 (15.7)
BMIbody mass index.
a
n(Total %).
bPearson x2. cSeptember 22
March 21.
Table III. Multiple linear regression prediction of serum 25(OH)D among 497 Alaska Native men and womena
Statistic
Term Beta Std Beta P
Intercept 39.795.02b B0.01 Age 2050 (year,referent 1419) 26.594.2 0.26 B0.01
Age]50 (year,referent 2050) 32.093.5 0.36 B0.01
Men (referent women) 6.593.1 0.08 0.03 BMI 2530 (referent]30) 1.893.7 0.02 0.63
BMIB25 (referent 2530) 9.193.6 0.11 0.01 Sampling periodc(referent
non-synthesizing)
17.892.9 0.22 B0.01
Vitamin D, upper 50th % (referent lower 50th percentile) 7.293.3 0.09 0.03 Calcium, upper 50th % (referent lower 50th percentile) 0.193.1 0.00 0.99 Local foodd, upper 50th % (referent lower 50th percentile) 10.393.6 0.13 B0.01
BMIbody mass index.
anmol/L.
bIncreased endogenous vitamin D synthesizing, March 22
September 21.
cMean9SE.
whitefish, salmon and herring, was the primary source of vitamin D. Milk was ranked 6th of all dietary vitamin D sources at 3% of the total (not shown). Also, milk was the main market source of vitamin D, followed by breakfast cereals (1.2%) and eggs (1.1%).
Discussion
This analysis was conducted to assess the serum 25(OH)D status among individuals living in the Yukon Kuskokwim Delta of Alaska and to identify demographic and dietary covariates of 25(OH)D concentration. This relatively high latitude population practices a mixed subsistence lifestyle with a substantial dietary dependence on foods of marine origin. The main finding of this study was the relatively high mean serum vitamin D concentration, both during synthesizing and non-synthesizing seasons, despite the northerly latitude. The concentration of 25(OH)D was strongly correlated with age. Youths were more likely to have low serum 25(OH)D, and constitute an age group known to consume more market-based foods and less energy from vitamin Drich local fish (14).
Westernization has been described in this population previously (16). We have previously demonstrated a strong association between the consumption of local foods and age and have shown that fish constituted the greater proportion of energy among those foods (14). Here, we show that diminished use of local foods, an estimate of
acculturation, correlates with diminished 25(OH)D, and that 90.1% of vitamin D intake is attributable to fish. Furthermore, we have previously shown that Docosahex-aenoic acid (DHA) and EicosapentDocosahex-aenoic acid (EPA), 2 fatty acids abundant in foods of marine origin, are similarly distributed by age category in the red blood cell phospholipids of the same individuals (16). In addi-tion, we have demonstrated the same age and diet asso-ciation in red blood cell protein15N enrichment, consis-tent with consumption of proteins from foods of a marine origin (24). The age effect has been attributed to changes in the efficiency of cutaneous production and time spent outdoors (11,27). In this population, the fatty acid composition of red blood cell membranes is consistent with increased age-related consumption of vitamin D
rich local foods of marine origin (16,24). Increased use of local foods and improved vitamin D status by age group is not unprecedented. Danish (28), Canadian Arctic (2932), Icelandic (33) and Norwegian (34) populations
exhibited increased serum 25(OH)D with age, also asso-ciated with fish consumption.
Nevertheless, low intake of vitamin D is of particular concern at higher latitudes as endogenous synthesis is constrained most of the year due to the limited exposure to sunlight of adequate intensity (5,10,35). Evidence suggests that sunlight-driven cutaneous production of vitamin D is typically the predominant source of serum vitamin D (1,26,3437). Our analyses clearly show seasonality in 25(OH)D but with relatively high concentrations for the latitude (38). In the non-synthesizing season, we had 8.4% of cases classified as deficient (B50 nmol/L 25(OH)D, data not shown) as compared to 1632% of a winter
sample in Boston, MA (428N) (38), despite residing at 608N, some 188farther north. In contrast, Gessner et al. (39) reported that 31% of 133 children aged between 6 and 23 months from 5 communities across Alaska of latitudes ranging from 588N718N had 25(OH)D concentrations
of less than 62.4 nmol/L. Mazess et al. (40) found a mean 25(OH)D of 41.4 nmol/L among 53 male and female Aleutian Islander (548N) adults, which falls within the lowest referent category of the current report. Vitamin D deficiency has been reported for Southeast Alaska (ap-proximately 588N) based on medical record extraction where mean 25(OH)D concentration was 44.4930.2 nmol/L among 55 diabetic patients (41). The non-synthesizing season mean 25(OH)D was above the highest NHANES III subgroup (42). However, this report is consistent with findings for indigenous adults residing in northern circumpolar regions where seasonality and local foods are important mediators of vitamin D intake (43) and circulating 25(OH)D concentration (27,4448).
Pro-nounced seasonality of serum 25(OH)D has been demon-strated among 47 adult Caucasians residing in Fairbanks, Alaska, latitude 658N, based on 12 months of longitudi-nal sampling and was shown to follow measured UV-B
Table IV. Leading sources of vitamin D among Alaska Natives of Western Alaskaa
% of total
Food source
Locally harvested 89.9 Market 10.1 Major food groupingsb
Meats 92.5 Dairy 3.75 Grains 2.1 Eggs 1.1 Beverages 0.2 Minor food groupingsb
Fish 90.1 Milk 3.2 Cereals 1.2 Eggs 1.1 Beef 1 Individual foods
Whitefish 35.4 Salmon 26.8 Herring 13.1 Blackfish 4.1 Pike 3.1
exposure, although intake appeared to be a more impor-tant factor than sunlight for determining year-round concentrations (49). The largely sufficient serum 25(OH)D values in the current report, particularly among elders, contrast sharply with other Alaska-based reports (40
42,49) and are presumably due to increased adherence to a traditional lifestyle in the Yukon-Kuskokwim Delta of Western Alaska (50).
The temporal trend of 25(OH)D in any given partici-pant was unknown, which limits the interpretation of seasonal effects, and longitudinal data collection should be considered. Determination of vitamin D and calcium in local foods as consumed, for instance solubilized in soups and contained in smoked fish skin, would improve estimated intakes.
In summary, vitamin D status was predominantly sufficient throughout the year and across the participants. Endogenously produced 25(OH)D was apparent during the synthesizing months, but the expected drop in serum 25(OH)D during other months seemed mitigated by die-tary sources, which we attributed to the use of local foods, consistent with a traditional lifestyle.
Authors’ contributions
The authors’ responsibilities were as follows BRL
designed the study, analyzed the data and wrote the first draft of the manuscript. BRL and AB were responsible for collecting, compiling and analyzing the nutritional data and producing the manuscript. JSS participated in data interpretation and writing. All authors read and approved the manuscript.
Acknowledgements
We are grateful for the assistance of Scarlett Hopkins to our research field team. We thank Irena King, then at the Fred Hutchinson Cancer Research Center, for the fatty acid analyses.
Conflict of interest and funding
Supported by a Centers of Biomedical Research Excellence grant from the NIH National Center for Research Resources (NCRR) (P20 RR16430). The contents are solely the res-ponsibility of the authors and do not necessarily represent the official views of NCRR or NIH. B. Luick, A. Bersamin and J.S. Stern have no conflicts of interest.
References
1. Holick MF. Vitamin D deficiency. N Engl J Med. 2007;357: 26681.
2. Holick MF. Vitamin D: importance in the prevention of cancers, type 1 diabetes, heart disease, and osteoporosis. Am J Clin Nutr. 2004;79:36271.
3. Looker AC, Pfeiffer CM, Lacher DA, Schleicher RL, Picciano MF, Yetley EA. Serum 25-hydroxyvitamin D status of the US population: 19881994 compared with 20002004. Am J Clin Nutr. 2008;88:151927.
4. Chapuy MC, Preziosi P, Maamer M, Arnaud S, Galan P, Hercberg S, et al. Prevalence of vitamin D insufficiency in an adult normal population. Osteoporos Int. 1997;7:43943. 5. Webb AR, Kline L, Holick MF. Influence of season and
latitude on the cutaneous synthesis of vitamin D3: exposure to winter sunlight in Boston and Edmonton will not promote vitamin D3 synthesis in human skin. J Clin Endocrinol Metab. 1988;67:3738.
6. Barake R, Weiler H, Payette H, Gray-Donald K. Vitamin D status in healthy free-living elderly men and women living in Quebec, Canada. J Am Coll Nutr. 2010;29:2530.
7. Gagnon C, Baillargeon JP, Desmarais G, Fink GD. Prevalence and predictors of vitamin D insufficiency in women of re-productive age living in northern latitude. Eur J Endocrinol. 2010;163:81924.
8. Lee JH, O’Keefe JH, Bell D, Hensrud DD, Holick MF. Vitamin D deficiency an important, common, and easily treat-able cardiovascular risk factor? J Am Coll Cardiol. 2008; 52:194956.
9. Autier P, Gandini S. Vitamin D supplementation and total mortality: a meta-analysis of randomized controlled trials. Arch Intern Med. 2007;167:17307.
10. Chen TC, Chimeh F, Lu Z, Mathieu J, Person KS, Zhang A, et al. Factors that influence the cutaneous synthesis and dietary sources of vitamin D. Arch Biochem Biophys. 2007; 460:2137.
11. Specker BL, Valanis B, Hertzberg V, Edwards N, Tsang RC. Sunshine exposure and serum 25-hydroxyvitamin D concen-trations in exclusively breast-fed infants. J Pediatr. 1985; 107:3726.
12. Holick MF, Chen TC. Vitamin D deficiency: a worldwide problem with health consequences. Am J Clin Nutr. 2008; 87:1080S6S.
13. Tangpricha V, Koutkia P, Rieke SM, Chen TC, Perez AA, Holick MF. Fortification of orange juice with vitamin D: a novel approach for enhancing vitamin D nutritional health. Am J Clin Nutr. 2003;77:147883.
14. Bersamin A, Zidenberg-Cherr S, Stern JS, Luick BR. Nutrient intakes are associated with adherence to a traditional diet among Yup’ik Eskimos living in remote Alaska Native communities: the CANHR Study. Int J Circumpolar Health. 2007;66:6270.
15. Ballew C, Tzilkowski A. The contribution of subsistence foods to the total diet of Alaska Natives in 13 rural communities. Ecol Food Nutr. 2006;245:126.
16. Bersamin A, Luick BR, King IB, Stern JS, Zidenberg-Cherr S. Westernizing diets influence fat intake, red blood cell fatty acid composition, and health in remote Alaskan Native commu-nities in the center for Alaska Native health studym. J Am Diet Assoc. 2008;108:26673.
17. Bell RR, Draper HH, Bergan JG. Sucrose, lactose, and glucose tolerance in northern Alaskan Eskimos. Am J Clin Nutr. 1973;26:118590.
18. Duncan IW, Scott EM. Lactose intolerance in Alaskan Indians and Eskimos. Am J Clin Nutr. 1972;25:8678.
19. Bersamin A, Luick BR, Ruppert E, Stern JS, Zidenberg-Cherr S. Diet quality among Yup’ik Eskimos living in rural commu-nities is low: the Center for Alaska Native Health Research Pilot Study. J Am Diet Assoc. 2006;106:105563.
20. Boyer BB, Mohatt GV, Lardon C, Plaetke R, Luick BR, Hutchison SH, et al. Building a community-based participa-tory research center to investigate obesity and diabetes in Alaska Natives. Int J Circumpolar Health. 2005;64:28190. 21. Mohatt GV, Plaetke R, Klejka J, Luick B, Lardon C, Bersamin
and chronic disease-related protective and risk factors. Int J Circumpolar Health. 2007;66:818.
22. Center NC. NDS-R software. Minneapolis: Regents of the University of Minnesota; 2003.
23. Receveur O, Boulay M, Kuhnlein HV. Decreasing traditional food use affects diet quality for adult Dene/Metis in 16 com-munities of the Canadian Northwest Territories. J Nutr. 1997; 127:217986.
24. O’Brien DM, Kristal AR, Jeannet MA, Wilkinson MJ, Bersamin A, Luick B. Red blood cell delta15N: a novel bio-marker of dietary eicosapentaenoic acid and docosahexaenoic acid intake. Am J Clin Nutr. 2009;89:9139.
25. Freund RJ, Littell RC, Creighton L. Regression using JMP. SAS Institute Inc., Cary, NC; 2003.
26. Food and Nutrition Board, Institute of Medicine. DRI dietary reference intakes for calcium and vitamin D. Washington, DC: National Academy Press; 2011.
27. Holick MF, Matsuoka LY, Wortsman J. Age, vitamin D, and solar ultraviolet. Lancet. 1989;2:11045.
28. Brot C, Vestergaard P, Kolthoff N, Gram J, Hermann AP, Sorensen OH. Vitamin D status and its adequacy in healthy Danish perimenopausal women: relationships to dietary in-take, sun exposure and serum parathyroid hormone. Br J Nutr. 2001;86:S97103.
29. Egeland GM, Johnson-Down L, Cao ZR, Sheikh N, Weiler H. Food insecurity and nutrition transition combine to affect nutrient intakes in Canadian Arctic communities. J Nutr. 2011; 141:174653.
30. Kuhnlein HV, Receveur O. Local cultural animal food con-tributes high levels of nutrients for Arctic Canadian Indigen-ous adults and children. J Nutr. 2007;137:11104.
31. Weiler HA, Leslie WD, Krahn J, Steiman PW, Metge CJ. Canadian Aboriginal women have a higher prevalence of vi-tamin D deficiency than non-Aboriginal women despite similar dietary vitamin D intakes. J Nutr. 2007;137:4615.
32. El Hayek J, Egeland G, Weiler H. Older age and lower adiposity predict better 25-hydroxy vitamin D concentration in Inuit adults: International Polar Year Inuit Health Survey, 20072008. Arch Osteoporos. 2011;6:16777.
33. Steingrimsdottir L, Gunnarsson O, Indridason OS, Franzson L, Sigurdsson G. Relationship between serum parathyroid hor-mone levels, vitamin D sufficiency, and calcium intake. JAMA. 2005;294(18):233641.
34. Holvik K, Meyer HE, Haug E, Brunvand L. Prevalence and predictors of vitamin D deficiency in five immigrant groups living in Oslo, Norway: the Oslo Immigrant Health Study. Eur J Clin Nutr. 2005;59:5763.
35. Huotari A, Herzig K. Vitamin D and living in northern latitudesan endemic risk area for vitamin D deficiency. Int J Circumpolar Health. 2008;67:23.
36. Matsuoka LY, Wortsman J, Haddad JG, Hollis BW. In vivo threshold for cutaneous synthesis of vitamin D3. J Lab Clin Med. 1989;114:3015.
37. Terushkin V, Bender A, Psaty E, Engelsen O, Wang S, Halpern A. Estimated equivalency of vitamin D production from natural sun exposure versus oral vitamin D supplementation across seasons at two US latitudes. J Am Acad Dermatol. 2010;62:929. e19.
38. Tangpricha V, Pearce EN, Chen TC, Holick MF. Vitamin D insufficiency among free-living healthy young adults. Am J Med. 2002;112:65962.
39. Gessner BD, Plotnik J, Muth PT. 25-hydroxyvitamin D levels among healthy children in Alaska. J Pediatr. 2003;143:4347. 40. Mazess RB, Barden HS, Christiansen C, Harper AB, Laughlin WS. Bone mineral and vitamin D in Aleutian Islanders. Am J Clin Nutr. 1985;42:1436.
41. Frost JT, Hill L. Vitamin D deficiency in a nonrandom sample of southeast Alaska Natives. J Am Diet Assoc. 2008;108:150811. 42. Yetley EA. Assessing the vitamin D status of the US
pop-ulation. Am J Clin Nutr. 2008;88:558S64S.
43. Slater J, Laracombe L, Green C, Slivinski C, Singer M, Denechezhe L, et al. Dietary intake of vitamin D in a northern Canadian Dene’ First Nation community. Int J Circumpolar Health. 2013;72:20723.
44. Kuhnlein HV, Barthet V, Farren A, Falahi E, Leggee D, Receveur O, et al. Vitamins A, D, and E in Canadian Arctic traditional food and adult diets. J Food Compost Anal. 2006;19:495506.
45. El Hayek J, Egeland G, Weiler H. Vitamin D status of Inuit preschoolers reflects season and vitamin D intake. J Nutr. 2010;140:183945.
46. Johnson-Down L, Egeland GM. Adequate nutrient intakes are associated with traditional food consumption in Nunavut Inuit children aged 35 years. J Nutr. 2010;140:13116. 47. Andersen S, Laurberg P, Hvingel B, Kleinschmidt K,
Heickendorff L, Mosekilde L. Vitamin D status in Greenland is influenced by diet and ethnicity: a population-based survey in an Arctic society in transition. Br J Nutr. 2012;8:18. 48. Brustad M, Sandanger T, Wilsgaard T, Aksnes L, Lund E.
Change in plasma levels of vitamin D after consumption of co-liver and fresh cod-liver oil as part of the traditional North Norwegian fish dish ‘‘molje.’’ Int J Circumpolar Health. 2003; 62:4053.
49. Tallas M. Seasonal variation in serum 25-Hydroxyvitamin D in healthy Fairbanks, Alaska residents: relation to diet and sunlight exposure [dissertation]. Fairbanks, AK: University of Alaska Fairbanks; 1986.