__________________________________
1 Engo Agrônomo, Doutor, Assistente Administrativo, Departamento de Engenharia Agrícola, Universidade Federal do Ceará, Fone: (0xx85) 3366.9764, [email protected].
2 Engo Agrícola, Doutor em Agricultural Irrigation Engineering pela Utah State University, Prof. Titular, Departamento de Engenharia Agrícola e Ambiental, Universidade Federal de Viçosa - MG.
3 Engo Agrônomo, Doutor em Engenharia Agrícola e de Biossistemas pela University of California - Davis, Prof. Associado I, Departamento de Engenharia Agrícola da Universidade Federal do Ceará.
4 Engo Agrônomo, Doutor em Engenharia Agrícola pela Universidade Federal de Viçosa, Prof. Associado IV, Departamento de Engenharia Agrícola da Universidade Federal de Viçosa - MG.
Recebido pelo Conselho Editorial em: 14-7-2011 Aprovado pelo Conselho Editorial em: 16-9-2012
CEARÁ, BRAZIL, BY DIFFERENT COMBINED METHODS, DERIVED FROM THE PENMAN EQUATION
RAIMUNDO A. DE O. LEÃO1, ANTÔNIO A. SOARES2, ADUNIAS DOS S. TEIXEIRA3,
DEMETRIUS D. DA SILVA4
ABSTRACT: The state of Ceará, Brazil, has 75% of its area covered by Brazilian semiarid, with its peculiar features. In this state, the dams are constituted in water structure of strategic importance, ensuring, both in time and space, the development and supply of water to population. However, construction of reservoirs results in various impacts that should be carefully observed when deciding on their implementation. One of the impacts identified as negative is the increased evaporation, which constitutes a major component of water balance in reservoirs, especially in arid regions. Several methods for estimating evaporation have been proposed over time, many of them deriving from the Penman equation. This study evaluated six different methods for estimating evaporation in order to determine the most suitable for use in hydrological models for water balance in reservoirs in the state of Ceará. The tested methods were proposed by Penman, Kohler-Nordenson-Fox, Priestley-Taylor, deBruim-Keijman, Brutsaert-Stricker and deBruim. The methods presented good performance when tested for water balance during the dry season, and the Priestley-Taylor was the most appropriate, since the data from de simulated water balance with evaporation estimated by this method were the closest of the water balance data observed from measures of reservoir level and the elevation-volume curve provided by the Company of Management of Water Resources of the state of Ceará – COGERH.
KEYWORDS: dams, semiarid, hydrologycal modelling, water balance.
ESTIMATIVA DA EVAPORAÇÃO NO AÇUDE BANABUIÚ, NO ESTADO DO CEARÁ, POR DIFERENTES MÉTODOS COMBINADOS, DERIVADOS DA EQUAÇÃO DE
PENMAN
RESUMO: O Estado do Ceará possui 75% do território abrangido pelo semiárido brasileiro, com suas características peculiares. Nesse Estado, açudes constituem-se em estrutura hídrica de importância estratégica, garantindo, no tempo e no espaço, o desenvolvimento e o abastecimento hídrico das populações. No entanto, a construção de reservatórios implica vários impactos que devem ser cuidadosamente observados no momento de decidir pela sua execução. Um dos impactos apontados como negativo é o aumento da evaporação, que se constitui em um dos principais componentes do balanço hídrico nos reservatórios, sobretudo em regiões áridas. Vários métodos de estimativa da evaporação foram propostos ao longo do tempo, muitos deles derivados da equação de Penman. Neste trabalho, foram avaliados seis diferentes métodos de estimativa da evaporação a fim de determinar qual o mais adequado para utilização em modelos hidrológicos para o balanço hídrico em reservatórios no Estado do Ceará. Os métodos avaliados foram os propostos por Penman, Kohler-Nordenson-Fox, Priestley-Taylor, deBruim-Keijman, Brutsaert-Stricker e deBruim, os quais apresentaram ótimo desempenho quando testados para o balanço hídrico durante a estação seca, sendo o de Priestley-Taylor o mais adequado, uma vez que os dados do balanço hídrico simulado com a componente evaporação estimada por este método foram os mais próximos dos dados do balanço hídrico observado a partir das medidas de nível do reservatório e da curva cota-volume fornecidos pela Companhia de Gestão dos Recursos Hídricos do Estado do Ceará - COGERH.
INTRODUCTION
The Brazilian semiarid region is characterized by spatiotemporal irregularity of average annual precipitation of 60 mm concentrated within four months, and potential evapotranspiration of 2,000 mm; by the vegetation composition in which the Caatinga predominates, with leafless trees and shrubs during the dry season; and by the shallow soil, seated on nearly impermeable crystalline shield (ALVES et al., 2009).
These characteristics favor intense superficial drainage, given intense precipitation on soil with low storage and infiltration capacity and devoid of plant protection against the impacts of the first rains. As a result, the natural drainage is intermittent, composed by temporary and ephemeral rivers. To CAMPOS et al. (2009), these characteristics provide dry rivers most of the year and resulted in damming as the most practiced public policy for the survival of the region's population. According to KROL & BRONSTERT (2007), several small reservoirs store water for regular annual dry periods, but are unable to supply shortages resulting from several years of drought.
In the state of Ceará, the dams are strategic: make rivers perennial; provide water to urban areas; favor the production of crops of high economic value, as well as fish and shrimp farming; boost trade and tourism, and make regional industrialization possible, in addition to soften floods in years with above average precipitation.
MATOS et al. (2003) listed positive and negative impacts arising from the construction of reservoirs. Among the negative, they cited the increase of evaporative potential of water. According to ASHRAF et al. (2007), due to the high ratio surface/volume area, small reservoirs may lose up to 50% of the stored volume due to evaporation in arid and semiarid regions. Evaporation constitutes a major component of the water balance in the reservoirs and may be estimated by various methods, which are classified - according to the processes and/or instruments used - in methods of mass transfer or based on Dalton equation, water balance, energy balance, empirical and the evaporation tank, whose descriptions and foundations may be viewed on BURMAN & POCHOP, 1994; TUCCI & BELTRAME, 2004; PEREIRA et al., 1997; GIANNIOU & ANTONOPOULOS, 2007; PEREIRA et al., 2009.
Empirical or combined methods are based on Dalton equation and use meteorological parameters. BURMAN & POCHOP (1994) report that most of the combined methods is derived from the Penman method and are intended to replace difficult meteorological data by the ones easy to obtain. With the advent of automatic weather stations, acquisition of data became easier, enabling the estimation of evaporation in liquid surfaces by various combined methods, which may be compared with the evaporation determined by the water balance of the reservoir, whose other components are known.
This study aimed to evaluate different combined methods for estimating the evaporation in the Banabuiú reservoir, in the state of Ceará, and to determine the best method to use in its daily water balance, in the dry season, comparing the daily water balance observed by means of measures of reservoir level provided by the Company of Management of Water Resources of the state of Ceará State - COGERH and daily level estimated by the water balance whose evaporation component was estimated by the different methods to estimate evaporation.
MATERIAL AND METHODS
Characterization of hydrographic region of Banabuiú in the state of Ceará
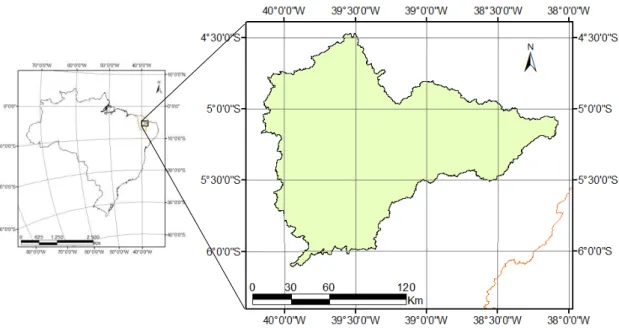
Banabuiú hydrographic region lies between latitudes 4°25’ and 6°10’ South and longitudes
38°5’ and 40º10’ West (Figure 1), in the center of the state of Ceará, in Brazil, and encompasses the
FIGURE 1. Geographical localization of Banabuiú hydrographic region.
Banabuiú River, 314 km long, drains an area of 19,314 km2 and is the main tributary of the
Jaguaribe River. It develops from West to East, and its estuary is near the city of Limoeiro do Norte. Its affluents on the left side are rivers Patu, Quixeramobim and Sitiá Rivers (barred by Pedras Brancas), and on the right side stands the Livramento Stream. Sitiá River flows into the Banabuiú River downstream of the barrage of Banabuiú dam. There are 17 dams monitored,
totaling 2,775,909,000 m3 in storage capacity. The largest reservoirs are Banabuiú, Pedras Brancas,
Cedro and Fogareiro dams. Twelve municipalities are included in Banabuiú hydrographic region. The watercourses are intermittent, and the potential of groundwaters is low and occur in fractures systems.
The climate is Semiarid Warm Tropical with mean annual temperatures from 26 to 28 ºC. The mean precipitation is 725.4 mm. The geologic pattern is simple, consisting of 96.5% of rocks from the crystalline basement covered by shallow soils, prevailing Entisols, Planosols and Vertisols, and also Fluvisols along the Banabuiú River, Sodium Planosols and Eutrophic Ultisols. Open Shrubby and Dense Shrubby Caatingas predominate. Due to the high temperatures and high evaporation rates, combined with low precipitation, considerable water deficit occurs, and the flow of natural drainage net is virtually restricted to the rainy season (CEARÁ, 2009).
Estimation of evaporation
Evaporation in Banabuiú dam was estimated by six different semi-empirical methods: Penman (P), Kohler-Nordenson-Fox (K-N-F), Priestley-Taylor (P-T), deBruin-Keijman (dB-K), Brutsaert-Stricker (B-S) and deBruin (dB).
Penman method (eq.(1)) comprises two previous theoretical approaches: aerodynamic basis (evaporation occurs due to the transport of water vapor) and energetic basis (evaporation is one of the means of degradation of energy from the radiation). Kohler-Nordenson-Fox method (eq.(2)) -
which, according to BURMAN & POCHOP (1994), is one of the most widely used – considers the
real evaporation in relation to the evaporating power of air in the absence of advection; and deBruin method (eq.(6)) estimates evaporation in shallow reservoirs or ponds. Equations of the six methods are described below:
2
s a
n
l 0,260,5 0.54u e e
γ Δ γ λρ G R γ Δ Δ 86,4
E
(1)
γ Δ γE ΔR 0,7 0,0353
E n a
l (2)
λρ G R γ Δ Δ 86,4α E n l
(3)
λρ G R 0,63γ 0,85Δ Δ 86,4 E n l
(4)
2
s a
n
l Δ γ0,260,5 0,54u e e
γ λρ G R γ Δ Δ 1 2α 86,4
E
(5)
λρ 2,1u 2,9 γ Δ γ 1 α α 1,192 86,4 E 2l (6)
In which,
l
E - evaporation in the lake, mm d-1;
∆ - slope of the curve of saturation vapor pressure versus temperature, kPa ºC-1;
- psychrometric coefficient, kPa ºC-1;
n
R - liquid radiation, W m-2;
a
E - aerodynamic function, W m-2;
26 , 1
- Priestley-Taylor constant, obtained empirically and dimensionless;
- latent heat of vaporization, MJ kg-1;
1000
- density of water, kg m-3;
2
u - wind speed measured 2m above the surface, m s-1;
s
e - vapor saturation pressure to air temperature, mbar, and
a
e - current vapor pressure, mbar.
It was developed a spreadsheet in Excel Software for calculation of evaporation from the meteorological data measured in data collection platforms (DCPs), monitored by Ceará Foundation for Meteorology and Hydro Resources (Funceme), considering the area of influence of the reservoir hydraulic basin, determined by Thiessen polygons technique.
The estimation of evaporation in the reservoir was converted to evaporated volume according to eq.(7):
i i i 10Ev A
VEv (7)
In which,
i
VEv - evaporated volume on i day, m3;
i
Ev - mean evaporation on i day, mm, and
i
A - reservoir area on the day, m2.
i
Ev is determined by the mean of estimated evaporation from the data obtained for each
ndcp 1 dcp
i dcp, dcp i
i A A Ev
1
Ev (8)
In which,
i dcp
Ev , - evaporation estimated by a determined DCP, on iday, mm;
dcp
A - area of influence of DCP over the reservoir, on iday, m2, and
ndcp - number of DCPs considered.
The determination of the most appropriate method for estimating the evaporation in Banabuiú dam was made by comparing the stored volumes observed (based on data from reservoir level measured by the Company of Management of Water Resources of the state of Ceará - COGERH, daily) to the estimated stored volumes. The estimated stored volumes were obtained by the daily water balance in the reservoir.
Water balance in the reservoir
It was adopted the daily water balance in the reservoir based on conservation of mass, according to the following equation:
i i i i i
1
i Vstor Vprec Vaf Vef Vev
Vstor (9)
In which,
1
i
Vstor - stored volume at the end of the day, m3;
i
Vstor - stored volume at the beginning of the day, m3;
i
Vprec - precipitated volume on i day, m3;
i
Vaf - affluent volume on i day, m3;
i
Vef - effluent volume on i day, m3,
i
Vev - evaporated volume on i day, m3.
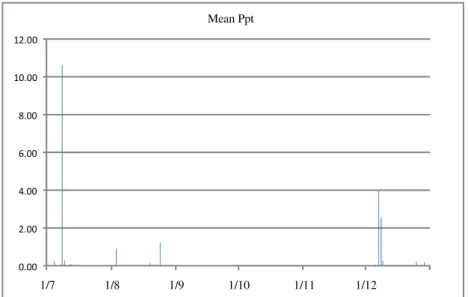
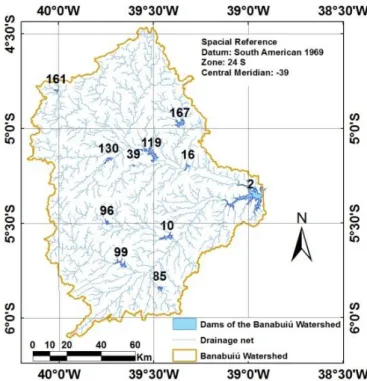
The water balance was conducted during the dry season, from July 1st to December 31st, 2005, when precipitation in the area was insufficient to generate superficial drainage, only precipitating 21 mm, 10.6 mm on July 8th, 2005, and the rest in two precipitation occurred in August and five occurred in December, and the highest one was 4 mm, as seen in Figure 2. During this period, the affluent volume to the reservoir is due to flow released in smaller reservoirs upstream of Banabuiú dam (Figure 3), due to the intermittency of watercourses in the region.
FIGURE 2. Mean precipitation in the watershed of Banabuiú dam, from July 1st to December 30th, 2005.
0.00 2.00 4.00 6.00 8.00 10.00 12.00
1/7 1/8 1/9 1/10 1/11 1/12
FIGURE 3. Watershed of Banabuiú dam (2), with the reservoirs upstream and controlled by the State: Patu (10); Quixeramobim (16); São José I (39); São José II (85); Trapiá II (96); Serafim Dias (99); Fogareiro (119); Vieirão (130); Monsenhor Tabosa (161); and Pirabibu (167).
Precipitated volume
The term Vpreci of eq.(9) was obtained by multiplying the precipitation registered in Figure 3
by the reservoir area. Stored volume
The term Vstori of eq.(9) was determined using daily data of the water level measured in the
reservoir and of elevation-volume, both supplied by the Company of Management of Water Resources of the state of Ceará - COGERH. The elevation-volume curves were determined by fitting a polynomial of fourth degree.
Effluent volume
Daily values of Vef were calculated based on data of flow released daily in the reservoir,
obtained from COGERH. To calculate the effluent volume, it was used the following equation:
Qr 86400
Vef (12)
In which,
Qr - flow released, m3 s-1.
Affluent volume
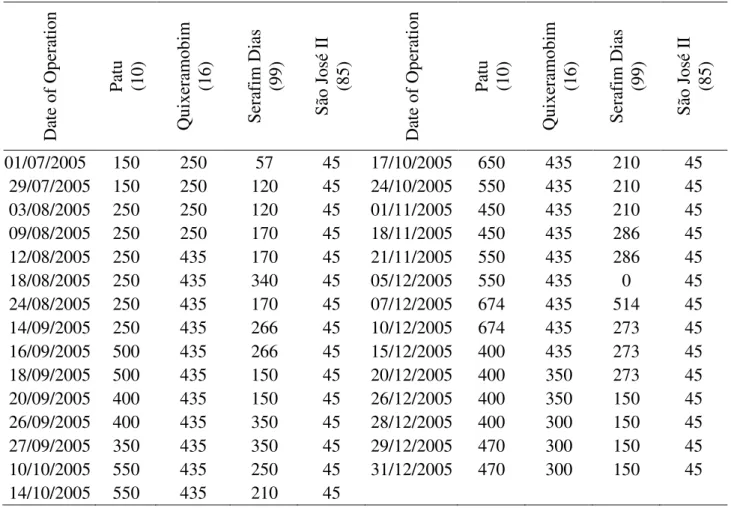
In Figure 3, it is possible to observe the ten dams of the watershed of Banabuiú dam with flow control by the state. Of these dams, only four (Patu, Quixeramobim, São José II and Serafim Dias) release water directly into the Banabuiú. The Trapiá II dam releases into the Patu; the São José I, Fogareiro and Pirabibu dams release into Quixeramobim; and Vieirão and Monsenhor Tabosa dams release into Fogareiro. Table 1 shows the recorded dates of change in flow released from the four
reservoirs that release water to the Banabuiú dam and the flow released, in L s-1.
TABLE 1. Flows released into Patu, Quixeramobim, Serafim Dias and São José II dams, in L s-1,
and dates of changes in operation, in the dry period of 2005. Da te of Op era ti on P atu (10) Quixe ra mobi m (16) S era
fim Dias (99)
S
ão José I
I (85) Da te of Op era ti on P atu (10) Quixe ra mobi m (16) S era
fim Dias (99)
S
ão José I
I
(85)
01/07/2005 150 250 57 45 17/10/2005 650 435 210 45
29/07/2005 150 250 120 45 24/10/2005 550 435 210 45
03/08/2005 250 250 120 45 01/11/2005 450 435 210 45
09/08/2005 250 250 170 45 18/11/2005 450 435 286 45
12/08/2005 250 435 170 45 21/11/2005 550 435 286 45
18/08/2005 250 435 340 45 05/12/2005 550 435 0 45
24/08/2005 250 435 170 45 07/12/2005 674 435 514 45
14/09/2005 250 435 266 45 10/12/2005 674 435 273 45
16/09/2005 500 435 266 45 15/12/2005 400 435 273 45
18/09/2005 500 435 150 45 20/12/2005 400 350 273 45
20/09/2005 400 435 150 45 26/12/2005 400 350 150 45
26/09/2005 400 435 350 45 28/12/2005 400 300 150 45
27/09/2005 350 435 350 45 29/12/2005 470 300 150 45
10/10/2005 550 435 250 45 31/12/2005 470 300 150 45
14/10/2005 550 435 210 45
The pathway of the hydrogram since the release into each of the four dams that release into
the Banabuiú was performed considering the following relations. The input
m d t
I on a particular
excerpt
m , at the beginning of the day[t(d)], is equal to the sum of the outputs(Ot md11Ot md12),at the beginning of the day[t(d)], in both excerpts upstream
m1
1
and
m1
2
: t md12 1 1 m d t m d
t O O
I (13)
The input
m
d t
I1 on a particular excerpt
m , at the end of the day [t1(d)] is equal to the sum ofthe outputs( 12)
1 1 1 1
tmd m
d
t O
O , at the end of the day[t1(d)], in both excerpts upstream
m1
1
and
m1
2
: tm1 1d2 1 1 m d 1 t m d 1
t O O
I (14)
The output ( m )
d t
O of a particular excerpt
m , at the beginning of the day [t(d)] is equal to theoutput( m1 1)
d t
mt 1 d 1 m
d
t O
O (15)
The output ( m1 )
d t
O of a particular excerpt
m , at the end of the day[t(d)], is estimated by theMuskingum-Cunge, depending on the previous three flows:
1 mt 1 d 2 tm d 3 mt d m
d 1
t CI C I CO
O (16)
In which,
1 X
0.5Δ.K
0.5Δ.
KX
C1
(17)
1 X
0.5Δ.K
0.5Δ.
KX
C2
(18)
1 X
0.5Δ.K
0.5Δ.
X 1 K
C3
(19)
and
C1C2C3 1 (20)
In which,
K - constant of transit time and has unity of time;
X - weighting factor, dimensionless, and
t
- time interval required for the hydrogram to go through a particular excerpt of the river.
TUCCI & BELTRAME (2004) describes the method proposed by Cunge, in 1969, to estimate
the values ofK, X andt, according to the following equations:
Δx c S B
Q 1
2 1 X
k 0
0 (21)
k c
Δx
K (22)
5 t Δt p
(23)
In which,
0
Q - mean flow of the river excerpt, in m3 s-1;
B - mean width of the river excerpt, on the surface, in m;
0
S - declivity of the river excerpt, in m m-1;
k
c - celerity of hydrogram, in m s-1;
x
- length of the excerpt of the channel crossed by the hydrograph of ckcelerity, in t time,
in m, and
p
t - peak time of the watershed drained by the excerpt of river, in s.
The term Q0 was estimated by the mean of flows known in Muskingun method (Equation
16). The terms B and S0 were provided as input data in the model and were obtained by means of
tp 0,6tc (24)
The concentration time, in its turn, was determined by Ven Te Chow equation (Equation 25),
obtained for watersheds of up to 24.28 km2 (PRUSKI et al., 2006). This area covers all watersheds
of the excerpts that compose the watershed of Banabuiú dam.
0.64
0 c
S L 52.64
t
(25)
In which,
L - length of the river excerpt of the watershed, in km, and
0
S - mean slope of the thalweg, same as eq.(21), but in m km-1.
The term L was also determined by the GIS software. The celerity of the hydrogram (ck) was
determined from Manning equation, considering the roughness coefficient in all excerpts of rivers
in the watershed asn0,035:
0.4 0.6
0.4 0 0.3 0 k
B n
Q S 1.67
c (26)
Thus, the increment of distance for implementing Muskingun-Cunge method was determined by the non-linear equation presented in TUCCI & BELTRAME (2004), using the iterative method of Newton-Rapson:
1.25
0 k
0 k
Δx
S c B
Q 1
Δt
c 0.761
Δx
(27)
RESULTS AND DISCUSSION
Stored, precipitated, affluents and effluents volumes
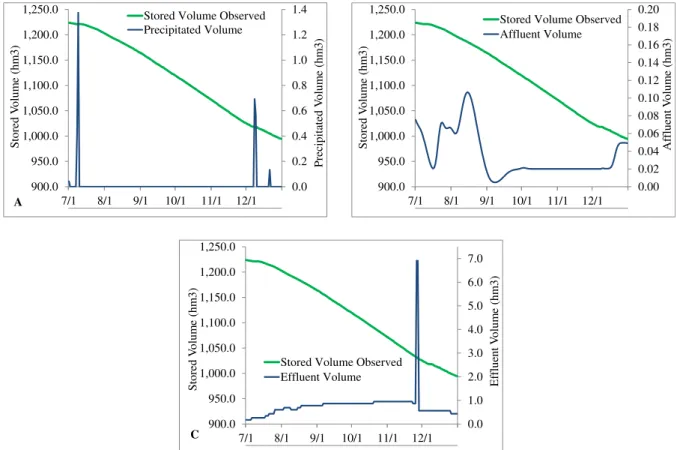
Figure 4 expose daily precipitated (A), affluents (B) and effluents (C) values and the stored
volumes observed in the reservoir. The precipitated volume was around 3.2 hm3, and about 50%
(1.4 hm3) of this value occurred on July 8th, 2005, as shown in Figure 3. All volume precipitated in
the dry period amounted to 0.29% of the mean volume stored (1,116.3 hm3) and 1.41% of the
volume lost (229.1 hm3) in the reservoir during this period.
The affluent total volume in the period was 6.4hm3, corresponding to 0.6% of the mean
0.0 0.2 0.4 0.6 0.8 1.0 1.2 1.4 900.0 950.0 1,000.0 1,050.0 1,100.0 1,150.0 1,200.0 1,250.0
7/1 8/1 9/1 10/1 11/1 12/1
Precipitated V olu m e (hm 3) Sto red V olu m e (hm 3)
Stored Volume Observed Precipitated Volume A 0.0 1.0 2.0 3.0 4.0 5.0 6.0 7.0 900.0 950.0 1,000.0 1,050.0 1,100.0 1,150.0 1,200.0 1,250.0
7/1 8/1 9/1 10/1 11/1 12/1
Ef flu en t V olu m e (hm 3) Sto red V olu m e (hm 3)
Stored Volume Observed Effluent Volume C 0.00 0.02 0.04 0.06 0.08 0.10 0.12 0.14 0.16 0.18 0.20 900.0 950.0 1,000.0 1,050.0 1,100.0 1,150.0 1,200.0 1,250.0
7/1 8/1 9/1 10/1 11/1 12/1
Af flu en t V olu m e (h m 3) Sto red V olu m e (hm 3)
Stored Volume Observed Affluent Volume
FIGURE 4. Daily variation of stored volume and precipitated (A), and affluent (B), and effluent (C) volumes in Banabuiú reservoir, State of Ceará, from July 1st to December 31st, 2005.
The total effluent volume (141.7 hm3) accounted for 12.7% of the mean stored volume in the
period and 61.8% of the total lost in the reservoir in the second semester of 2005. Estimation of evaporation
According to Thiessen polygon technique performed in the watershed of Banabuiú, just
Quixadá DCP, located at coordinates 4°59’18.5” S and 39°0’40.2” W, has an area of influence on
the watershed of Banabuiú dam (Figure 5).
Figure 6 presents the daily variations of evaporation in Banabuiú reservoir, in 2005, according to the methods of Kohler-Nordenson-Fox (K-N-F), Priestley-Taylor (P-T), Penman (P), deBruin-Keijman (dB-K) , Brutsaert-Stricker (B-S), and deBruim (dB), as well as the mean precipitation in the watershed. Visually, it is clear that dB method underestimates evaporation during the rainy season and overestimates out of it, compared to the other methods, and has the highest amplitude in evaporation data throughout the year. In the dry period, the estimate of evaporation is higher in dB, followed by P, dB-K and P-T, and K-N-F and B-S. In the rainy season, the estimation of evaporation is lower in K-N-F and dB and higher in P-T, P, dB-K and B-S.
Of the six methods for estimating evaporation mentioned above, only the method K-N-F has not been evaluated by ROSENBERRY et al. (2007) in a mountainous region in the northeastern United States. The other methods were compared to the energy balance method, according to the authors, considered standard. The methods P-T, dB-K and P had values that did not deviate by more than 20% of the standard method during 90% of the studied period, being the most appropriate. When examining Figure 6, it is observe that, for Banabuiú dam, these methods also have similar results, primarily P-T and dB-K, whose curves overlap over the 2005, and the P method disagrees with them on the drought period.
0 5 10 15 20 25 30 35 40
0 2 4 6 8 10 12 14
P
re
cipi
tation (mm
)
Eva
pora
ti
on
(mm)
Mean ppt K-N-F
P-T Penman
dB-K B-S
deBruim
FIGURE 6. Evaporation in Banabuiú reservoir, throughout 2005, estimated according to the methods of Kohler-Nordenson-Fox (K-N-F), Priestley-Taylor (P-T), Penman (P), deBruin-Keijman (dB-K), Brutsaert-Stricker (B-S), deBruim (dB) and mean
precipitation in the watershed of the reservoir (Ppt media - Mean precipitation.
LEITÃO et al. (2007) studied the performance of different methods for estimating the evaporation in Cariri and Sertão regions, of the state of Paraíba, including P and K-N-F methods. The results, just as in this study, presented that, in higher evaporation period, the estimate of evaporation by P is higher than the estimated by K-N-F.
As can be seen in Table 2, which presents the descriptive statistics of climatological data used to estimate the evaporation in this study, the coefficient of variation indicates that the highest data variation occurs for WSmea, followed by RHmin and SR.
TABLE 2. Descriptive statistics of climatological data obtained in Quixadá Data Collection Platform, in the dry period, in 2005.
Statistics Tmax oC Tmea oC Tmin oC RHmax % RHmea % RHmin % WSmea m s-1 kJ mSR -2 dia-1
Minimum 29.56 25.37 18.10 69.26 47.62 19.96 1.86 9,867.89
1st Quartile 33.58 27.27 20.85 81.40 53.54 25.18 3.05 19,645.24
Mean 34.30 28.13 21.96 84.86 56.68 28.49 3.48 20,986.99
Medium 34.42 28.33 22.20 84.35 56.22 27.62 3.57 21,686.31
3rd Quartile 35.28 28.99 23.02 89.18 59.04 30.41 3.99 23,588.44
Maximum 36.72 30.61 25.26 94.70 73.45 54.89 4.71 25,599.45
Standard deviation 1.30 1.11 1.56 5.19 4.31 5.25 0.66 3,448.41
Amplitude 7.16 5.25 7.16 25.44 25.83 34.93 2.85 15,731.56
Coefficient of variation 3.8% 4.0% 7.1% 6.1% 7.6% 18.4% 18.9% 16.4%
Tmax - maximum temperature; Tmea - mean temperature; Tmin - minimum temperature; RHmax - maximum relative humidity; RHmea - mean relative humidity; RHmin - minimum relative humidity; WSmea - mean wind speed; and SR - solar radiation.
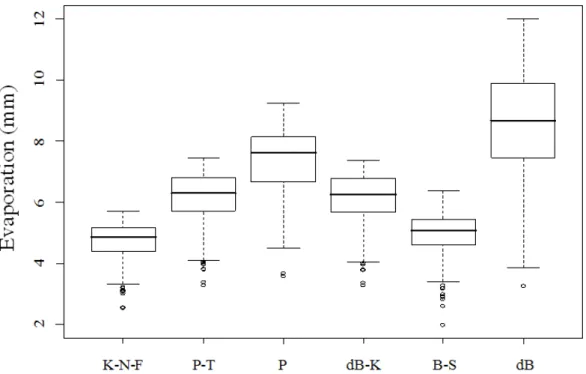
The distributions of the evaporation estimates by the different studied methods, in the period from July 1st to December 31st, 2005, are illustrated in Figure 7. The greatest variation of the data occurred in dB method and the lowest occurred in K-N-F method. It was also observed that the highest estimates were verified by dB and P methods, the lowest by K-N-F and B-S methods, and the intermediate estimates by P-T and dB-K methods.
The values of total evaporation estimated by the six methods studied, in the second semester of 2005, in Banabuiú dam are presented in Table 3. It is noted that the dB method presented overestimation of evaporation compared to the other methods, varying from 81.6% (comparing to K-N-F) to 16.5% (comparing to P). The K-N-F method underestimated evaporation, ranging from 55.1% of the estimate obtained by dB method to 95.6% of the estimate obtained by B-S.
TABLE 3. Evaporated depth and volume in Banabuiú dam, according to the different methods of evaporation estimate, in 2005.
Method K-N-F P-T P dB-K B-S dB
Depth (mm) 864.51 1,125.58 1,347.15 1,117.41 904.01 1,569.67
Volume (hm3) 81.32 105.89 126.54 105.14 85.25 147.08
K-N-F - Kohler-Nordenson-Fox, P-T - Priestley-Taylor, P - Penman, dB-K - deBruin-Keijman, B-S - Brutsaert-Stricker, dB - deBruim
Considering the variation of the volume stored in the reservoir between January 1st and
December 31st, 2005, which was from 1252.9 hm3 to 994.5 hm3, therefore 258.4 hm3, the methods
studied showed that the evaporation estimate ranged from 31.4 to 56.9% of volume lost in the reservoir. P-T and dB-K methods, whose evaporation estimates were very close, accounted for about 41% of the volume lost in the reservoir. ARAÚJO & PIEDRA (2009) estimated evaporation corresponding to 55% of the volume stored in reservoirs in Aiuaba-CE.
PEREIRA et al. (2009) found 1,904 mm of annual depth evaporated on Sobradinho Lake, estimated by K-N-F method, around 21% above the estimate for Banabuiú dam.
The performance of the methods in evaporation estimate can be seen by Figure 8, in which are the variations of the stored, observed and estimated volumes by six the methods, during the second semester of 2005. This figure presents the mean precipitations in the watershed of the reservoir, where it can be seen that there was practically no precipitation, greatly reducing the affluent volume into the reservoirs at this period, especially considering the intermittency of most natural drains. In this period, only the rivers transformed in perennial by some reservoir upstream contribute to this type of input.
0.0 2.0 4.0 6.0 8.0 10.0 12.0 900.0 950.0 1,000.0 1,050.0 1,100.0 1,150.0 1,200.0 1,250.0 1,300.0
7/1 8/1 9/1 10/1 11/1 12/1
M ea n pr ecipitatio n (m m ) Stor ed vo lum e (hm 3)
Mean Prec. of the Watershed Stored Volume Observed Stored Volume Estimated
0.0 2.0 4.0 6.0 8.0 10.0 12.0 900.0 950.0 1,000.0 1,050.0 1,100.0 1,150.0 1,200.0 1,250.0 1,300.0
7/1 8/1 9/1 10/1 11/1 12/1
M ea n pr ecipitatio n (m m ) Stor ed vo lum e (hm 3)
Mean Prec. of the Watershed Stored Volume Observed Stored Volume Estimated
0.0 2.0 4.0 6.0 8.0 10.0 12.0 900.0 950.0 1,000.0 1,050.0 1,100.0 1,150.0 1,200.0 1,250.0 1,300.0
7/1 8/1 9/1 10/1 11/1 12/1
M ea n pr ecipitatio n (m m ) Stor ed vo lum e (hm 3)
Mean Prec. of the Watershed Stored Volume Observed Stored Volume Estimated
0.0 2.0 4.0 6.0 8.0 10.0 12.0 900.0 950.0 1,000.0 1,050.0 1,100.0 1,150.0 1,200.0 1,250.0 1,300.0
7/1 8/1 9/1 10/1 11/1 12/1
M ea n pr ecipitatio n (m m ) Stor ed vo lum e (hm 3)
Mean Prec. of the Watershed Stored Volume Observed Stored Volume Estimated
0.0 2.0 4.0 6.0 8.0 10.0 12.0 900.0 950.0 1,000.0 1,050.0 1,100.0 1,150.0 1,200.0 1,250.0 1,300.0
7/1 8/1 9/1 10/1 11/1 12/1
M ea n pr ecipitatio n (m m ) Sto red v olu m e (hm 3)
Mean Prec. of the Watershed Stored Volume Observed Stored Volume Estimated
0.0 2.0 4.0 6.0 8.0 10.0 12.0 900.0 950.0 1,000.0 1,050.0 1,100.0 1,150.0 1,200.0 1,250.0 1,300.0
7/1 8/1 9/1 10/1 11/1 12/1
M ea n pr ecipitatio n (m m ) Sto red v olu m e (hm 3)
Mean Prec. of the Watershed Stored Volume Observed Stored Volume Estimated
K-N-F
P-T
P
dB-K
B-S
dB
FIGURE 8. Volume daily stored, observed and estimated by the methods of Kohler-Nordenson-Fox (K-N-F), Priestley-Taylor (P-T), Penman (P), deBruim-Keijman (dB-K), Brutsaert-Stricker (B-S) and deBruim (dB); and mean precipitation in the watershed of Banabuiú dam, in the second semester of 2005.
Table 4 shows the statistical results used to evaluate the performance of the water balance estimate realized by the model developed, in the second semester of 2005, using the six methods of
evaporation estimate in Banabuiú. These results indicate “Optimal” performance (c0,85),
TABLE 4. Performance of water balance estimate during dry period as a function of the method used in the evaporation estimate in Banabuiú reservoir.
Banabuiú
Statistics K-N-F P-T P dB-K B-S dB
R 0.9989 0.9992 0.9993 0.9992 0.9991 0.9992
Id 0.9833 0.9991 0.9967 0.9990 0.9882 0.9851
C 0.9823 0.9983 0.9960 0.9982 0.9873 0.9843
K-N-F - Kohler-Nordenson-Fox; P-T - Priestley-Taylor; P - Penman; dB-K - deBruim-Keijman; B-S - Brutsaert-Stricker; dB - deBruim; R - Coefficient of correlation; Id - Willmott coefficient of concordance; C - Indexo of confidence or performance (CAMARGO & SENTELHAS, 1995)
In LEITÃO et al. (2007), P and K-N-F methods had performances classified as “Good” and
“Tolerable” in Cariri and Sertão regions, respectively, and they were the methods that had the worst
performances in evaporation estimate, when the results were compared to the evaporation observed
in standard tank of 20 m2.
Although performances are in the same class (“Optimal”), P-T and dB-K methods provided
better performance in Banabuiú dam, considering evaporation only in the second semester.
CONCLUSIONS
The methods of Kohler-Nordenson-Fox, Priestley-Taylor, Penman, deBruim-Keijman, Brutsaert-Stricker and deBruim are appropriate to evaporation estimate in Banabuiú dam, during the dry season, once the statistical indexes indicate optimal performance for the two methods to evaporation estimate as a component of water balance.
The methods of Priestley-Taylor and deBruim-Keijman are the most appropriate to use as a component of the water balance in Banabuiú dam, in the state of Ceará, since they have the best statistics of confidence or performance in relation to the other methods tested in this study.
The methodology presented was feasible for determining the components of the water balance in semiarid reservoirs, especially in the dry season, allowing us to simulate the decrease in the level and volume of the reservoir based on data collected from automatic weather stations.
ACKNOWLEDMENTS
To the Company of Management of Water Resources of the States of Ceará (COGERH); Ceará Foundation for Meteorology and Hydro Resources (Funceme) and the National Department of Works Against Drought (Dnocs), for the promptness in providing the data, and to the Foundation for Support in Scientific and Technological Development of Ceará (FUNCAP) for the support in the form of research grant.
REFERENCES
ALVES, J.J.A.; ARAÚJO, M.A.; NASCIMENTO, S.S. Degradação da Caatinga: uma investigação
ecogeográfica. Revista Caatinga, Mossoró, v.22, n.3, p.126-135, 2009.
ARAÚJO, J.C.; PIEDRA, J.I.G. Comparative hydrology: analysis of a semiarid and a humid
tropical watershed. Hydrological Processes, Chichester, v.23, n.8, p.1169-1178, 2009.
ASHRAF, M.; KAHLOWN, M. A.; ASHFAQ, A. Impact of small dams on agriculture and
groundwater development: A case study from Pakistan. Agricultural Water Management,
Amsterdam, n.92, p.90-98, 2007
BURMAN, L.; POCHOP, L.O. Evaporation, evapotranspiration and climatic data. Amsterdan:
CAMPOS, J.N.B. Modeling the Yield-Evaporation-Spill in the Reservoir Storage Process: The
Regulation Triangle Diagram. Water Research Management, Wageningen, v.24, n.13, p.3487-3511,
2010.
CAMPOS, J.N.B.; CAMPOS, V.R.; MOTA, F.A. O custo da garantia da água bruta: o caso dos rios
intermitentes do Ceará. Rega, Porto Alegre, v.6, n.1, p.55-66, 2009.
CEARÁ. Secretaria dos Recursos Hídricos (SRH). Atlas eletrônico dos recursos hídricos do Ceará. Fortaleza: SRH, 2009. Disponível em <http://atlas.srh.ce.gov.br/>. Acesso: 19 nov. 2009.
GIANNIOU, S.K.; ANTONOPOULOS, V.Z. Evaporation and energy budget in Lake Vegorits,
Greece. Journal of Hydrology, Amsterdam, v.345, p.212-223, 2007.
LEÃO, R.A.O.; TSUCHIYA, S.K.; ROCHA NETO, O.C.; TEIXEIRA, A.S.; SOARES, A.A. Estimativa da evaporação no reservatório Pedras Brancas, Estado do Ceará-Brasil e análise de sensibilidade dos métodos de estimativa à variação nos dados climatológicos. In: CONGRESSO
NACIONAL DE IRRIGAÇÃO E DRENAGEM, 19., 2009, Montes Claros. Anais... Brasília: ABID,
2009. 1 CD-ROM.
LEITÃO, M.M.V.B.R.; OLIVEIRA, G.M.; LEITÃO, T.J.V. Avaliação do desempenho de
diferentes métodos de estimativa da evaporação para duas regiões da Paraíba. Revista Brasileira de
Engenharia Agrícola e Ambiental, Campina Grande, v.11, n.6, p.585-593, 2007.
KROL, M.S.; BRONSTERT, A. Regional integrated modelling of climate change impacts on
natural resources and resources usage in semi-arid Northeast Brazil. Environmental Modelling &
Software, Oxford, v.22, p.259-268, 2007.
MATOS, A.T.; SILVA, D.D.; PRUSKI, F.F. Impactos decorrentes da construção de reservatórios
para acumulação de água. Item, Brasília, n.56/57, p.60-66, 2003.
PEREIRA, A.R.; VILLA NOVA, N.A.; SEDIYAMA, G.C. Evapo(transpi)ração. Piracicaba:
FEALQ, 1997. 183 p.
PEREIRA, S.B.; PRUSKI, F.F.; SILVA, D.D.; RAMOS, M.M. Evaporação líquida no lago do
Sobradinho e impactos no escoamento devido à construção do reservatório. Revista Brasileira de
Engenharia Agrícola e Ambiental, Campina Grande, v.13, n.3, 2009.
PRUSKI, F.F.; BRANDÃO, V.S.; SILVA, D.D. Escoamento superficial. Viçosa-MG: Editora
UFV, 2006. 87 p.
ROSENBERRY, D.O.; WINTER, T.C.; BUSO, D.C.; LIKENS, G.E. Comparison of 15
evaporation methods applied to a small mountain lake in the northeastern USA. Journal of
Hydrology, Amsterdam, v.340, p.149-166, 2007.
TANNY, J.; COHEN, S.; ASSOULINE, S.; LANGE, F.; GRAVA, A.; BERGER, D.; TELTCH, B.; PARLANGE, M.B. Evaporation from a small water reservoir: Direct measurements and estimates.
Journal of Hydrology, Amsterdam, n.351, p.218-229, 2008.
TUCCI, C.E.M.; BELTRAME, L.F.S. Evaporação e evapotranspiração. In: TUCCI, C.E.M. (org.)