THE BROAD SPECTRUM OF BIOACTIVE PROPERTIES OF
PHENOLIC EXTRACTS:
A PROSPECTIVE STUDY IN THREE DIFFERENT PLANTS
Inès Jabeur
Dissertation Presented to the
Polytechnic Institute of Bragança, Portugal
To obtain the
Master Degree in Biotechnological Engineering
Supervisor
:
Isabel C.F.R. Ferreira
Co-supervisors: Rui M.V. Abreu & Lotfi Achour
Bragança
Table of Content List of Tables List of Figures Acknowledgement List of Abbreviations Abstract
1 MEDICINAL PLANTS ... 1
1.1 Medicinal plants ... 1
1.1.1 The extended use of medicinal plants... 1
1.1.2 The particular case of Hypericum androsaemum L., Tilia platiphyllos Scop. and Equisetum giganteum L. ... 2
1.1.2.1 Hypericum androsaemum L. ... 2
1.1.2.2 Tilia platiphyllos Scop. ... 3
1.1.2.3 Equisetum giganteum L. ... 4
1.2 Phenolic compounds as bioactive molecules... 5
1.2.1 Chemical aspects of phenolic compounds ... 5
1.2.2 Reported bioactive properties ... 7
1.2.2.1 Antioxidant activity of phenolic compounds ... 7
1.2.2.2 Antitumor activity of phenolic compounds ... 7
1.2.2.3 Anti-inflammatory activity of phenolic compounds ... 8
1.2.3 The presence of these compounds in Hypericum androsaemum L., Tilia platiphyllos Scop. and Equisetum giganteum L. ... 9
1.3 Bioactive properties of the plants under study ... 9
1.3.1 Antioxidant properties ... 9
1.3.2 Antitumor properties ... 10
1.3.3 Anti-inflammatory properties ... 11
1.4 Objectives ... 12
2 MATERIALS AND METHODS ... 13
2.1 Standards and reagents ... 13
2.2 Extracts preparation ... 13
2.3 Evaluation of the antioxidant activity ... 14
2.3.1 DPPH radical-scavenging activity assay ... 14
2.3.2 Reducing power by ferricyanide/Prussian blue assay ... 15
2.3.3 Inhibition of β-carotene bleaching ... 16
2.3.4 Thiobarbituric acid reactive substances (TBARS) assay... 16
2.4 Evaluation of the anti-inflammatory activity... 17
2.4.2 Nitric oxide determination ... 18
2.5 Evaluation of the cytotoxic activity ... 19
2.5.1 In tumor cell lines ... 19
2.5.2 In non-tumor porcine liver cells (PLP2) ... 19
2.6 Chemical characterization of the extracts ... 20
2.7 Statistical analysis ... 21
3 RESULTS AND DISCUSSION... 22
3.1 Studies with H. androsaemum ... 22
3.1.1 Antioxidant activity ... 22
3.1.2 Cytotoxic activity in tumor and non-tumor cells ... 23
3.1.3 Anti-inflammatory activity ... 24
3.1.4 Chemical characterization ... 24
3.2 Studies with T. platyphyllos and E. giganteum ... 29
3.2.1 Antioxidant activity ... 29
3.2.2 Cytotoxic activity in tumor and non-tumor cells ... 29
3.2.3 Anti-inflammatory activity ... 31
3.2.4 Chemical characterization ... 31
4 CONCLUSION ... 42
List of Tables
Table 1.The major classes of phenolic compounds in plants (Soto et al., 2015). ... 6
Table 2. In vitro antioxidant, antitumor and anti-inflammatory properties of H. androsaemum ethanol: water extract (mean ± SD). ... 22
Table 3. Retention time (Rt), wavelengths of maximum absorption in the visible region (max), mass spectral data, identification and quantification (mean ± SD) of phenolic compounds in the H. androsaemum ethanol:water extract. ... 28
Table 4. In vitro antioxidant, antitumor and anti-inflammatory properties of T. platyphyllos and E. giganteum ethanol: water extracts (mean ± SD). ... 30
Table 5. Retention time (Rt), wavelengths of maximum absorption in the visible region (max), mass spectral data, identification and quantification (mean ± SD) of phenolic compounds in Equisetum giganteum extract. ... 33
Table 6. Retention time (Rt), wavelengths of maximum absorption in the visible region (max), mass spectral data, identification and quantification (mean ± SD) of phenolic compounds in Tilia platyphyllos extract. ... 36
List of Figures Figure 1. Hypericum androsaemum L.. ... 2
Figure 2. Tilia platiphyllos Scop.. ... 3
Figure 3. Equisetum giganteumL... 4
Figure 4. Common phenolic compounds found in medicinal plants. ... 6
Figure 5.Dried samples of Equisetum giganteum L.,Hypericum androsaemum L. and Tilia platyphyllos Scop. ... 14
Figure 6.Microplate showing the DPPH assay. ... 15
Figure 7.Microplate showing the reducing power assay. ... 15
Figure 8.Test tubes showing the β-carotene bleaching assay before absorbance measurement. ... 16
Figure 9. Test tubes showing the TBARS assay before absorbance measurement. ... 17
Figure 10. Microplate showing the anti-inflammatory activity assay. ... 18
Figure 11.Microplate showing the cytotoxic evaluation assay. ... 20
Figure 12. Phenolic compounds profile of the H. androsaemum ethanol:water extract recorded at 280 nm. The numbering correspond to the peak number presented in Table 3... 27
Acknowledgements
First of all, I would like to express my deepest gratitude and sincere thanks to my supervisor
Prof. Isabel C.F.R. Ferreira for giving me the opportunity to carry out my research project in a very good working environment at the Mountain Research Centre (CIMO), ESA, Polytechnic Institute of Bragança Portugal. You offered continuous advices and encouragement and I benefitted from your knowledge and scientific experience. I appreciate your effort and I want to thank you for your guidance, kindness and continuous availability. I would also like to express my special thanks to my co-supervisor Prof. Lotfi Achour of
the Laboratoire de Recherche “Bioressources: Biologie Intégrative & Valorisation”, Institut
Supérieur de Biotechnologie de Monastir, Tunisia. Despite the distance you have been of great help for the successful completion of this project. I hope these few lines make you feel the immense respect that I have for you. Thank you so much.
I would also like to express my sincere appreciation to Dr. Rui M.V. Abreu for co-supervising this research work. I appreciate your advice and encouragement.
I also want to thank all researchers of the Mountain Research Centre (CIMO), ESA, Polytechnic Institute of Bragança and the Biochemcore research group for all their advice and encouragement. Special thanks to Dr. Lillian Barros, Dr. Ricardo C. Calhelha, Dr. Josiana Vaz and Dr. Ângela Fernandes.
I also want to commend the Erasmus+ ICM program for giving me the opportunity to study in one of the most multicultural institutes in Portugal. It has been a wonderful experience for me and I want to use this opportunity to thank all the teaching and non-teaching staff of the Polytechnic Institute of Bragança for providing such a good atmosphere for learning.
My sincere thanks also goes to the scientific commission of the Biotechnological Engineering
master’s programme and to all my professors for their support, advices and criticism that guided me to successfully complete this programme.
I finally, want to thank my friends who helped me in one way or the other to achieve my dreams and successfully complete this research work. I will never forget all their efforts. Deep thanks!
List of Abbreviations
λ max Wavelengths of maximum absorption 5-LOX 5-Lipooxygenase
A Absorbance of the control
B Absorbance of the sample solution ADPPH Absorbance of DPPH solution
AS Absorbance of sample
CBI β-Carotene bleaching inhibition CE Collision energy
CES Collision energy spread COX-2 Cyclooxygenase-2 DNA Deoxyribonucleic acid
DPPH 2,2-Diphenyl-1-picrylhydrazyl
DMEM Dulbecco’s modified Eagle’s minimum essential medium
DMSO Dimethyl sulfoxide DP Declustering potential
EC50 Extract concentration achieving 50% of antioxidant/anti-inflammatory activity
ECACC European collection of animal cell culture EMS Enhanced mass spectrometer
EPI Enhanced product ion FBS Fetal bovine serum
GI50 Extract concentration achieving 50% of growth inhibition in cell lines HBSS Hank’s balanced salt solution
HepG2 Hepatocellular carcinoma cells HeLa Human cervical carcinoma cell line
HPLC High performance liquid chromatography
IC50 Extract concentration achieving 50% of antioxidant/anti-inflammatory activity
ICAM-1 Intercellular adhesion molecule-1 IL-1β Interleukin 1β
IL-6 Interleukin 6 IL-8 Interleukin 8
LPS Lipopolysaccharide MCF-7 Breast carcinoma cells MDA Malondialdehyde MS Mass spectrometer
NCI-H460 Non-small cell lung cancer cells
NED N-(1-napthyl) ethylenediamine hydrochloride NF-κβ Nuclear factor-κB
NO Nitric oxide
PDA Photodiode array detector PGE2 Prostaglandin E2
PI3K Phosphoinositide 3-kinase PLP2 Non-tumor liver cells RNS Reactive nitrogen species ROS Reactive oxygen species RP Reducing power
RSA Radical-scavenging activity RSS Reactive sulphur species Rt Retention time
SD Standard deviation SRB Sulforhodamine B TCA Trichloroacetic acid TNF-α Tumour necrosis factor α UV Ultraviolet
Abstract
Medicinal plants have received great attention in the last years because of their richness in bioactive compounds responsible for different biological activities. In the present study, hydroethanolic extracts of Hypericum androseamum L., Equisetum giganteum L. and Tilia platyphyllos Scop., were chemically characterized in terms of phenolic composition and
evaluated for their antioxidant, antitumor and anti-inflammatory properties. All three medicinal plants displayed antioxidant activity as free radical scavengers but mainly as lipid peroxidation inhibitors. The extracts were also effective in inhibiting nitric oxide production, as an indicator of the anti-inflammatory potential, displayed antitumor properties in breast carcinoma (MCF-7), non-small cell lung cancer (NCI-H460), cervical carcinoma (HeLa) and hepatocellular carcinoma (HepG2) cell lines and, up to the maximal tested concentration, did not show any cytotoxic effects for non-tumor cells. 5-O-Caffeoylquinic acid and 3-O
-caffeoylquinic acid were the most abundant phenolic compounds identified in the H. androsaemum extract, and might be responsible for the observed bioactivity. Protocatechuic
acid and epicatechin were most abundant in the T. platyphyllos extract, while kaempferol-O
-glucoside-O-rutinoside was the most abundant phenolic compound in the E. giganteum
extract. The results showed that these medicinal plants displayed very interesting bioactivities, which are related with phenolic composition and quantity. However, it would be interesting to evaluate the in vivo efficacy of these plant extracts, as also their mechanisms of action, in
1
1
MEDICINAL PLANTS
1.1 Medicinal plants
1.1.1 The extended use of medicinal plants
Natural resources like plants are currently used all over developed and under developed countries of the world as traditional home remedies and are promising agents for drug discovery as they play crucial role in traditional medicine. The use of plants for medicinal purpose usually varies from country to country and region to region because their use depends on the history, culture, philosophy and personal attitudes of the users (Ahmad et al., 2015). The use of plants and plant products as drugs predates the written human history (Hayta et al., 2014). Plants are a very important resource for traditional drugs and around 80% of the population of the planet use plants for the treatment of many diseases and traditional herbal medicine accounts for 30-50% of the total medicinal consumption in China. In North America, Europe and other well-developed regions over 50% of the population have used traditional preparations at least once (Dos Santos Reinaldo et al., 2015).
Medicinal plants have been used over years for multiple purposes, and have increasingly attract the interest of researchers in order to evaluate their contribution to health maintenance
and disease’s prevention (Murray, 2004). Recently between 50,000 and 70,000 species of plants are known and are being used in the development of modern drugs. Plants were the main therapeutic agents used by humans from the 19th century, and their role in medicine is always topical (Hayta et al., 2014).
The studies of medicinal plants are rapidly increasing due to the search for new active molecules, and to improve the production of plants or bioactive molecules for the pharmaceutical industries (Rates, 2001). Several studies have been reported, but numerous active compounds directly responsible for the observed bioactive properties remain unknown, while in other cases the mechanism of action is not fully understood.
2
1.1.2 The particular case of Hypericum androsaemum L., Tilia platiphyllos Scop. and Equisetum giganteum L.
1.1.2.1 Hypericum androsaemum L.
Hypericum androsaemum L. (Hypericaceae family), commonly known as “Tutsan”, is a
medicinal plant species growing in damp or shady places in Europe (Valentão et al., 2004). Several studies on anti-depressive, anti-inflammatory, antitumor, antimicrobial, antioxidant and antiviral benefits of Hypericum perforatum L. have been reported (Rainha et al., 2011;
Nogueira et al., 2013).
Figure 1. Hypericum androsaemum L. (http://luzcardoso.blogspot.pt/2009/02/hipericao
3
However, based on recent findings, other Hypericum species have also revealed very
interesting functional properties. Hypericum androsaemum L. (Figure 1), commonly known
as sweet-amber, has a popular use as cholagogue, hepatoprotector, nephroprotective and diuretic (Guedes et al., 2003). Hypericum genus (Hypericaceae) includes 18 species, among which 15 have spontaneous grow, and can be found in three regions in Portugal (three in Azores, one in Madeira and eleven in mainland) (Ramalhete et al., 2016). H. androsaemum
has been used in traditional herbal medicine by different cultures. In the Portuguese folk medicine, the plant known locally as “Hipericão do Gerês”, is known for its diuretic effect and leaf infusions are used for liver, kidneys and bladder diseases. In Britain and France,
Tutsan means “all-healthy”, or “all heal” due to its medicinal properties. In England the pounded leaves are mixed with lard to get an ointment for wounds and dressing cuts (Caprioli et al., 2016).
1.1.2.2 Tilia platiphyllos Scop.
Tilia platiphyllos Scop. is a flowering plant in the family of Tiliaceae, native to most of the
temperate Northern Hemisphere, Asia, Europe and North America; covers virtually the entire continent of Europe except for large parts of Scandinavia and it is absent in western North America. T. platyphyllos (Figure 2) is often planted as an ornamental tree in parks and as a
shade or lawn tree. They are resistant to drought, dry winds and low temperatures; they are suitable for planting and trade protection (Radoglou et al., 2008).
Figure 2. Tilia platiphyllos Scop. (http://eattheplanet.org/wp
4
T. platiphyllos, is one of lime flower species used as a traditional medicinal plant in Europe
and Latin America mainly as sedatives and tranquilizers. Based on its medicinal benefit, infusions of their inflorescences are used to prepare tea (Cotrim et al., 1999). It has been reported to have antispasmodic properties, being used since ancient times for treatment of diseases such as hypertension associated with atherosclerosis and nervous tension (Karioti et al., 2014), migraine, cold fever, hysteria and blood pressure (Ropiak et al., 2016). Also
because of their soothing and hydrating properties, extracts of this plant may find application in the phytocosmetic industry (Karioti et al., 2014).
1.1.2.3 Equisetum giganteum L.
Equisetum giganteum L. (Equisetaceae Hippocrates subgenus), also called “cavalinha”, “caballo de cola”, “horsetail” or “giant horsetail” (Francescato et al., 2013). It is a lower
vascular plant found in Southern and Central America (Danielski et al., 2007).
Figure 3. Equisetum giganteumL. (http://gardenofeaden.blogspot.pt/2013/06/the
5
This species is used mainly in Mexico, Guatemala, Venezuela, Argentina and other countries as traditional medicine. The aerial parts have been widely used as a diuretic in herbal medicine with no oral toxicity observed, to treat liver and urinary disorders and as food supplements. E. giganteum (Figure 3) was characterized for the first time in Argentina and
was commonly used as a diuretic, hemostatic and astringent. The plant infusion is also recommended for diarrhea, gonorrhea and to cure kidney stones as well as for weight loss in Brazil and Argentina (Francescato et al., 2013). Due to its high mineral contents and its remineralizing properties, the plant is also recommended for the revitalization of fingernails and lifeless hair, among other applications (Calvo et al., 2015).
1.2 Phenolic compounds as bioactive molecules 1.2.1 Chemical aspects of phenolic compounds
Plants produce secondary metabolites with bioactive properties, and phenolic compounds represent an important group of these compounds. They are usually found in fruits, vegetables, herbs, roots, leaves, and seeds and they play vital roles such as structure, innate defence system, reproduction or sensorial properties (colour, bitterness, taste and flavour) and the amount of phenolic compounds released may increase due to exposure to UV radiation, infection by pathogens and parasites and exposure to extreme temperatures (Soto et al., 2015). Phenolic compounds are secondary metabolites which are synthesized through the pentose phosphate, shikimate and phenylpropanoid pathways (Adeboye et al., 2014). Phenolic compounds are the most common secondary metabolites in the plant kingdom and the term
“Phenol” denotes a chemical structure comprising a phenyl ring bearing one or more hydroxyl substituents (Lattanzio, 2013). Phenolic compounds consist of more than one aromatic ring bearing and one or more hydroxyl functional groups (Min et al., 2015).
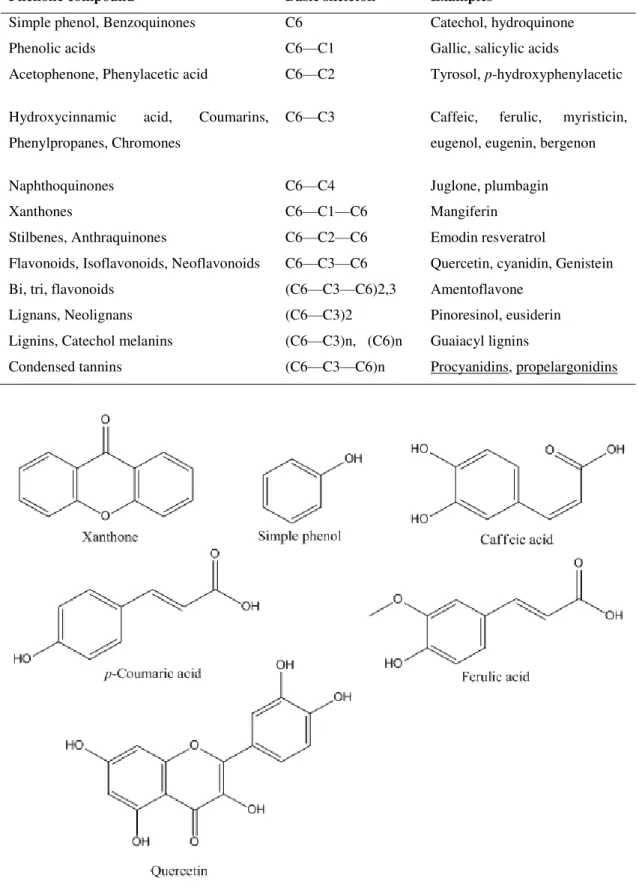
Phenolic compounds include a diversified group of molecules with a wide range of chemical structures identified as monomeric, dimeric, and polymeric phenolics. Several classes of phenolic compounds (Table 1) have been categorized on the basis of their basic carbon
skeleton ranging from phenolic acids, flavonoids, tannins, stilbenes, curcuminoids, coumarins, lignans, and quinones (Figure 4) and the amount of phenolic compound in each plant usually
6
Table 1.The major classes of phenolic compounds in plants (Soto et al., 2015).
Phenolic compound Basic skeleton Examples
Simple phenol, Benzoquinones C6 Catechol, hydroquinone
Phenolic acids C6—C1 Gallic, salicylic acids
Acetophenone, Phenylacetic acid C6—C2 Tyrosol, p-hydroxyphenylacetic
Hydroxycinnamic acid, Coumarins,
Phenylpropanes, Chromones
C6—C3 Caffeic, ferulic, myristicin,
eugenol, eugenin, bergenon
Naphthoquinones C6—C4 Juglone, plumbagin
Xanthones C6—C1—C6 Mangiferin
Stilbenes, Anthraquinones C6—C2—C6 Emodin resveratrol
Flavonoids, Isoflavonoids, Neoflavonoids C6—C3—C6 Quercetin, cyanidin, Genistein
Bi, tri, flavonoids (C6—C3—C6)2,3 Amentoflavone
Lignans, Neolignans (C6—C3)2 Pinoresinol, eusiderin
Lignins, Catechol melanins (C6—C3)n, (C6)n Guaiacyl lignins
Condensed tannins (C6—C3—C6)n Procyanidins, propelargonidins
7 1.2.2 Reported bioactive properties
As previously mentioned, phenolic compounds and their derivatives are one of the most important groups of secondary metabolites in plants, with several various physiological functions (Vidović et al., 2015). Many phenolic compounds have been reported to have potent anticarcinogenic, antimutagenic, antiatherosclerotic, antihypoglycemic, antibacterial, antifungal, antiviral, anti-thrombotic, cardioprotective and vasodilatory effects as well as antioxidant, antitumor and anti-inflammatory activities (Wojdyło et al., 2007; dos Santos Reinaldo et al.,2015; Touati et al., 2015).
1.2.2.1 Antioxidant activity of phenolic compounds
Phenolic acids are composed mainly of hydroxycinnamic and hydroxybenzoic acid derivatives. They are usually present in plant materials as esters and glycosides. Their antioxidant potential has been known to be due to their free radical scavenging property over hydroxyl, peroxyl radical, superoxide anion and peroxynitrites and also due to their chelating effect. Hydroxybenzoic acid derivatives include gallic acid and several tannins while hydroxycinamic derivatives and many others include coumaric, caffeic and ferulic acids (Carocho & Ferreira, 2013a). Phenolic compounds have been reported by Martins et al. (2016) to display promising antioxidant potential and the study of antioxidant properties of phenolic extracts of plant origin is one of the hottest subjects for researchers. They also reviewed several phenolic compounds (commercial and isolated compounds) from plant and concluded that anthocyanins, hydroxybenzoic and hydroxycinnamic acids derivatives are the most studied phenolic compounds. Flavonoids have also shown a wide range of biochemical and anti-allergic effects, but the most important biological activity of these compounds is the capacity to act as antioxidants (Karakaya & Nehir, 1999).
1.2.2.2 Antitumor activity of phenolic compounds
Phenolic compounds represent one of the most studied compounds worldwide because of their reported beneficial effect in promoting and maintaining good health. Several in vitro and in vivo studies have reported the important role of phenolic compounds in the fight against
8
activity of several phenolic compounds, measured in vitro or in vivo, and reported the
individual mechanism of antitumor action. Most of the compounds were reported to prevent activation of PI3K/Akt pathway usually associated with colon cancer, inhibit growth of cells by decreasing the hyper phosphorylation of the protein retinoblastoma, apoptosis and DNA damage of the cancer cells and finally causing tumor inhibition. Some of these compounds have been isolated and separated from natural products and have been clinically tried without negative effect or toxicity to the patient but the procedure is faced with several challenges allowing for more and more studies to be conducted.
1.2.2.3 Anti-inflammatory activity of phenolic compounds
Natural products such as plants, mushrooms, rhizomes and marine algae are an important source for isolating and developing potential therapeutic compounds that display anti- inflammatory effect with less toxicity. Some of these matrices have been known to display activity but it is also important to identify the bioactive metabolites that are responsible for this activity. Polysaccharides, terpenes, phenolic compounds, steroids and fatty acids are among the highlighted bioactive compounds. In particular, some of the phenolic compounds reported to display anti-inflammatory activity are benzenoids, syringaldehyde, syringic acid, cinnamic acid, protocathechuic acid and ethynylbenzene (Taofiq et al., 2016).
The NF-κB is a transcription factor that regulates the expression of several pro-inflammatory cytokines and enzymes such as IL-1β, TNF-α, iNOS, and COX-2 that are important in the inflammatory process. The mechanism of anti-inflammation by this natural compounds has been associated with a reduction in the release of nitric oxide (NO) and other inflammatory
mediators such as interleukins (IL 1β, IL-6, IL-8), tumor necrosis factor (TNF-α) and prostaglandin E2 (PGE2) from inflammatory cells. Several phenolic compounds such as flavonoids have been reported to display anti-inflammatory activity by inhibition of NF-κB
9
1.2.3 The presence of these compounds in Hypericum androsaemum L., Tilia platiphyllos Scop. and Equisetum giganteum L.
The composition of H. androsaemum in terms of phenolic compounds has been reported by
several authors, namely in aqueous (Valentão et al., 2004) and methanolic (Porzel et al., 2013) extracts from leaves and aerial parts of the plant (Rainha et al.,2011; Ramalhete et al., 2016). Many studies of H. androsaemum reported the presence of several phenolic compounds such
as flavonoids, phenolic acids (Caprioli et al., 2016) and xanthones which are usually present in the roots and its leaves (Valentão et al., 2002).
There are also reports on T. platyphyllos phenolics namely flavonol glycosides that together
with mucilage components have been pointed out as the active ingredients responsible for bioactive/medicinal properties of this plant (Toker et al., 2001; Stef et al., 2010; Karioti et al., 2014).
E. giganteum shows the presence of phenolic compounds derived from caffeic and ferulic
acids and flavonoid glycosides such as kaempferol and quercetin derivatives, in addition to styrylpyrone (Alavarce et al., 2015). Several studies report the presence of high amounts of phenolic compounds, such as flavones, isoflavones, flavonols and flavanols in this plant (Danielski et al., 2007).
1.3 Bioactive properties of the plants under study 1.3.1 Antioxidant properties
Free radicals are atoms, molecules or ions with unpaired electrons that are highly unstable and active towards chemical reactions with other molecules. They are derived from three elements: oxygen, nitrogen and sulphur, thus creating reactive oxygen species (ROS), reactive nitrogen species (RNS) and reactive sulphur species (RSS). Antioxidants provide a balance between the production and scavenging of ROS and when there is a disruption in this balance, there is over overproduction of ROS and the cells start to suffer the consequences of oxidative stress (Carocho & Ferreira, 2013a).
10
balance between oxidation and antioxidation a crucial concept in maintaining healthy biological system (Rahman et al., 2012).
The antioxidant activity of plant extracts is of particular interest because of their beneficial physiological activity on human health and due to the great potential to replace synthetic antioxidants used in medicines and food supplements (Stef et al., 2010).
Previous studies on H. androsaemum infusion showed strong antioxidant activity against
several free radicals namely against superoxide anion radical, hydroxyl radical and hypochlorous acid (Valentão et al., 2004). The antioxidant potential of H. androsaemum
aqueous extracts prepared from the whole plant (Hernandez et al., 2010; Ramos et al., 2013), aerial parts (Rainha et al., 2011) and leaves (Valentao et al., 2002) has been described. In addition, the hepatoprotective effects of aqueous extracts obtained from leaves were also reported, which were directly correlated with the antioxidant potential of this plant (Valentão et al., 2004).
The radical scavenging capacity of ethanolic extracts of T. platyphyllos was also previously
reported (Stef et al., 2010). Water and ethanolic extracts of E. giganteum were also previously
studied and show remarkable antioxidant activity that are explained by the presence of high amounts of phenolic compounds (Nagai et al., 2005). In vitro and in vivo antioxidant activities
of aqueous extract from leaves and flowers of T. platyphyllos were previously reported and
related with the abundance of phenolic compounds among them are quercetin and kaempferol derivatives (Majer et al., 2014; Yayalaci et al., 2014).
1.3.2 Antitumor properties
11
The antitumor potential of H. androsaemum aqueous extracts was previously studied (Xavier
et al., 2012) through the evaluation of its anti-proliferative and pro-apoptotic effects in human colorectal cancer cells. Also Dias et al. (2000) reported that H. androsaemum displayed potent
antitumor activity in vivo. Recent studies show that water extracts of this plant have protective
effect against oxidative damage of DNA responsible for the induction of colon carcinogenesis (Ramos et al., 2013). No reports could be found for the antitumor activity of extracts of T. platyphyllos and E. giganteum.
1.3.3 Anti-inflammatory properties
Inflammation is a complex biological response to remove harmful stimuli such as pathogens, damaged cells, or irritation from the body and this is usually associated with many diseases such as atherosclerosis, obesity, metabolic syndrome, and diabetes (Taofiq et al., 2015).When body cells get in contact with immune stimulants such as pathogens, inflammatory cells like macrophages, monocytes secrete cytokines and other mediators, which initiate the inflammation process. The common inflammatory mediators are interleukins (IL-1β, IL-6, IL-8), tumour necrosis factor (TNF-α), nuclear factor-κB (NF-κB), intercellular adhesion
molecule-1 (ICAM-1), inducible type cyclooxygenase-2 (COX-2), prostaglandin E2 (PGE2), 5-lipooxygenase (5-LOX), and inducible nitric oxide synthase (iNOS) that leads to the production of reactive nitrogen species such as nitric oxide (NO). Overproduction of these inflammatory mediators leads to different kinds of cell damage (Kanwar et al., 2009). Research studies are focused on finding plant extracts and their bioactive compounds that have the ability to suppress the production of inflammatory mediators through down regulation of the gene expression of different types of inflammatory mediators (Souza et al., 2015).
Some studies have shown that ethanol extracts of the aerial parts of H. androsaemum possess
anti-inflammatory activity (Šavikin et al., 2007). E.giganteum decoction and infusion are
12 1.4 Objectives
The main objective of the present study was to perform a prospective study of the bioactive compounds and properties in plants used in the traditional medicine, and contribute to increase scientific evidences of their uses.
The specific objectives were:
To evaluate the in vitro antioxidant, antitumor and anti-inflammatory properties of
hydroethanolic extracts of Hypericum androsaemum L., Tilia platiphyllos Scop., and Equisetum giganteum L.;
13
2
MATERIALS AND METHODS
2.1 Standards and reagents
HPLC grade acetonitrile 99.9% and analytical grade purity ethanol were from Fisher Scientific (Lisbon, Portugal). 2,2-Diphenyl-1-picrylhydrazyl (DPPH) was obtained from Alfa Aesar (Ward Hill, MA, USA). Formic acid, trolox (6-hydroxy-2,5,7, 8-tetramethylchroman-2-carboxylic acid), sulforhodamine B, trypan blue, trichloroacetic acid (TCA) and Tris were
from Sigma Chemical Co. (St. Louis, MO, USA). Dulbecco’s modified Eagle’s medium, Hank’s balanced salt solution (HBSS), fetal bovine serum (FBS), L-glutamine, trypsin-EDTA, penicillin/streptomycin solution (100 U/mL and 100 mg/ mL, respectively), were purchased from Gibco Invitrogen Life Technologies (California, USA). RAW264.7 cells were purchased from ECACC (“European Collection of Animal Cell Culture”) (Salisburg, UK), lipopolysaccharide (LPS) from Sigma and DMEM medium from HyClone. The Griess Reagent System Kit was purchased from Promega, and dexamethasone from Sigma. Water was treated in a Milli-Q water purification system (TGI Pure Water Systems, Greenville, SC, USA).
2.2 Extracts preparation
Aerial parts of Equisetum giganteum L., Tilia platyphyllos Scop. And Hypericum androsaemum L. (Figure 5) were provided by “Cantinho das Aromáticas”, an organic and
certified farm from Vila Nova de Gaia, Portugal. The dried samples were reduced to powder and submitted to the following extraction procedure in three independent experiments: 4 g were stirred with 30 mL of ethanol: water (80:20, v/v) for 1 h, filtered and re-extracted in the
same conditions. Ethanol was removed in a rotary evaporator (Büchi R-210, Flawil, Switzerland), while water was removed by lyophilisation. Finally, stock solutions of each hydroethanolic extract were prepared: 5 mg/mL in water/ethanol for antioxidant activity assays; 8 mg/mL in water for antitumor and anti-inflammatory assays, from which several dilutions were performed; and 2.5 mg/mL in ethanol: water (80:20, v/v) for phenolic
compound analysis (the extract was filtered through a 0.45 μm Whatman syringe filter and
14
Figure 5.Dried samples of Equisetum giganteum L.,Hypericum androsaemum L. and Tilia platyphyllos Scop.
2.3 Evaluation of the antioxidant activity
Four different assays were used to assess the in vitro antioxidant potential of plant extracts:
scavenging effects on DPPH (2,2-diphenyl-1-picrylhydrazyl) radicals (RSA), Reducing
power, measured by ferricyanide Prussian blue assay (RP), β-carotene bleaching inhibition (CBI) and lipid peroxidation inhibition (LPI).
2.3.1 DPPH radical-scavenging activity assay
This methodology was performed using a 96 well Microplate. The reaction mixture on the plate consists of 30 μL of extract solutions with different concentrations and 270 μL methanol containing DPPH radicals (6 × 10⁻⁵ mol/L). The mixture was left to stand for 1hour in the
dark, and the absorbance was read at 515 nm in the ELX800 Microplate Reader (Bio-Tek Instruments, Inc; Winooski, VT, USA) (Figure 6). The radical scavenging activity (RSA) was
calculated as a percentage of DPPH discoloration using the equation: %RSA= [(ADPPH −
AS)/ADPPH] × 100, where AS is the absorbance of the solution containing the sample, and
15
Figure 6.Microplate showing the DPPH assay.
2.3.2 Reducing power by ferricyanide/Prussian blue assay
Extract with different concentrations (0.5 mL) were mixed with sodium phosphate buffer (200 mmol/L, pH 6.6, 0.5 mL) and potassium ferricyanide (1% w/v, 0.5 mL). The mixture was
incubated at 50 ºC for 20 min, and trichloroacetic acid (10% w/v, 0.5 mL) was added. The
mixture (0.8 mL) was poured in the 48 wells plate. Deionized water (0.8 mL) and ferric chloride (0.1% w/v, 0.16 mL) were added and the absorbance was read at 690 nm in ELX800
Microplate Reader (Figure 7) (Bio-Tek Instruments, Inc; Winooski, VT, USA) (Fernandes et
al., 2014).
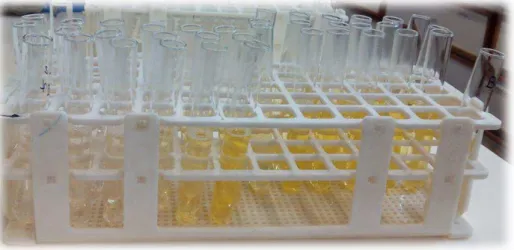
16 2.3.3 Inhibition of β-carotene bleaching
A β-carotene solution was prepared by dissolving β-carotene (2 mg) in chloroform (10 mL). Afterwards, 2 mL of this solution were pipetted into a round-bottom flask and the chloroform was removed at 40 ºC under vacuum and a linoleic acid (40 mg), Tween 80 emulsifier (400 mg), and distilled water (100 mL) were added to the flask with vigorous shaking. Aliquots (4.8 mL) of this emulsion were transferred into test tubes containing (0.2 mL) extract solutions with different concentrations. A control was prepared in which extraction solvent was added instead of the mushroom extract. The tubes were shaken and incubated at 50 ºC in a water bath. As soon as the emulsion was added to each tube, the zero time absorbance was measured at 470 nm (Figure 8). The absorbance of the reaction mixture was finally read after 2 h and the β-carotene bleaching inhibition was calculated using the following equation: (absorbance after 2 h of assay/initial absorbance) × 100 (Fernandes et al., 2014).
Figure 8. Test tubes showing the β-carotene bleaching assay before absorbance measurement .
2.3.4 Thiobarbituric acid reactive substances (TBARS) assay
Porcine brains were obtained from official slaughtered animals, dissected, and homogenized with Polytron in an ice cold Tris-HCl buffer (20 mM, pH 7.4) to produce a 1:2 w/v brain
tissue homogenate which was centrifuged at 3000 × g for 10 min. An aliquot (100 µL) of the supernatant was incubated with the different concentrations of the sample solutions (200 µL) in the presence of FeSO4 (10 mM; 100 µL) and ascorbic acid (0.1 mM; 100 µL) at 37 ºC for 1
h. The reaction was stopped by the addition of trichloroacetic acid (28% w/v, 500 µL),
followed by thiobarbituric acid (TBA, 2%, w/v, 380 µL), and the mixture was then heated at
17
protein, the colour intensity of the malondialdehyde (MDA)-TBA complex in the supernatant was measured by its absorbance at 532 nm (Figure 9). The inhibition ratio (%) was calculated
using the following formula: inhibition ratio (%) = [(A − B)/A] × 100%, where A and B were absorbance of the control and the sample solution, respectively (Fernandes et al., 2014). The results from each assay were expressed as EC50 values, corresponding to the extracts
concentration that provides 50% of antioxidant activity, or 0.5 of absorbance in the case of reducing power assay. Trolox was used as positive control.
Figure 9. Test tubes showing the TBARS assay before absorbance measurement.
2.4 Evaluation of the anti-inflammatory activity 2.4.1 Cells treatment
The anti-inflammatory activity was carried out according to the procedure reported by (Taofiq et al., 2015). The mouse macrophage-like cell line RAW264.7 was cultured in DMEM medium supplemented with 10% heat-inactivated fetal bovine serum, glutamine and antibiotics at 37 °C under 5% CO2, in humidified air. For each experiment, cells were
detached with a cell scraper. A cell density of 5 × 10⁵ cells/mL was used, and the proportion
of dead cells was less than 5%, according to Trypan blue dye exclusion test. Cells were seeded in 96-well plates at 150,000 cells/well and allowed do attach to the plate overnight. Then, cells were treated with the different concentrations of each one of the extracts for 1 h.
Dexamethasone (50 μM) was used as a positive control for the experiment. The following step was the stimulation with LPS (1 μg/mL) for 18 h. The effect of all the tested samples in
18
oxide (NO) basal levels. In negative controls, no LPS was added. Both extracts and LPS were dissolved in supplemented DMEM.
Figure 10. Microplate showing the anti-inflammatory activity assay.
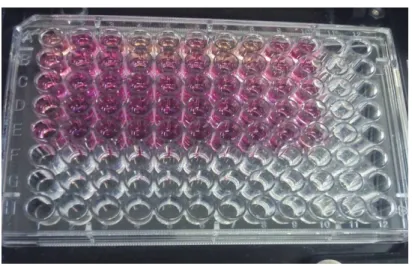
2.4.2 Nitric oxide determination
For the determination of nitric oxide, Griess Reagent System kit was used, which contains sulphanilamide, N-(1-napthyl) ethylenediamine hydrochloride (NED) and nitrite solutions. A reference curve of the nitrite (sodium nitrite 100 μM to 1.6 μM; y = 0.0066x + 0.1349; R2 = 0.9986) was prepared in a 96-well plate. The cell culture supernatant (100 μL) was transferred to the plate and mixed with sulphanilamide and NED solutions, 5–10 min each, at room temperature. The nitric oxide produced was determined by measuring the absorbance at 540 nm (microplate reader ELX800 Biotek), and by comparison with the standard calibration curve (Figure 10).The final results expressed in EC50 values, i.e. the extract concentration that
19 2.5 Evaluation of the cytotoxic activity
2.5.1 In tumor cell lines
The human tumor cell lines used were: HeLa (cervical carcinoma), HepG2 (hepatocellular carcinoma), MCF-7 (breast adenocarcinoma) and NCI-H460 (non-small cell lung cancer). Each of the cell lines were plated in a 96-well plate, at an appropriate density (7.5 × 10³
cells/well for MCF-7 and NCI-H460 and 1.0 × 10⁴ cells/well for HeLa and HepG2) and were
allowed to attach for 24 h. Afterwards, various extract concentrations were added to the cells
and incubated during 48 h. Afterwards, cold trichloroacetic acid (TCA 10%, 100 μL) was
used in order to bind the adherent cells and further incubated for 60 min at 4 ºC. After the incubation period, the plates were washed with deionised water and dried and sulforhodamine
B solution (SRB 0.1% in 1% acetic acid, 100 μL) was then added to each plate well and
incubated for 30 min at room temperature. The plates were washed with acetic acid (1%) in order to remove the unbound SRB and air dried, the bounded SRB was solubilised with Tris
(10 mM, 200 μL) and the absorbance was measured at 540 nm using an ELX800 microplate
reader (Bio-Tek Instruments, Inc; Winooski, VT, USA) (Abreu et al., 2011).The obtained results were expressed in GI50 values, i.e. the extract concentration that inhibited 50% of the
net cell growth. Ellipticine was used as positive control.
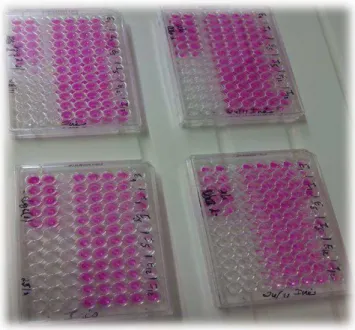
2.5.2 In non-tumor porcine liver cells (PLP2)
Liver tissues were washed in Hank’s balanced salt solution, containing 100 U/mL of penicillin and 100 µg/mL of streptomycin, and then divided into 1×1 mm3 explants. Some of
these explants were placed in 25 cm3 tissue flasks, containing DMEM and supplemented with
10% fetal bovine serum, 2 mM of non-essential amino acids, 100 U/mL of penicillin and 100
mg/mL of streptomycin. Subsequently were incubated at 37 ºC, in a humidified atmosphere
containing 5% CO2. This medium was changed every 2 days, and the cultivation of cells
continued under direct monitoring every 2-3 days, by using a phase contrast microscope. Prior
to confluence, cells were sub-cultured and plated in 96-well plates, with a final density of 1.0×10⁴ cells/well and cultivated in DMEM medium, consisting of 10% FBS, 100 U/mL of
penicillin and 100 µg/mL of streptomycin (Abreu et al., 2011). Finally, cells were treated for 48 h with different diluted sample solutions of each plant extract tested (Figure 11). The
obtained results were expressed in GI50 values, i.e. the extract concentration that inhibited
20
Figure 11.Microplate showing the cytotoxic evaluation assay.
2.6 Chemical characterization of the extracts
HPLC-DAD–ESI/MSn analyses was performed using a Hewlett-Packard 1100 chromatograph (Hewlett-Packard 1100, Agilent Technologies, Santa Clara, CA, US) with a quaternary pump and a diode array detector (DAD) coupled to an HP Chem Station (rev. A.05.04) data-processing station and connected via the cell outlet to a MS detector API 3200 Qtrap (Applied Biosystems, Darmstadt, Germany) through an ESI source and a triple quadrupole-ion trap mass analyzer that was controlled by the Analyst 5.1 software. Separation was achieved on a Waters Spherisorb S3 ODS-2 C18, (3 μm, 4.6 mm × 150 mm) column thermostatted at 35 °C
was used. The mobile phase consisted of (A) 0.1% formic acid in water, (B) acetonitrile at a flow rate of 0.5 mL/min (injection volume 100 µL). Gradient elution was carried out using the following timetable: 15% for 5 min, 15% B to 20% B over 5 min, 20-25% B over 10 min, 25-35% B over 10 min, 35-50% B for 10 min. The resulting total run time was 55 min, followed by column reconditioning of 10 minutes. The chromatogram was recorded at several wavelengths, characteristic of different classes of polyphenols, such as 280 nm for phenolic acids, flavan-3-ols and flavanones, 330 nm for hydroxycinnamic acids and 370 nm for flavonols and flavones.
21
(medium). The quadrupols were set at unit resolution. The ion spray voltage was set at -4500V in the negative mode. The MS detector was programmed for recording in two consecutive modes: Enhanced MS (EMS) and enhanced product ion (EPI) analysis. EMS was employed to show full scan spectra, so as to obtain an overview of all of the ions in sample. Settings used were: declustering potential (DP) -450 V, entrance potential (EP) -6 V, collision energy (CE) -10V. EPI mode was performed in order to obtain the fragmentation pattern of the parent ion(s) in the previous scan using the following parameters: DP -50 V, EP -6 V, CE -25V, and collision energy spread (CES) 0 V. Spectra were recorded in negative ion mode between m/z 100 and 1700 (Souza et al., 2015).
The phenolic compounds were identified by comparing their retention times, UV-vis and mass spectra with those obtained with standard compounds, when available. Otherwise, compounds were tentatively identified comparing the obtained information with available data reported in the literature. For quantitative analysis, a calibration curve for each available phenolic standard: (+)-catechin (y=134.92x+32.987; R2=0.999); caffeic acid (y=359x+488; R2=0.998); chlorogenic acid (y=304x-248; R2=0.999); (-)-epicatechin (y=163.23x+39.586; R2=0.999); kaempferol-3-O-glucoside (y=236x+70; R2=0.999); kaempferol-3-O-rutinoside
(y=183x+97; R2=0.999); naringenin (y=539,98x+161,46; R2=0.994); protocatechuic acid (y=
258.17x+328.45; R2=0.998); quercetin-3-O-glucoside (y=336x+358; R2=0.998) and quercetin-3-O-rutinoside (y=281x+374; R2=0.998), was constructed based on the UV signal.
For the identified phenolic compounds for which a commercial standard was not available, the quantification was performed through the calibration curve of another compound from the same phenolic group and results were expressed as mg per g of extract.
2.7 Statistical analysis
Three samples were used for each preparation and all the assays were carried out in triplicate. The results are expressed as mean values ± standard deviation (SD). The results were analyzed using a Student´s t-test to determine the significant difference among two different
22
3
RESULTS AND DISCUSSION
3.1 Studies with H. androsaemum 3.1.1 Antioxidant activity
Numerous studies have been conducted to identify effective antioxidant compounds, including their active concentration and related modes of action being currently considered one of the highest hot topics among the scientific community (Dato et al., 2013; Espín, García-Conesa, & Tomás-Barberán, 2007). In fact, a relation between premature aging, longevity impairment and oxidative stress status is known to exist, despite the intensive investigation a general consensus was not established (Halliwell, 2012). On this field, phenolic compounds seem to be promissory antioxidant agents (Carocho & Ferreira, 2013a; Fernandez-Panchon et al., 2008). Thus, aiming to put forward alternative sources of phenolic compounds, the present study was carried out to evaluate the antioxidant potential of H. androsaemum hydroethanolic extract as an alternative source of phenolic compound using
four different in vitro assays. The results are given in Table 2.
Table 2. In vitro antioxidant, antitumor and anti-inflammatory properties of H. androsaemum ethanol: water
extract (mean ± SD).
H. androsaemum *Positive control
Antioxidant activity (EC50, µg/mL)
DPPH scavenging activity 96±3 41±1
Reducing power 103±1 41±2
β-carotene bleaching inhibition 155±5 18±1
TBARS inhibition 36±1 23±1
Antitumor activity(GI50 values, µg/mL)
MCF-7 (breast carcinoma) 106±11 0.91±0.04
NCI-H460 (non-small cell lung cancer) 215±13 1.03±0.09
HeLa (cervical carcinoma) 205±18 1.91±0.06
23 Hepatotoxicity (GI50 values, µg/mL)
PLP2 >400 3.2±0.7
Anti-inflammatory activity (EC50 values, µg/mL)
NO production inhibition 179±17 16±1
*Trolox, ellipticine and dexamethasone for antioxidant, antitumor and anti-inflammatory activity assays, respectively. EC50 values correspond to the extract concentration achieving 50% of
antioxidant/anti-inflammatory activity or 0.5 of absorbance in reducing power assay. GI50 values correspond to the extract
concentration achieving 50% of growth inhibition in human tumour cell lines or in liver primary culture PLP2.
The most significant antioxidant effect was observed in the LPI assay, followed by RSA, RP and CBI assays, which means that the studied H. androsaemum extract acts mainly as lipid
peroxidation inhibitor, followed by radical scavenger and inhibitor of linoleic acid oxidation. Rainha et al. (2011) also evaluated the antioxidant potential of aqueous extracts from the aerial parts of different Hypericum species and the result are in agreement with the ones
reported in the present work and the authors concluded that H. androseamum exerted strong
radical scavenger effect and moderate inhibitory effect of linoleic acid oxidation. Also, Valentão et al. (2002) evaluated the antioxidant potential of water extracts prepared from H. androseamum leaves and reported their antioxidant action mainly as strong scavengers of
reactive oxygen species (mainly superoxide radicals). Similar radical scavenging effects of H. androseamum aqueous extracts were described by Hernandez et al. (2010) and Ramos et al.
(2013), being also reported by the last authors a significant ability to repair DNA damages. Lastly, Valentão et al. (2004) aiming to directly correlate the hepatoprotective effects of H. androseamum with its antioxidant potential, concluded that those effects mainly derived from
its strong ability to inhibit lipid peroxidation, which was in part attributed to its phenolic composition.
3.1.2 Cytotoxic activity in tumor and non-tumor cells
The cytotoxicity of H. androseamum was evaluated in non-tumor porcine liver cells (PLP2)
as also in tumor cell lines (breast carcinoma- MCF-7, non-small cell lung carcinoma- NCI-H460, cervival carcinoma- HeLa and hepatocellular carcinoma- HepG2), and the results are given in Table 2. Up to 400 µg/mL, the H. androseamum extract showed no toxicity in
24
Otherwise, a relative low concentration of the extracts was necessary to cause 50% of growth inhibition in human tumor cell lines. H. androseamum was found to be most potent in MCF-7
and HepG2 cell lines with GI50 values of 106.03±10.60 µg/mL and 100.27±6.53 µg/mL,
respectively, while a significant effect was also found against NCI-H460 and HeLa cells. Xavier et al. (2012) reported the in vitro anti-proliferative and pro-apoptotic effects of H. androsaemum aqueous extracts in human colon carcinoma-derived cell lines, and described
an IC50 concentration of 65 µg/mL. It is to note that chlorogenic acid was the most abundant
phenolic compound in the extract studied by those authors (Xavier et al., 2012), which is in agreement with the herein tested ethanol:water extract, where two chlorogenic acids, 5-O
-caffeoylquinic acid and 3-O-caffeoylquinic acid were the majority compounds.
3.1.3 Anti-inflammatory activity
Inflammation is in the origin of numerous degenerative and metabolic disorders, among which the most tremendous is cancer. Notwithstanding, the inflammatory process is a very complex process, and in most of the cases the triggering factor cannot be identified, although free radicals overproduction might be one of the reasons (Aruoma, 2003; Soobrattee, Neergheen, Luximon-Ramma, Aruoma, & Bahorun, 2005). Thus, and considering the observed antioxidant potential of the H. androseamum ethanol:water extract of H. androseamum was evaluated for inhibition of nitric oxide (NO) production. The results are
presented in Table 2 and the H. androseamum extract inhibited NO with an EC50 value of
178.78±16.60 µg/mL while dexamethasone used as positive control inhibited NO production with an EC50 value of 15.70±1.1 µg/mL. As far as we know, this would be the first report on
the anti-inflammatory potential of H. androseamum extracts.
3.1.4 Chemical characterization
The chromatographic profile of the H. androsaemum ethanol:water extract recorded at 280
nm is shown in Figure 12, and peak characteristics, tentative identities and phenolic
compounds quantification are presented in Table 3. Compounds 2 (protocatechuic acid), 4
(5-O-caffeoylquinic acid), 6 (epicatechin), 11 (taxifolin), 12 (quercetin-3-O-glucuronide) and 13
(quercetin-3-O-glucoside) were positively identified by comparison with authentic standards,
as also by their MS fragmentation pattern, retention time and UV-vis characteristics. 5-O
25
H. androsaemum, and in aqueous extracts from the leaves (Valentão et al., 2002; Valentão et
al., 2004).
Compound 1 ([M-H]-at m/z 353) was identified as 3-O-caffeoylquinic acid based on its
fragmentation pattern, yielding a base peak at m/z 191 (deprotonated quinic acid) and an ion
at m/z 179 [caffeic acid-H]- with an intensity of 47% of the base peak, as reported by Clifford
et al. (2003, 2005). Similarly, compound 3 ([M-H]- at m/z 337) was tentatively identified according to its MS2 fragmentation as
3-O-p-coumaroylquinic acid (Clifford et al. 2003,
2005). These compounds have been already reported in aqueous (Valentão et al., 2002; Valentão et al., 2004) and methanolic (Valentão et al., 2003; Porzel et al., 2014) extracts from leaves and in aerial parts (Rainha et al., 2011) of H. androseamum.
Compounds 5, 7, 8 and 10 showed UV spectra with λmax 280 nm, characteristic of
proanthocyanidins. Peaks 5 and 10 presented pseudomolecular ions corresponding to (epi)catechin dimers ([M-H]- at m/z 577) and compounds 7 ([M-H]- at m/z 865) and 8 ([M-H]
-at m/z 1153) to a trimer and a tetramer, respectively. The positive identification in the extract
of epicatechin as the only flavan-3-ol monomer would suggest an epicatechin-based identity for those peaks. Thus, the compounds might correspond to the B-linked epicatechin series, i.e., procyanidin dimer B2 epicatechin, peak 5), trimer C1 (epicatechin-4,8-epicatechin-4,8-epicatechin, peak 7) and the (4,8)-linked epicatechin tetramer (peak 8), whereas the late elution of peak 10 suggests a (4,6) linkage (i.e., epicatechin-4,6-epicatechin; dimer B5). These identities would also be coherent with their expected relative order of elution (Santos-Buelga, García-Viguera, & Tomás-Barberán, 2003). This identification differs from the one recently reported by Ramalhete et al., (2016) who indicated the presence of (+)-catechin and related proanthocyanidins in methanol extracts obtained from the aerial parts of this plant. Compounds 14 ([M-H]- at
m/z 463) and 15 ([M-H]- at m/z 433) presented UV
spectra (λmax354-356 nm) and the production of a unique fragment ion at m/z 301
([quercetin-H]-), which allowed their identification as
quercetin-O-hexoside and quercetin-O-pentoside,
respectively. Finally, compound 9 ([M-H]- at
m/z 449) was tentatively identified as
eriodictyol-O-hexoside, based on its UV spectrum and the product ion observed at m/z 287.
26
whereas, to the author’s best knowledge, the presence of eriodictyol-O-hexoside has not been
previously reported.
Overall, 5-O-caffeoylquinic acid followed by 3-O-caffeoylquinic acid were the majority
phenolic compounds present in the H. androsaemum ethanol:water extract, and they should
27
Figure 12. Phenolic compounds profile of the H. androsaemum ethanol:water extract recorded at 280 nm. The numbering correspond to the peak
number presented in Table 3.
Time (min)
0 10 20 30 40 50
mAU
0 200 400 600 800 1000 1200 1400 1600
1
2 3
4
5 6 7 8
9
1011 1 2
13
1
28
Table 3. Retention time (Rt), wavelengths of maximum absorption in the visible region (max), mass spectral data, identification and quantification (mean ± SD) of phenolic
compounds in the H. androsaemum ethanol:water extract.
Compound Rt
(min)
max
(nm)
Pseudomolecular ion [M-H]- (m/z)
MS2
(m/z) Tentative identification Quantification
(mg/g extract)
1 5.1 328 353 191(100),179(47),161(5),135(38) 3-O-Caffeoylquinic acid 11.6±0.1
2 6.1 260,294sh 153 109(100) Protocatechuic acid 4.29±0.001
3 6.9 312 337 191(25),173(10),163(100),119(65) 3-O-p-Coumaroylquinic acid 0.88±0.01
4 8.0 328 353 191(100),179(3),161(6),135(4) 5-O-Caffeoylquinic acid 40.1±0.1
5 9.0 280 577 451(25),425(50),407(100),289(63),287(8) Procyanidin B2 5.6±0.1
6 11.1 280 289 245(18),203(11),187(4),161(7),137(8) (-)-Epicatechin 6.9±0.2
7 13.1 280 865 739(4),713(3),577(8),575(4),425(19),407(20),289(23),287(8) Procyanidin C1 3.4±0.2
8 14.2 280 1153 865(9),863(12),577(25),575(42),289(5),287(9) Epicatechin tetramer 4.4±0.2
9 17.9 286,336sh 449 287(100) Eriodictyol-O-glucoside 3.7±0.2
10 19.0 280 577 451(67),425(61),407(100),289(82),287(14) Procyanidin B5 4.8±0.5
11 19.4 288,340sh 303 285(100),199(12),177(8),150(15),125(35) Taxifolin 3.4±0.1
12 20.2 350 477 301(100) Quercetin-3-O-glucuronide 4.71±0.01
13 20.6 354 463 301(100) Quercetin-3-O-glucoside 10.69±0.02
14 21.0 354 463 301(100) Quercetin-O-hexoside 4.41±0.05
15 23.7 356 433 301(100) Quercetin-O-pentoside 1.33±0.02
Total phenolic acid derivatives 56.9±0.2
Total flavonoids 53±1
29 3.2 Studies with T. platyphyllos and E. giganteum
3.2.1 Antioxidant activity
The results of the antioxidant activity of hydroethanolic extracts of T. platyphyllos and E. giganteum are shown in Table 4. In general, T. platyphyllos evidenced a higher antioxidant
potential than E. giganteum, both as free radical scavenger and also as lipid peroxidation
inhibitor, being those results clearly confirmed, respectively, by the lowest RSA, RP, CBI and LPI EC50 values. Not least interesting to highlight is that this biological activity seems to be
directly correlated with the relative abundance in phenolic compounds: for the plant extract with higher antioxidant effects, i.e. T. platyphyllos, a high concentration of phenolic
compounds was found Table 6. Thus, it is feasible to infer that the higher antioxidant
potential of T. platyphyllos was mainly attributed to their richness in phenolic compounds,
particularly flavonoids (quercetin and kaempferol derivatives), as shown in Table 6.
Majer et al. (2014) reported the in vitro antioxidant potential (singlet oxygen scavenging) of T. platyphyllos leaf flavonoids and concluded that the sun leaves possess higher myricetin
content than shade leaves, and that quercetin and myricetin derivatives, mainly occurring as rhamnosides, exerted much higher singlet oxygen scavenger effects than kaempferol glycosides. In fact, a higher content in quercetin derivatives was observed in T. platyphyllos,
in detriment of kaempferol derivatives; furthermore, in E. giganteum only vestigial amounts
of quercetin were determined, being kaempferol the most abundant. On the other hand, Yayalaci et al. (2014) evaluating the in vivo antioxidant potential of T. platyphyllos flowers
against ethanol-induced oxidative stress, concluded that linden flowers were able not only to prevent oxidative damage in the studied tissues, but also to inhibit the production of ethanol-induced free radicals in rats. Thus, and considering the obtained results, it is feasible to assume that the antioxidant activity of T. platyphyllos is directly correlated with the relative
abundance in phenolic compounds, mainly quercetin derivatives.
3.2.2 Cytotoxic activity in tumor and non-tumor cells
The cytotoxicity of T. platyphyllos and E. giganteum extracts was evaluated in non-tumor
30
extracts have shown toxicity in non-tumor liver cells (PLP2). Otherwise, a relative low concentration of the extracts was necessary to cause 50% of growth inhibition in human tumor cell lines. Once again, T. platyphyllos revealed more potency than E. giganteum, for all
the tested tumor cell lines and T. platyphyllos was found to be most potent against HepG2
with a GI50 value of 173±13 µg/mL while E. giganteum also displayed the best activity
against HepG2 with a GI50 value of 239±18 µg/mL. Cytotoxic properties of the mentioned
extracts were not previously mentioned in literature and it is interesting to highlight that this is the first report on the cytotoxicity of T. platyphyllos and E. giganteum extracts.
Table 4. In vitro antioxidant, antitumor and anti-inflammatory properties of T. platyphyllos and E. giganteum
ethanol: water extracts (mean ± SD).
E. giganteum
T. platyphyllos
t-Students test p-value
Antioxidant activity (EC50 values, µg/mL)
DPPH scavenging activity (RSA) 123±5 105±1 <0.001
Reducing power (RP) 136±1 123±7 <0.001
β-carotene bleaching inhibition (CBI) 202±3 167±2 <0.001
TBARS inhibition (LPI) 57.4±0.5 55.9±0.4 0.024
Antitumor activity(GI50 values, µg/mL)
MCF-7 (breast carcinoma) 250±15 224±19 0.058
NCI-H460 (non-small cell lung cancer) 258±13 247±22 0.380
HeLa (cervical carcinoma) 268± 16 195±15 0.001
HepG2 (hepatocellular carcinoma) 239±18 173±13 0.002
Hepatotoxicity (GI50values, µg/mL)
PLP2 >400 >400 -
Anti-inflammatory activity (EC50 values, µg/mL)
Nitric oxide (NO) production 239±20 225±22 0.314
The antioxidant activity was expressed as EC50 values, what means that higher values correspond to lower
reducing power or antioxidant potential. EC50: Extract concentration corresponding to 50% of antioxidant
activity or 0.5 of absorbance in reducing power assay. Trolox EC50 values: 41 µg/mL (reducing power), 42
µg/mL (DPPH scavenging activity), 18 µg/mL (β-carotene bleaching inhibition) and 23 µg/mL (TBARS inhibition). Results of the anti-inflammatory activity are expressed in EC50 values: sample concentration
providing 50% of inhibition of nitric oxide (NO) production. Dexamethasone EC50 value: 16±2 µg/mL.
Cytotoxicity results are expressed in GI50 values corresponding to the sample concentration achieving 50% of
growth inhibition in human tumor cell lines or in liver primary culture PLP2. Ellipticine GI50 values: 1.2 µg/mL
31 3.2.3 Anti-inflammatory activity
The anti-inflammatory potential of T. platyphyllos and E. giganteum extracts was evaluated
through measurement of nitric oxide (NO) production, and the obtained results are presented in Table 4. Once again, phenolic composition seems to be most important contributor to the
anti-inflammatory potential of plant extracts. T. platyphyllos inhibited NO production and
presented an EC50 value of 225±22 µg/mL which correspond to the concentration of plant
extract that is necessary to achieve 50% inhibition of NO production and it appears to be more effective than E. giganteum with an EC50 value of 239±20 µg/mL. As previously mentioned,
only Farinon et al. (2013) reported the in vivo anti-inflammatory potential of E. giganteum;
otherwise, to the author’s best knowledge, no studies were previously reported on the anti -inflammatory potential of T. platyphyllos. From the present results anti-inflammatory effect of T. platyphyllos was markedly higher than that of E. giganteum and therefore, it may be
considered a potential source of anti-inflammatory agents.
3.2.4 Chemical characterization
Table 5 and 6 present the characteristics of the identified phenolic compounds, tentative
identities and quantification of E. giganteum and T. platyphyllos. The chromatographic profile
of E. giganteum and T. platyphyllos can be observed in Figure 13. Equisetum giganteum
presented fourteen phenolic compounds (two phenolic acids and twelve flavonol glycoside derivatives), while T. platyphyllos presented to be a more complex matrix in its phenolic
composition, revealing the presence of thirty-three compounds (three phenolic acids, six flavan-3-ol derivatives, twenty flavonol glycoside derivatives, two flavanone and flavone derivatives). Compounds 2Tp (protocatechuic acid), 4Eg (caffeic acid), 3Tp (catechin), 4Tp (5-O
-caffeoylquinic acid), 6Tp (epicatechin), 15Tp (quercetin-3-O-rutinoside; rutin), 17Tp
(quercetin-3-O-glucuronide), 10Eg and 20Tp (quercetin-3-O-glucoside; isoquercitrin), 23Tp and
11Eg
(kaempferol-3-O-rutinoside) and 13Eg (kaempferol-3-O-glucoside) were positively
identified by comparison with authentic standard, as also to their MS fragmentation pattern, retention time and UV-vis characteristics. Kaempferol-3-O-glucoside has been reported in
hydroethanolic extracts of aerial parts of E. giganteum (Francescato et al., 2013; Alavarce et
32
Besides the already mentioned phenolic acid derivatives, 3-O-caffeoylquinic acid (peak 11Tp)
was also tentatively identified based on its MS2 fragmentation pattern, according to the
systematic keys provided by Clifford et al (2003) for the identification of chlorogenic acids. Phenolic acid derivatives represent 19% of the total phenolic composition of T. platyphyllos.
The sample of T. platyphyllos presented four compounds 5Tp ([M-H]- at m/z 577), 7Tp ([M-H]
-at m/z 865), 8Tp ([M-H]- at m/z 1153) and 9Tp ([M-H]- at m/z 1441), with characteristic of proanthocyanidins (UV spectra with λmax 280 nm), being assigned as procyanidin dimer, trimer, tetramer and pentamer, respectively. Comparison with our library database allowed identifying peak 5Tp as procyanidin dimer B2, also reported by Negri et al. (2013) in
hydroethanolic extracts from leaves of Tilia cordata. These compounds have been reported as
major compounds in samples of T. platyphyllos by Karioti et al. (2014), in the present study