A study on
Pharmacogenetic
polymorphisms in
the Portuguese
Gypsies
Joana Maria Santiago Teixeira
Dissertação de Mestrado apresentada à
Faculdade de Ciências da Universidade do Porto e Instituto de
Patologia e Imunologia Molecular da Universidade do Porto em
Genética Forense
2013
A study on P ha rm ac og en eti c po ly morphisms in the P ort ug ue se G y ps ies J oana M a ria S a nt ia go T e ix e ir a FCUP IPATIMUP 2013 2.º CICLOA study on
Pharmacogenetic
polymorphisms in
the Portuguese
Gypsies
Joana Maria Santiago Teixeira
Mestrado de Genética Forense
Departamento de Biologia 2013
Orientador
Doutora Maria Sofia Pacheco Quental, Investigadora Doutorada do
Instituto de Patologia e Imunologia Molecular da Universidade do
Porto (IPATIMUP)
Coorientador
Professora Doutora Maria João Prata Martins Ribeiro, Professora
Associada com Agregação na Faculdade de Ciências da
Universidade do Porto e Investigadora no Instituto de Patologia e
Imunologia Molecular da Universidade do Porto (IPATIMUP)
O Presidente do Júri,
Dissertação de candidatura ao grau de Mestre em Genética Forense submetida à Faculdade de Ciências da Universidade do Porto.
O presente trabalho foi desenvolvido sob a orientação científica da Doutora Maria Sofia Pacheco Quental e foi realizado no Instituto de Patologia e Imunologia Molecular da Universidade do Porto.
Dissertation for applying to a Master’s Degree in Forensic Genetics, submitted to the Faculty of Sciences of the University of Porto.
The present work was developed under the scientific supervision of Doctor Maria Sofia Pacheco Quental and was done at the Institute of Molecular Pathology and Immunology of University of Porto.
Acknowledgments
Throughout the realization of my thesis, several persons gave me the support I needed, making possible its successful conclusion. My sincere gratitude is expressed to all of them.
I would like to especially thank my supervisors, Doctor Sofia Quental and Professor Maria João Prata, for their availability, help and support provided during the course of my work. Besides them, I would also like to thank Professor António Amorim for the opportunity to integrate his research group and all his teachings during these two years; finally, I would like to thank my family and friends for all the love and patience demonstrated during all this time.
Resumo
A Farmacogenética dedica-se ao estudo da influência das variações genéticas humanas na resposta às drogas, e ao longo do tempo tem vindo a adquirir uma importância crescente na prática clínica, com a promessa de tratamentos mais personalizados, que maximizem a eficiência da droga e minimizem a ocorrência de reações de toxicidade. Muitos genes têm sido estudados no campo da farmacogenética, desde genes codificadores de enzimas metabolizadoras, alvos e transportadores das drogas, a fim de compreender o seu papel na variação da resposta às drogas.
Embora muitas populações já tenham sido investigadas em estudos farmacogenéticos, existem ainda populações pouco estudadas neste contexto, como são exemplo os Ciganos da Europa. Devido à sua história e estilo de vida, vivendo em pequenos grupos endogâmicos, os Ciganos têm peculiaridades genéticas únicas, que os tornam em interessantes casos de estudo.
O objetivo principal deste trabalho consistiu em caracterizar uma amostra de Ciganos Portugueses para uma serie de SNPs selecionados, localizados em genes com importância farmacogenética e comparar o perfil farmacogenético obtido nesta população, com o perfil da população hospedeira Portuguesa. Neste sentido, uma amostra de 116 Ciganos Portugueses foi genotipada recorrendo ao sistema de PCR
multiplex, desenhado e otimizado para detetar 10 polimorfismos, localizados em 5
genes, conhecidos por influenciar a resposta as drogas: CYP2C9 e CYP2C19 que codificam enzimas com importância na fase I do metabolismo das drogas; TPMT e
NAT2 que codificam enzimas intervenientes na fase II do metabolismo e VKORC1 que
codifica um alvo das drogas. Além desta população foi também genotipado um grupo controlo de 70 Portugueses não Ciganos para realizar análises comparativas. Os resultados obtidos para estas duas populações foram comparados com dados anteriormente publicados para várias populações do mundo a fim de avaliar o padrão global de distribuição das frequências.
Para as variações selecionadas não foram detetados desvios ao equilíbrio de Hardy-Weinberg tanto na população Portuguesa Cigana como na População Portuguesa não Cigana e, comparando os resultados das duas populações não foram detetadas diferenças significativas. Contudo, como apenas um pequeno grupo de
SNPs foi analisado, mais estudos são necessários para explorar a existência de
indivíduos Ciganos, embora estas sejam irrelevantes (por serem ausentes ou raras) noutros Portugueses.
O presente estudo contribuiu assim para enriquecer a caracterização dos grupos ciganos, abrindo portas para uma melhor compreensão destes grupos populacionais no contexto farmacogenético.
Palavras-Chave: Farmacogenética; População Cigana; Metabolismo das drogas; Alvo das drogas.
Abstract
Pharmacogenetics is dedicated to the study of the influence of human genetic variations in the drug response and along the time has been acquired an increasing importance in the clinical practice with the promise of more personalised drug treatments that maximises the drug efficacy and minimises the drug toxicity. Many genes have been studied in the field of pharmacogenetics, since drug metabolising enzymes to drug targets and drug transporters, in order to understand their role in variation of drug response.
Although many populations have already been investigated in pharmacogenetic studies, there are still populations scarcely studied in this context, such as the Gypsies from Europe. Due to their history and life style, living in small endogamous groups, the Roma have unique genetic peculiarities, making them an interesting case study.
The main goal of the present work was to characterise a sample of Portuguese Gypsies for a selected battery of SNPs in genes with pharmacogenetic relevance, and to compare the derived pharmacogenetic profile with that of the Portuguese host population. Viewing this, a sample of 116 Portuguese Gypsies was typed with a PCR multiplex system, designed and optimised to detect 10 SNPs located in 5 genes known to influence the response to drugs: CYP2C9 and CYP2C19 that encode important enzymes of the phase I of the drug metabolism; TPMT and NAT2 that codify relevant enzymes that intervene in phase II of the drug metabolism and VKORC1 that codify a drug target. In addition, to perform comparative analyses, a control group of 70 Portuguese non-Gypsy individuals was also genotyped. The results obtained for these two populations were compared with previously published data for several populations around the world, in order to assess global patterns of frequencies distribution.
For the screened variations no departures from Hardy-Weinberg equilibrium were detected in the Portuguese Gypsy and Portuguese non-Gyspy populations. Comparing the results of the two populations no major differences were detected. However, as only a small group of SNPs was analysed, further studies are needed to explore whether additional variations apart from those examined might impact substantially drug response in Gypsies, whilst being irrelevant (due to absence or rarity) in other Portuguese.
The present study has contributed to deepen the characterisation of Gypsy communities, opening new doors to achieve a better knowledge of these population groups in the pharmacogenetic context.
Table of Contents
Acknowledgments ... 4 Resumo ... 5 Abstract ... 7 Table of Contents ... 9 Tables Index ... 11 Figures Index ... 12 Abbreviations ... 13 I. INTRODUTION ... 16 1. Pharmacogenetics ... 16 1.1 Pharmacogenetic applications ... 18 1.2 Current challenges ... 192. The drug metabolism ... 21
2.1 Phase I of the drug metabolism ... 22
2.1.1 Cytochrome P450 system ... 22
2.1.1.1 Cytochrome P450 2C9 – CYP2C9... 23
2.1.1.2 Cytochrome P450 2C19 – CYP2C19 ... 25
2.2 Phase II of the drug metabolism ... 28
2.2.1 Thiopurine S-methyltransferase – TPMT ... 28
2.2.2 N-acetyltransferase 2 – NAT2 ... 30
3. Drug targets ... 33
3.1 Vitamin K epoxide reductase complex subunit 1 – VKORC1 ... 33
4. Worldwide population distribution of pharmacogenetically relevant polymorphisms ... 35
5. Portuguese Gypsies ... 36
II. AIMS ... 37
III. MATERIAL AND METHODS ... 38
2. Multiplex PCR Design ... 39
2.1 Selection of Target Polymorphisms ... 39
2.2 Multiplex PCR amplification ... 39
2.3 Electrophoresis ... 41
3. SNP genotyping ... 42
3.1 Multiplex Single Base Extension ... 42
3.2 Minisequencing protocol ... 43
4. Sanger Sequencing ... 44
5. Data analysis... 45
IV. RESULTS AND DISCUSSION ... 46
1. Locus by locus approach ... 46
1.1 Cytochrome P450 2C9 - CYP2C9 ... 47
1.2 Cytochrome P450 2C19 – CYP2C19 ... 55
1.3 Thiopurine S-methyltransferase – TPMT ... 60
1.4 N-acetyltransferase 2 – NAT2 ... 65
1.5 Vitamin k epoxide reductase complex subunit 1 – VKORC1... 68
2. Final considerations ... 73
V. CONCLUSIONS ... 76
VI. FUTURE DIRECTIONS ... 77
VII. BIBLIOGRAPHY ... 78
Tables Index
Pages Table 1. Amplification primers and their characteristics. 40 Table 2. Single Base Extension Primers and their characteristics. 42 Table 3. Allele frequencies of CYP2C9 in the Portuguese non-Gypsy and
Gypsy populations. 47
Table 4. Comparison of allele frequencies of CYP2C9*2 reported from
different ethnic populations. 49
Table 5. Comparison of allele frequencies of CYP2C9*3 reported from
different ethnic populations. 52
Table 6. Allele frequencies of CYP2C19 in the Portuguese non-Gypsy and
Gypsy populations. 56
Table 7. Comparison of allele frequencies of CYP2C19*2 reported from
different ethnic populations. 57
Table 8. Allele frequencies of TPMT in the Portuguese non-Gypsy and
Gypsy populations. 61
Table 9. Comparison of allele frequencies of TPMT*3A reported from
different ethnic populations. 63
Table 10. Comparison of allele frequencies of TPMT*8 reported from
different ethnic populations. 65
Table 11. Frequencies of the slow, intermediate and rapid acetylators in
the Portuguese non-Gypsy and Gypsy populations. 66
Table 12. Combined frequency of slow and rapid NAT2 haplotypes. 66 Table 13. Comparison of slow NAT2 haplotypes reported from different
ethnic populations. 67
Table 14. Allele frequencies of VKORC1 c.-1639G>A in the Portuguese
non-Gypsy and Gypsy populations. 68
Table 15. Comparison of allele frequencies of VKORC1 c.-1639G>A
Figures Index
Pages Figure 1. The functional components of Pharmacogenetics. 17
Figure 2. The metabolic pathways of warfarin. 25
Figure 3. Clopidogrel metabolism. 27
Figure 4. Metabolic pathways of omeprazole by CYP isoenzymes. 27
Figure 5. Azathioprine metabolism. 30
Figure 6. Isoniazid metabolism. 32
Figure 7. Warfarin effects as vitamin K anticoagulant. 34
Figure 8. Polyacrylamide gel. 46
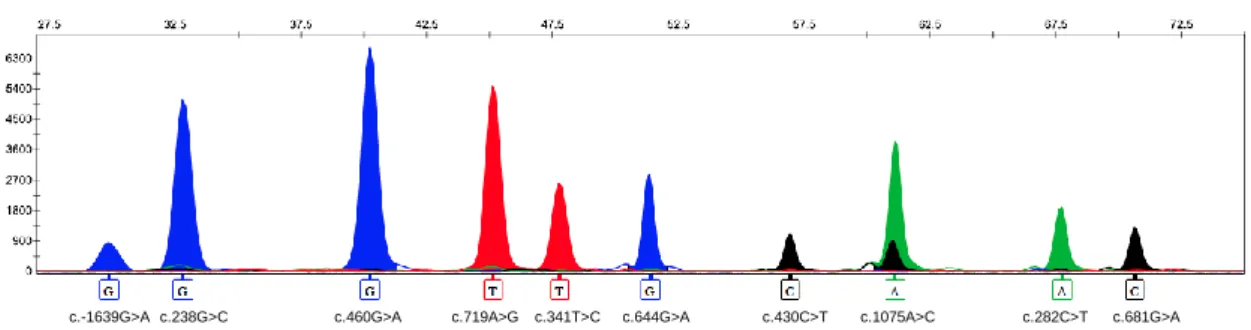
Figure 9. Electropherogram obtained after multiplex minisequencing
analysis. 46
Figure 10. CYP2C9*2 allele frequency distribution of the European, Indian
and Gypsy populations. 55
Figure 11. CYP2C19*2 allele frequency distribution of the European,
Indian and Gypsy populations. 60
Figure 12. VKORC1 c.-1639G>A allele frequency distribution of the
European, Indian and Gypsy populations. 72
Figure 13. Principal Component Analysis (PCA) based on allelic frequency values between 8 populations (Portugal, Spain, Russia, Portuguese Roma, Sweden, Italy, South India, North India) for 5 SNPs.
Abbreviations
μL Microlitre
μM Micromolar
6-MMP 6-methylmercaptopurine
6-MP 6-mercaptopurine
6-MTIMP 6-methylthioinosine monophosphate
6-TIMP 6-thioinosine
6-TG 6-thioguanine
6-TU 6-thiouric acid
A Adenine
ADR Adverse Drug Reaction
AZA Azathioprine
B.C. Before Christ
BLAST Basic Local Alignment Search Tool
BLAT BLAST-Like Alignment Tool
bp base pair
ºC Degree Celsius
CYP Cytochrome P450
CYP1A2 Cytochrome P450 1A2
CYP2B6 Cytochrome P450 2B6 CYP2C8 Cytochrome P450 2C8 CYP2C9 Cytochrome P450 2C9 CYP2C18 Cytochrome P450 2C18 CYP2C19 Cytochrome P450 2C19 CYP2D6 Cytochrome P450 2D6
CYP2E1 Cytochrome P450 2E1
CYP3A4 Cytochrome P450 3A4
ddNTP Dideoxynucleotide Triphosphate
DME Drug Metabolising Enzyme
DM Deficient Methylator
DNA Deoxyribonucleic Acid
dNTP Deoxynucleotide Triphosphate
EM Extensive Metaboliser
ExoSAP Exonuclease I and Shrimp Alkaline Phosphatase
G Guanine
GST Glutathione S-transferase
H+/K+-ATPase Proton Pump
He Expected Heterozygosity HM High Methylator Ho Observed Heterozygosity HPRT Hypoxanthine Phosphoribosyl-Transferase IA Intermediate Acetylator IM Intermediate Metaboliser IM Intermediate Methylator INH Isoniazid min Minute
mRNA messenger Ribonucleic Acid
n Sample size
NAT1 N-acetyltransferase 1
NAT2 N-acetyltransferase 2
OligoCalc Oligonucleotide Properties Calculator
PCR Polymerase Chain Reaction
PM Poor Metaboliser
q Frequencies of the minor allele
RA Rapid Acetylator
Ref. References
rpm revolutions per minute
SA Slow Acetylator
SAP Shrimp Alkaline Phosphatase
SBE Single Base Extension primers
sec Second
SNP Single Nucleotide Polymorphism
TGN Thioguanine Nucleotide
Tm Melting temperature
TPMT Thiopurine S-Methyltransferase
UCSC University of California, Santa Cruz
UM Ultrarapid Metaboliser
VKA Vitamin k antagonist
XME Xenobiotic Metabolising Enzyme
I. INTRODUTION
1. Pharmacogenetics
Pharmacogenetics arose from the challenge of understanding how the genetic variations influence the different drug responses that many individuals present. In 510 B.C., Pythagoras had already described that some individuals, after the ingestion of fava beans, manifested unusual reactions, today known as haemolytic anaemia, while others did not showed them (Kupiec et al., 2006; Pelotti and Bini, 2011). However, it was only in 1950 that was clearly documented the first association between inherited genetic information and variable drug response, leading to the acknowledgement of the Pharmacogenetics as a science (Evans and McLeod, 2003; Kalow, 2006; Lanfear and McLeod, 2007).
Nowadays is well established that interindividual variation in drug disposition and effectiveness is in great part due to genetic factors, while non-genetic factors such as age, gender, co-medication or even the nature of the disease may also contribute to variability in drug response (Evans and McLeod, 2003; Pilgrim et al., 2011).
The genetic influence is mainly due to the presence of variations in DNA sequence, known as genetic polymorphisms when the frequency of the minor allele is ≥ 1% in a population. In the human genome, the single nucleotide polymorphisms (SNPs) are the most common source of genetic polymorphisms accounting for approximately 90% of all genetic variations. The SNPs result from changes in single nucleotides of the DNA sequence that sometimes can lead to the alteration of the encoded protein, as well as to the alteration in the quantity of protein expressed, depending on the nucleotide changed and its location (Lanfear and McLeod, 2007; Kudzi et al., 2011; Pilgrim et al., 2011).
When genetic polymorphisms occur in genes that encode enzymes responsible for the absorption, distribution, metabolism or excretion of drugs, such as drug metabolising enzymes, drug transporters and drug targets, that can lead to the alteration of kinetics and dynamics of drugs in the human organism, thus causing variability in drug responses (Evans and McLeod, 2003; Weinshilboum and Wang, 2006; Pilgrim et al., 2011). It is on these processes that Pharmacogenetics concentrates its efforts, trying to understand how genetic polymorphisms affect either pharmacokinetics or pharmacodynamics of drugs. Indeed, given that pharmacokinetics comprehends the pathways that a drug takes through the organism, from absorption, to
metabolism and excretion, whereas pharmacodynamics respect to how drugs interact with receptors to initiate the drug response, it is understandable that both dynamics can determine drug effects and responses (Johnson, 2003; Weinshilboum and Wang, 2004; Weinshilboum and Wang, 2006) (Figure 1).
Figure 1. The functional components of Pharmacogenetics. The drug metabolising enzymes and drug transporters frequently influence the pharmacokinetics, while the drug targets commonly contribute for the variability in pharmacodynamics. The dashed line indicates that drug transporters are sometimes the drug targets. Adapted from Johnson, (2003).
The information acquired through pharmacogenetic studies can be a useful tool in several areas such as the clinical practice and the forensic analysis, since it allows to improve the relation between patient and drug, avoiding unexpected results in therapeutic treatments and contributing to the interpretation of deaths that remain unclear (Pilgrim et al., 2011). In the following section these two subjects will be explored in more detail.
1.1 Pharmacogenetic applications
As mentioned in the previous section it is frequent to observe that different patients may react differently to the same drug and dose: some develop adverse drug reactions (ADRs), which sometimes can be fatal, others react well or with rather efficacy to the treatment, while others do not even respond to the therapy. This variability of responses of individuals to a standardised treatment is a relevant question in clinical practice (Kudzi et al., 2011). The aim of Pharmacogenetics in the medical context is to identify polymorphisms in genes that can affect the effectiveness of a specific drug, diminishing the number of ADRs and treatment failure, therefore allowing the implementation of a more personalised, safe and effective therapy (Spear et al., 2001; Kalow, 2002; Fishbain et al., 2004; Kudzi et al., 2011). This rational administration of drugs is not only beneficial for patients, but also allows the reduction of healthcare costs (Rai et al., 2009). Furthermore, Pharmacogenetics can also play a key role in the development of new drugs, which can be safer if taking into account the genetic information (Daly, 2010).
The recent developments in Pharmacogenetics knowledge have also given an important contribution to the forensic area given its role in the interpretation of circumstances of deaths. Through Pharmacogenetic studies it is possible to provide information about the metabolic capacity of individuals and potential drug outcomes, that can help the evaluation of post-mortem toxicology results and the determination of the involvement of a drug in the death (Pilgrim et al., 2011). That explains why the recruitment of pharmacogenetic data has allowed the clarification, in collaboration with information from the autopsy, clinical history and investigation of the death scene, of the cause and manner of death (Wong et al., 2003; Kupiec et al., 2006; Musshoff et al., 2010).
In particular situations, in which the circumstances of death are difficult to interpret due to non-existence of evidence of trauma or to ambiguous autopsy results, the pharmacogenetic analysis can be a useful tool for the medico-legal investigations, since genetic information can offer an additional knowledge of a possible genetic mutation that predisposes the individual to risk conditions leading to death. For example, in cases that post-mortem toxicological reports indicate a fatal concentration of a particular drug, it is difficult to understand if the death was accidental or suicide. However, with further information of genetic analysis it can be possible to understand if the high concentration of the drug was due to a genetic defect of the individual, making
the cause of death accidental, or if it was due to a high intake, making the cause of death intentional (Sajantila et al., 2010).
Thus, with the association of pharmacogenetic analysis with post-mortem toxicology it can be possible to have new insights into the cause and circumstances of death of an individual (Musshoff et al., 2010; Sajantila et al., 2010).Current challenges
1.2 Current challenges
Since the post-genomic era, that clinical application of the Pharmacogenetics appears as being a promise of a more personalized medicine, through the application of the genetic knowledge in the improvement of the drugs and dosages, making the drug administration more safe and efficient (Swen et al., 2007).
Although over time, the knowledge of the role that the genes play in the drug responses has improved and with it have emerged several promising clinical pharmacogenetic tests, their application in patient care is still scarce. Many reasons have been appointed as the cause of this limited application, such as educational, financial, guidelines, social, legal and ethical barriers (Weinshilboum and Wang, 2004; Weinshilboum and Wang, 2006; Swen et al., 2007; Crews et al., 2012; Moaddeb and Haga, 2013).
For implementation of a pharmacogenetic test in clinical practice it is required a strong scientific evidence that it will improve the clinical outcomes of the patients, otherwise its introduction in medical healthcare would not be beneficial (Weinshilboum and Wang, 2004; Swen et al., 2007; Swen and Guchelaar, 2012; Moaddeb and Haga, 2013).
The costs are other barrier to the integration of the Pharmacogenetics into routine clinical. The cost-effectiveness studies for these tests are an important determinant for their implementation since should demonstrate their clinical utility and validity and also prove capable of provide the return in investment to the payers (Scott, 2011; Swen and Guchelaar, 2012). Many recent studies that evaluate the clinical utility and validity of Pharmacogenetics tests have shown results that provide incentive for reimbursement of genetic testing and investment in implementation strategies (Crews et al., 2012).
The education of all healthcare professionals, specially the physicians, about pharmacogenetic testing, influences strongly their implementation into clinical practice, since they are responsible for their prescription. Many studies have indicated that clinicians in general have not much confidence in pharmacogenetic services because
of insufficient training and knowledge. Due to the lack of these two skills it is difficult to the doctors to understand the clinical utility of the tests, how to get them and how to interpret and apply their results into the patients care (Weinshilboum and Wang, 2004; Woelderink et al., 2005; Scott, 2011; Crews et al., 2012; Swen and Guchelaar, 2012).
2. The drug metabolism
During the course of our life the human body is exposed to an uncountable number of xenobiotics – foreign elements to the body. Xenobiotics can be food elements, environmental chemicals or even pharmaceuticals, which can cause diverse damages to the body. When these elements enter the organism, a complex of enzymatic mechanisms performs biochemical transformations that convert the components in other, less harmful, trying to minimise the aggression caused by xenobiotic substances (Liska, 1998; Rushmore and Kong, 2002; Gonzalez and Turkey, 2006; Taniguchi and Guengerich, 2012). The mechanism responsible for the biotransformation of xenobiotics is commonly referred to as drug metabolism or drug biotransformation. An essential part of the drug metabolism is the chain of biochemical reactions that transform the foreign elements in components easier to excrete, preventing its accumulation in the body and possible toxic reactions. These reactions are also capable to alter drugs or its precursors in four different forms: an active drug can be inactivated; an active drug can be altered into an active or toxic metabolite; an inactive prodrug can be converted into an active drug and an unexcretable drug can be metabolised into an excretable metabolite (Taniguchi and Guengerich, 2012).
This mechanism of biotransformation of foreign chemicals involves several enzymes, denominated as drug metabolising enzymes or xenobiotic metabolising enzymes (DMEs or XMEs), which are responsible by a number of different steps in the biochemical reactions (Rushmore and Kong, 2002; Xu et al., 2005).
While many tissues and organs are involved in drug metabolism, the liver is the principal organ of drug biotransformation, expressing, therefore, high levels of DMEs. When oral drugs are administrated, the liver metabolism is so efficient that only a small portion of drug passes to the blood circulation – first pass effect (Stachulski and Lennard, 2000; Taniguchi and Guengerich, 2012)
The drug metabolism consists in two main different phases. Phase I, that includes functionalisation reactions (mainly oxidation, hydroxylation, and hydrolysis) by adding or exposing a polar group, and phase II, in which occur conjugation reactions between a polar group, possibly originated in phase I, and endogenous substrates such as glucuronic acid, forming a water-soluble product easier to eliminate (Stachulski and Lennard, 2000).
Although phase I and II reactions can occur independently of one another, normally they occur sequentially. While these are the main phases of the drug
metabolism, references to a phase III can be found in the bibliography, associated with transport of drugs in the organism (Xu et al., 2005; Olinga et al., 2008).
The rate of biotransformation reactions is not the same in all individuals, since it is frequent to observe interindividual differences in the metabolism due to factors such as age, gender, diet, drinking and smoking habits as well as to genetic profile (Pilgrim et
al., 2011; Taniguchi and Guengerich, 2012).
Up to now, about 30 gene families of DMEs were already described (Kudzi et al., 2011; Pilgrim et al., 2011).
2.1 Phase I of the drug metabolism
The phase I of the drug metabolism is the first enzymatic defence that acts against foreign elements, including therapeutic drugs (Liska, 1998). Usually, the phase I enzymes catalyse several reactions such as oxidation, reduction, hydrolysis, cyclization and decyclization. These reactions frequently lead to the inactivation of the drug, but in some cases they can also bioactivate some drugs that are inactive, called prodrugs, or may even produce toxic molecules that can cause damage to the body if not posteriorly metabolised by phase II enzymes (Liska, 1998; Gonzalez and Turkey, 2006).
Several DMEs are involved in these processes, like esterases, reductases, alcohol dehydrogenases and mainly the cytochrome P450 (CYP) superfamily (Tiwari et al., 2009; Pilgrim et al., 2011).
2.1.1 Cytochrome P450 system
The CYP enzymes are a superfamily of heme-thiolate proteins responsible for the metabolism of a great number of endogenous molecules like steroids, fatty acids, prostaglandins, as well as exogenous agents, such as drugs and other xenobiotics (Danielson, 2002; Zanger et al., 2008). These enzymes are located primarily in the endoplasmic reticulum of liver cells, but also in extra-hepatic tissues such as lung, intestines and brain, and are responsible for about 80% of the phase I reactions (Ingelman-Sundberg et al., 2007; Pilgrim et al., 2011).
The human genome comprises several functional CYP genes and some pseudogenes, divided in families and subfamilies according to the degree of similarity of their DNA sequence (Zanger et al., 2008). Each CYP isoenzyme is named according
to specific norms that can be illustrated using the example of CYP2C9: the cytochrome P450 designation is CYP, the family designation is indicated by an Arabic number (CYP2), the subfamily designation is characterised by a capital letter (CYP2C) and the last number represents a particular gene (Poolsup et al., 2000; Ma et al., 2002).
The CYP3A4, CYP2D6, CYP2C9, CYP2C19, CYP2B6 and CYP1A2 enzymes have the most crucial role in the drug metabolism, biotransforming more than 90% of the CYP superfamily substrates. Some associations between drug response and genetic polymorphisms of these enzymes have been described, especially with polymorphisms of CYP2D6, CYP2C9 and CYP2C19 genes (Hiratsuka et al., 2006).
The polymorphic nature of these CYP enzymes leads to the emergence of differences in their metabolic activity, that correlates with four different phenotypes: the extensive metaboliser (EM) phenotype, when the individuals carry two functional alleles; poor metaboliser (PM) phenotype, when the individuals inherit two defective or deleted alleles; intermediate metaboliser (IM) phenotype, when the individuals inherit one functional and one defective allele or they inherit two partially defective alleles; and ultrarapid metaboliser (UM) phenotype, when more than two active genes are producing a particular CYP enzyme. While the EM show a normal enzymatic activity, comparatively the PM and the UM phenotypes show a lower and a higher metabolic capacity, respectively. On the other hand, the IMs phenotypes show a metabolic capacity between PMs and EMs (Hiratsuka et al., 2006; Ingelman-Sundberg et al., 2007).
Depending on the type of phenotype that the individuals present, the drug metabolism can be variable, consequently affecting the drug effectiveness. As an example, when a prodrug is administrated to an individual with a PM phenotype, therapeutic failure can occur since his low metabolic capacity does not allow the expected bioactivation of the prodrug into an active drug (Musshoff et al., 2010; Pilgrim
et al., 2011).
2.1.1.1 Cytochrome P450 2C9 – CYP2C9
The CYP2C9 is an important isoenzyme of the CYP complex that is mainly expressed in the human liver. It is involved in the metabolism of multiple drugs such as warfarin, tolbutamide and phenytoin as well as some endogenous substrates like arachidonic and linolenic acids (Ingelman-Sundberg et al., 2007; Cavallari et al., 2011). The warfarin, an oral anticoagulant widely used for prevention and treatment of
thromboembolism disorders, is one of the more well studied drugs in Pharmacogenetic fields, due to its narrow therapeutic window (Kwon et al., 2011). This drug exerts its pharmacologic effect by inhibiting the vitamin k epoxide reductase complex subunit 1 (VKORC1), an important element in the formation of active clotting factors. Warfarin is a racemic mixture of S-warfarin and R-warfarin where the S-enantiomer is the more active compound and has a greater therapeutic effect (Saminathan et al., 2010; Lam and Cheung, 2012). The enantiomers of warfarin are metabolised by 2 different pathways. S-warfarin is mostly metabolised by CYP2C9 while R-warfarin is mainly metabolised by CYP1A2 and CYP3A4 (D’Andrea et al., 2008; Limdi and Veenstra, 2008; Saminathan et al., 2010) (Figure 2).
Once the more pharmacologically potent S-form of warfarin is mainly biotransformed by CYP2C9, it is expected that variations on CYP2C9 gene can contribute greatly for the large interindividual variability in warfarin response and dosage requirement (Rieder et al., 2005; D’Andrea et al., 2008; Limdi and Veenstra, 2008).
The CYP2C9, located on chromosome 10q24.2, is a polymorphic gene with many different allelic variants identified to date (http://www.cypalleles.ki.se/cyp2c9.htm) (Cavallari et al., 2011; Pilgrim et al., 2011). The CYP2C9*1, often designed as the wild-type allele, encodes for a functional product associated to normal enzymatic activity, whereas CYP2C9*2 (rs1799853, c.430C>T, p.R144C) and CYP2C9*3 (rs1057910, c.1075A>C, p.I359L) have been identified as the most common reduction-function variants that have an important role in the warfarin metabolism (Pilgrim et al., 2011; Voora and Ginsburg, 2012). Although both conduct to the same metabolic phenotype, while CYP2C9*2 may cause a decrease of approximately 30% on enzymatic activity,
CYP2C9*3 may lead to reductions of about 80% (Markatos et al., 2008; Kwon et al.,
2011).
In the warfarin metabolism, the reduced activity of CYP2C9 leads to a decrease on clearance of S-warfarin and in the warfarin dose requirements, translating into about 19% of dose reduction per allele for CYP2C9*2 and approximately 33% of dose reduction per allele for CYP2C9*3 compared to non-carriers. Furthermore, the diminished activity of CYP2C9 increases the risk of bleeding complications (Voora and Ginsburg, 2012).
Figure 2. The metabolic pathways of warfarin. The warfarin is a racemic mixture of and R-warfarin. While the S-warfarin is mostly metabolised by CYP2C9, the R-S-warfarin is mainly metabolised by CYP3A4 and CYP1A2.
2.1.1.2 Cytochrome P450 2C19 – CYP2C19
The CYP2C19 isoenzyme is part of CYP2C subfamily alongside with the CYP2C8, CYP2C9 and CYP2C18 enzymes, being responsible for the metabolism of various therapeutic drugs such as omeprazole, diazepam, clopidogrel and nelfinavir (Cavallari
et al., 2011; Dandara et al., 2011). The clopidogrel, an important antiplateletagent, is a prodrug that requires hepatic bioactivation in order to produce its active metabolite. This bioactivation occurs in two oxidative steps, where several enzymes participate, including CYP2C19, which contributes for 45% of the first step and for 21% of the second (Figure 3) (Santos et al., 2011). Additionally, CYP2C19 enzyme has also a huge importance in the metabolism of proton pump inhibitors, such as omeprazole. This drug binds to the proton pump (H+/K+-ATPase) in gastric cells inhibiting the segregation of gastric acid, being a useful drug in the treatment of gastric acid-related disorders (Shirai et al., 2001; Yasui-Furukori et al., 2004; Uno et al., 2007). Omeprazole is metabolised in 2 different pathways, being extensively metabolised by CYP2C19 via (Palovaara et al., 2003; Furuta et al., 2005; Uno et al., 2007) (Figure 4).
The CYP2C19 gene, located on chromosome 10q24.1-q24.3, is one of the most polymorphic enzymes of the CYP2C members, with many allelic variants described until today (http://www.cypalleles.ki.se/cyp2c19.htm) including CYP2C19*2 (rs4244285, c.681G>A, splicing defect), CYP2C19*3 (rs4986893, c.636G>A, p.W212X) and
Tiwari et al., 2009; Daly, 2010). While CYP2C19*2 and CYP2C19*3 conduct to PM phenotypes, due to their genetic defect causing an inactive enzyme, CYP2C19*17 is related to UM phenotype because it is associated with increased levels of gene expression (Brockmöller and Tzvetkov, 2008; Tiwari et al., 2009; Pilgrim et al., 2011).
In case of treatments with clopidogrel, individuals that carry CYP2C19*2 have low concentration of the active metabolite, which leads to an ineffective inhibition of platelet function and consequently to increased risk of developing cardiovascular events, such as stent thrombosis and myocardial infarction. In contrast, individuals that carry
CYP2C19*17 have a high concentration of the active metabolite due to increased
enzymatic activity, which leads to an intensification of the inhibition of platelet function, what on one hand improves the response to antiplatelet treatment with clopidogrel, but on the other hand increases the risk of bleeding events (Santos et al., 2011; Voora and Ginsburg, 2012).
Besides the differences observed in the bioactivation of clopidogrel, alterations in the metabolism of omeprazole and differences in the effectiveness of treatments have also been described. PM phenotype have increased duration of exposure of the proton pumps in parietal cells to high plasma concentration of omeprazole, leading to its inactivation by a longer period, and a better therapeutic efficiency. On the other hand,
CYP2C19*17 is likely to promote increased metabolism of omeprazole that may cause
a reduction in acid inhibition and consequently a therapeutic failure (Chaudhry et al., 2008; Hunfeld et al., 2008; Gawrońska-Szklarz et al., 2010).
Figure 3. Clopidogrel metabolism. The clopidogrel is a prodrug that requires hepatic bioactivation for its active metabolite exert antiplatelet function. Adapted from Bonello et al. (2010) and Holmes et al. (2010). (Bonello et al., 2010) (Holmes et al., 2010).
Figure 4. Metabolic pathways of omeprazole by CYP isoenzymes. Omeprazole is mostly metabolised by CYP2C19 into 5-hydroxyomeprazole, and then it is transformed into 5-hydroxyomeprazole sulfone by CYP3A4. A small portion of omeprazole is also metabolised by CYP3A4 into omeprazole sulfone, which is transformed into 5-hydromeprazole sulfone by CYP2C19. Adapted from Furuta et al. (2005).
2.2 Phase II of the drug metabolism
In the phase II of drug metabolism, generally following the phase I, occurs the binding of an ionised group to the drug, forming a water-soluble product that facilitates their posteriorly extraction through the urine or bile (Liska, 1998; Guo et al., 2011). In this phase occur many conjugation reactions, specifically acetylation, glucuronidation, sulfation and methylation reactions (Pilgrim et al., 2011). In some situations, the phase II metabolite formed can be more pharmacologically active that their parent drug (Stachulski and Lennard, 2000).
The enzymes with the most important role in this transformation are N-acetyltransferase 1 and 2 (NAT1 and NAT2), glutathione transferase, thiopurine S-methyltransferase (TPMT) and uridine diphosphate glucuronosyltransferase (Kudzi et
al., 2011).
2.2.1
Thiopurine S-methyltransferase – TPMT
The thiopurine S-methyltransferase (TPMT) is a cytosolic enzyme responsible for the S-methylation of thiopurine drugs, such as 6-mercaptopurine (6-MP), 6-thioguanine (6-TG) and azathioprine (AZA) (Kapoor et al., 2009; Pavlovic, 2009). These drugs are mostly used in the treatment of acute leukaemia and chronic inflammatory diseases (Román et al., 2012). When a thiopurine drug is absorbed by the organism, for example AZA, it is transformed in 6-MP in the liver and then is metabolised by 3 different enzymatic pathways mediated by the Hypoxanthine phosphoribosyl-transferase (HPRT), Xanthine oxidase (XO) and TPMT. While the HPRT pathway is the first step to the formation of the active metabolites that exert the cytotoxic effect (6-TGNs), the other two pathways, TPMT and XO, inactivate the drug (Garat et al., 2008; Smith et al., 2009; Zabala-Fernández et al., 2011). The most important inactivation pathway of thiopurines in hematopoietic tissues is the TPMT pathway, since XO is nearly absent in this tissue. Moreover, TPMT activity has been described as inversely correlated to the accumulation of 6-TGNs and hematopoietic toxicity (Krynetski and Evans, 2003) (Figure 5).
The human TPMT gene, located in chromosome 6p22.3, exhibits a series of genetic polymorphisms that are responsible for the interindividual and interethnic variability of TPMT activity. Three main TPMT phenotypes can be distinguished: high methylator (HM), when the individuals inherit two functional alleles; intermediate
methylator (IM), when the individuals inherit one functional and one non-functional
TPMT allele; and deficient methylator (DM), when the individuals inherit two
non-functional TPMT alleles (Spire-Vayron de la Moureyre et al., 1998; Pavlovic, 2009). In populations of European descent, about 90% of the individuals are HMs, expressing a normal enzymatic activity, approximately 10% are IMs, manifesting an intermediate activity and around 0.3% have DM phenotype, exhibiting a low or undetectable activity of TPMT enzyme (Garat et al., 2008; Zabala-Fernández et al., 2011).
When patients with DM phenotype are treated with a standard dose of thiopurine drugs, they are at high risk of developing severe and even fatal hematopoietic toxicity, since the non-inactivation of the drug by TPMT, results in the excessive accumulation of 6-TGNs in erythrocytes (Spire-Vayron de la Moureyre et al., 1998; Pavlovic, 2009). In these patients the dose of drug administrated must be reduced in order to prevent toxic effects. Patients with intermediate levels of TPMT activity would also benefit from a thiopurine dose adjustment, although the risk of toxic side effects is not so severe as for the DM individuals (Kapoor et al., 2009; Pavlovic, 2009).
The TPMT*2 (rs1800462, c.238G>C, p.A80P), TPMT*3A (rs1800460, c.460G>A, p.A154T and rs1142345, c.719A>G, p.Y240C) TPMT*3B (rs1800460, c.460G>A, p.A154T) and TPMT*3C (rs1142345, c.719A>G, p.Y240C) are the most common non-functional alleles, usually accounting for 80 to 95% of IMs and DMs phenotypes in Eurasian populations (Garat et al., 2008; Pavlovic, 2009). Many other TPMT non-functional alleles have been described, among which is TPMT*8 (rs56161402, c.644G>A, p.R215H), an allele mainly found in African populations (Oliveira et al., 2007b; Roberts and Barclay, 2012).
Figure 5. Azathioprine metabolism. This drug is transformed in 6-MP and then is metabolised by the Hypoxanthine phosphoribosyl-transferase (HPRT), Xanthine oxidase (XO) and TPMT pathways. While HPRT pathway is the first step, forming 6-thioinosine monophosphate (6-TIMP) to form the cytotoxic elements 6-TGNs, the remaining two pathways are the initial steps to eliminate thiopurines from the body, forming 6-thiouric acid (6-TU), 6-methylmercaptopurine (6-MMP) and 6-methylthioinosine monophosphate (6-MTIMP). Adapted from Smith et al. (2009) and Zabala-Fernández et al. (2011).
2.2.2
N-acetyltransferase 2 – NAT2
The N-acetyltransferase 2 (NAT2) enzyme intervenes in phase II of drug metabolism and is responsible for the acetylation of various drugs such as isoniazid and sulfamethoxazole as well as several nefarious components like heterocyclic and aromatic amines (Fuselli et al., 2007). The metabolism of isoniazid (INH), an important anti-tuberculosis drug, is one of the most well studied Pharmacogenetic examples. Its metabolism occurs in the liver, where it is biotransformed to acetylisoniazid by NAT2, hydrolysed to acetylhydrazine and posteriorly oxidised by CYP2E1, forming hepatotoxic metabolites. In another metabolic pathway of INH, NAT2 is also responsible for the transformation of hydrazine, the major hepatotoxic metabolite of INH, into acetylhydrazine that subsequently is oxidised by CYP2E1. Furthermore,
NAT2 also participates in the biotransformation of acetylhydrazine into a harmless component, diacetylhydrazine (Teixeira et al., 2011; Lv et al., 2012) (Figure 6).
The NAT2 gene, located in human chromosome 8p22, is polymorphic with over 30 SNPs described in its coding region, including some rare mutations observed in different human populations. Among these, the most common SNPs are c.191G>A (rs1801279, p.R64Q), c.282C>T (rs1041983, p.Y94Y) c.341T>C (rs1801280,p.I114T), c.481C>T (rs1799929, p.L161L), c.590G>A (rs1799930, p.R197Q), c.803A>G (rs1208, p.K268R), c.857G>A (rs1799931, p.G286E), identified in different populations (Fuselli
et al., 2007; Rios-Santos and Magno, 2012; Teixeira et al., 2013).
The combination of NAT2 polymorphisms is commonly used to infer the NAT2 acetylation status, which are designated as haplotypes (Rios-Santos and Magno, 2012). Three different acetylator phenotypes have been described: rapid (RA), intermediate (IA) and slow acetylator (SA) phenotypes, if the individual inherits 2, 1 or 0 full functioning haplotypes, respectively (Hiratsuka et al., 2006; Fuselli et al., 2007).
Although it is assumed that the phenotype prediction of NAT2 activity through genotyping methods is very useful, so far there is still no agreement about the minimum number of NAT2 SNPs necessary to infer with accuracy the human acetylator status. The 7-SNP based genotypic approach is the most conventional method used due to its good sensitivity and specificity (Selinski et al., 2011; Rios-Santos and Magno, 2012). However, in a recent study of Selinski et al. (2011) the NAT2 phenotypes were determined and the sensibility and specificity of the conventional 7-SNP genotype was compared to that of a recently published tagSNP (rs1495741). When the authors further evaluated whether a novel SNP panel could outperform the two others, they found out that both the tagSNP and the 7-SNP inferred genotypes had a high sensibility to predict slow acetylators, although the tagSNP showed an inferior specificity due to misclassifying some rapid and slow acetylators. Interestingly, a combination of only two SNPs (c.282C>T, rs1041983 and c.341T>C, rs1801280) that had the same sensitivity and specificity as the 7-SNP genotype was also identified. These results, which have been corroborated in the study of Hein et al. (2012), may have a practical importance, because of the capability to obtain the same information with less SNPs genotyping, thus saving costs and time (Selinski et al., 2011; Hein and Doll, 2012).
In recent studies, the SA phenotype has been associated with a higher risk of developing drug-induced hepatotoxicity than RA or even IA in tuberculosis treatments with INH (Teixeira et al., 2011; Wang et al., 2012; Teixeira et al., 2013). Additionally, the low acetylation also affects the metabolism of acetylhydrazine into non-toxic metabolite, diacetylhydrazine, increasing the rate of accumulation of INH toxic
metabolites. It has been also shown that in SAs the serum concentration of hydrazine was significantly higher than in RAs, possibly due to increased INH concentration (Teixeira et al., 2013).
Figure 6. Isoniazid metabolism. This drug is biotransformed into acetylisoniazid by NAT2, hydrolysed into acetylhydrazine and posteriorly oxidised by CYP2E1, forming toxic metabolites. These metabolites are conjugated with glutathione S-transferase (GST) and then excreted. In another metabolic pathway of isoniazid, hydrazine is biotransformed by NAT2 into acetylhydrazine that subsequently is oxidised by CYP2E1. Furthermore, NAT2 also participates in the biotransformation of acetylhydrazine into diacetylhydrazine, a harmless component. Adapted from Teixeira et al. (2011), Rios-Santos and Magno (2012) and Teixeira et al. (2013).
3. Drug targets
Despite the absence of a tight definition for what drug targets are, according to Imming et al. (2006) they are molecular structures that pass through a specific interaction with a drug (target-drug interactions) administered to treat a disease (Imming et al., 2006).
Several medicines need to interact with particular targets to exert their pharmacologic effect. When polymorphisms occur in genes that codify these targets, the sensibility to selected drugs may be influenced and consequently it may affect the response of the patient to the treatment. These polymorphisms can have a significant relevance in cases where interindividual variations in drug plasma concentrations are minimal, but major pharmacodynamic differences can be detected (Kupiec et al., 2006; Musshoff et al., 2010; Kudzi et al., 2011).
An example of a drug target polymorphism is the warfarin, which acts by the inhibition of the VKORC1 (Kupiec et al., 2006; Yoshizawa et al., 2009).
3.1 Vitamin K epoxide reductase complex subunit 1 – VKORC1
The complex 1 of vitamin k epoxide reductase (VKORC1), is essential in the vitamin k recycling cycle (Markatos et al., 2008; Kwon et al., 2011). The enzyme is responsible for the transformation of vitamin k in its reduced (active) form which is indispensable for the post-translational gamma-carboxylation of vitamin K-dependent clotting factors (Miao et al., 2007).
VKORC1 is the target of several coumarin-based anticoagulant drugs, being warfarin the most frequently prescribed for prevention of thrombotic diseases (Miao et
al., 2007; Wang et al., 2008). This anticoagulant drug exerts its pharmacologic effect by
inhibiting the enzyme VKORC1, therefore affecting the synthesis of vitamin K- dependent clotting factors (Limdi and Veenstra, 2008; Kwon et al., 2011) (Figure 7).
In the encoding gene, VKORC1, located on chromosome 16p12-21q, several genetic variants that alter the sensibility to warfarin have been reported (Montes et al., 2006; Yoshizawa et al., 2009; Scibona et al., 2012).
The c.-1639G>A (rs9923231) polymorphism, the most common variant in Caucasian populations, has been the most widely studied for warfarin and acenocoumarol drugs (Wu, 2007; Markatos et al., 2008).
This polymorphism is associated with a reduction of mRNA expression, with consequent reduction of the VKORC1 activity and warfarin dose requirements (Kwon
et al., 2011). Thus, patients with c.-1639AA genotype, require a lower dose of warfarin
than those with c.-1639GG genotype (Wu, 2007; Kwon et al., 2011; Smires et al., 2012).
Figure 7. Warfarin effects as vitamin K anticoagulant. This drug interferes with the cyclic inter-conversation of vitamin K, reducing the coagulant activity. Adapted from D’Andrea et al. (2008) and Limdi and Veenstra, (2008).
4. Worldwide population distribution of pharmacogenetically
relevant polymorphisms
If Pharmacogenetics deals with drug metabolism phenotypes which are partly determined by inherited variations in genes encoding for enzymes, transporters and targets involved in the process of drug metabolism, there is no doubt that a main founder pillar of the discipline is human genetic diversity. Along the past decades many studies have revealed that the frequency of alleles influencing drug response exhibit a great variation among different population groups and even within the same population group (Kupiec et al., 2006; Musshoff et al., 2010; Kudzi et al., 2011). For example, the frequency of the CYP2C19 PMs is lower in Western Caucasians than that observed among Orientals (Musshoff et al., 2010). On the other hand, CYP2C9*2 allele is rarely detected in Asian populations, while CYP2C9*3 is reported with a frequency at 1.1-6.8% in this population (Kudzi et al., 2011).
Acknowledging this information, Pharmacogenetics has grown hand in hand with extensive population studies aimed at characterising adequately each different population. European populations have been the centre of many of these investigations, leading to obtain a reasonable picture on patterns of pharmacogenetic diversity in Europe. Still, in this regard there are some populations that were poorly studied until now, such as the Gypsy groups.
5. Portuguese Gypsies
In the second half of 15th century, coming from the trans-Pyrenees route arrived at Iberia the founding populations that today are known as Gypsies in Portugal. The almost absence of historical records about the ancient people migrations from which would arose the Gypsies, does not allow specifying the origin of these populations, however, evidence coming first from linguistics and more recently from genetic studies both point to India as the region from where departed the proto-Roma populations (Gusmão et al., 2008; Mendizabal et al., 2011).
As Gusmão et al. (2008) highlight in their research, while Roma as a whole behave as a transnational genetic isolate, each Roma population presents its specificities, as was observed in Portuguese Gypsies. Roma groups normally have a small population size, with a strong social and cultural identity, where endogamous practices predominate (Gresham et al., 2001). From a genetic viewpoint this leads to the occurrence of high drift effects, what induced the differentiation between the gypsy groups and the host populations, reduced genetic diversity, high linkage disequilibrium and a limited gene flow between Gypsy groups (Gusmão et al., 2008; Valente et al., 2009). Accordingly, no Gypsy group can be genetically representative of others. For these reasons, the Roma have attracted attention from diverse areas of study like, among others, Epidemiology, which would lead to identify a number of Mendelian disorders caused by private founder mutations, and Population Genetics, which is giving important contributions to the reconstruction of the Roma history (Kalaydjieva et
al., 2001; Gusmão et al., 2010; Fehér et al., 2011).
In the field of Pharmacogenetics, very few studies were performed up to date focusing on Roma populations, which justifies having elected in this study the Portuguese Gypsies to be analysed from the pharmacogenetic point of view, attempting to understand how much they differ from the host population in which regard genetic polymorphisms influence drug response.
II. AIMS
Although the Portuguese Gypsies have been demonstrated to be quite differentiated from the Portuguese host population, they remain virtually unstudied in the context of Pharmacogenetics and Forensic Toxicology. Thus, the aim of this study was to characterise the Portuguese Gypsies for single nucleotide polymorphisms (SNP) known to have pharmacogenetic implications, in order to evaluate whether they show any peculiarity in which respect the assessed fraction of diversity that influences drug response.
To achieve this main goal, the following specific aims were established:
1. Selection of SNPs with pharmacogenetic relevance and development of PCR and minisequencing multiplex reactions;
2. Characterisation of a sample of Portuguese Gypsies and another of Portuguese non-Gypsies for the selected SNPs;
3. Comparison of the results obtained in the two population samples; 4. Analysis in a worldwide context of the results obtained in this study.
III. MATERIAL AND METHODS
1. Samples and DNA extraction
For the purpose of the present study, a sample consisting of 116 individuals who self-identified as Portuguese Gypsies was analysed. To perform comparative analyses, a control group of 70 Portuguese non-Gypsy individuals was also studied.
All samples have been extracted for previous works by the Chelex®-100TM (BioRad) method described by Lareu et al. (1994). (Lareu et al., 1994)
2. Multiplex PCR Design
2.1 Selection of Target Polymorphisms
In the beginning of this project, a careful bibliographic analysis was conducted to select genes with pharmacogenetic relevance and potential forensic applications. A total of 5 genes have been selected: CYP2C9 and CYP2C19 that encode important enzymes of the phase I of the drug metabolism; TPMT and NAT2, which codify relevant enzymes for phase II, and VKORC1 that codify a drug target. For the selection of the variations to be studied, the impact caused to protein activity and reported allelic frequencies in Caucasian populations have been taken into consideration.
From the CYP2C9 gene were selected CYP2C9*2 and CYP2C9*3 allelic variants, that represent about 85% of PM phenotypes and from CYP2C19 was chosen
CYP2C19*2, which is relatively common in Caucasian populations and accounts for
75-83% of PM phenotypes (Bozina et al., 2003; Bravo-Villalta et al., 2005). On the other hand, 4 SNPs from the TPMT gene were selected, TPMT*2, TPMT*3B,
TPMT*3C and TPMT*8, being the first 3 responsible for 80-95% of IM and DM
phenotypes and 2 SNPs of the NAT2 gene, c.282C>T and c.341T>C, which were chosen based on their accuracy to predict the NAT2 acetylator phenotypes (Garat et
al., 2008; Selinski et al., 2011). At last, VKORC1 c.-1639G>A was selected due to its
significance in drug-target interaction (Smires et al., 2012).
2.2 Multiplex PCR amplification
The multiplex PCR has been developed to amplify, at the same time, the various fragments containing the target SNPs.
In a previous study, a multiplex PCR for TPMT gene was designed, being in the present work enriched the with new amplification primers for the remaining genes of interest.
The gene sequences were obtained from Ensemble Genome Browser (Ensembl release 68 – July 2012) (http://www.ensembl.org/index.html) and Primer 3 v.0.4.0 Software (http://frodo.wi.mit.edu/) was used to design the amplification primers (Rozen and Skaletsky, 2000), preventing annealing in polymorphic regions. Furthermore, these primers were also designed according to the melting temperature (Tm) of the previous
multiplex PCR, 59ºC, to ensure the action of all primers at the same conditions. Each of the primers obtained by Primer 3 was tested in BLAT (UCSC) (http://genome.ucsc.edu/cgi-bin/hgBlat?command=start), selecting only the human genome, in order to detect possible non-specific annealing, which could reduce the efficiency of the reaction. Then each pair of primers was also tested in UCSC In-Silico PCR (http://genome.ucsc.edu/cgi-bin/hgPcr?command=start) to detect possible non-specific amplifications.
The last step of multiplex development consisted in testing with AutoDimer
Software v1.0 and Oligocalc
(http://www.basic.northwestern.edu/biotools/OligoCalc.html) if the designed amplification primers could form primer-dimer structures and/or hairpins, which could contribute to reduce the reaction efficiency (Vallone and Butler, 2004). Detailed information about amplification primers, amplified products and the selected SNPs is present in Table 1.
Table 1. Amplification primers and their characteristics.
After the in silico evaluation, each primers pair was tested in individual amplification reactions, to confirm if they operate correctly.
Before the multiplex amplification reaction, a mix including all forward and reverse primers was prepared, in which each primer was in a final concentration of 2 μM. The multiplex PCR reactions were performed in a final volume of 10 μL, containing 5 μL of
Gene SNP Allele Forward primer 5’-3’ (bp) Reverse primer 5’-3’ (bp) Product
Size
TPMT rs1800462 c.238G>C TCTTTGAAACCCTATGAACCTGA TGCGTGCTAAATAGGAACCAT 377
TPMT rs1800460 c.460G>A TGTTGAAGTACCAGCATGCAC AGCCTTACACCCAGGTCTCT 365
TPMT rs1142345 c.719A>G
GAATCCCTGATGTCATTCTTCA CCTCAAAAACATGTCAGTGTGA 213
TPMT rs56161402 c.644G>A
CYP2C9 rs1799853 c.430C>T GGAGGATGGAAAACAGAGACTTACA AAGGTCAGTGATATGGAGTAGGG 309
CYP2C9 rs1057910 c.1075A>C TACCCCTGAATTGCTACAACAAA GAATTTAATGTCACAGGTCACTGC 238
CYP2C19 rs4244285 c.681G>A CAACCAGAGCTTGGCATATTG TAAAGTCCCGAGGGTTGTTGAT 223
NAT2 rs1041983 c.282C>T
AGAGGCTATTTTTGATCACATTG GTGTTTCTTCTTTGGCAGGAGAT 403
NAT2 rs1801280 c.341T>C
MyTaqTM HS Mix (Bioline), 1 μL of Primer Mix, 1 μL of DNA and 3 μL of deionized water. The amplification was performed at 95ºC for 15 min, followed by 5 cycles at 94ºC for 30 sec, 63ºC for 90 sec, 72ºC for 1 min, and another 30 cycles at 94ºC for 30 sec, 59ºC for 90 sec, 72ºC for 1 min and a final extension at 72ºC for 10 min.
The amplification reactions were done in 2720 Thermal Cycler (Applied Biosystems) or/and Thermal Cycler (BioRad).
2.3 Electrophoresis
Polyacrylamide gel (T9C5) electrophoresis was performed for all samples in order to test the success of the amplification reactions and also identify possible contaminations. The polyacrylamide gel was stained following the Silver staining procedure (Qu et al., 2005).
3. SNP genotyping
The genotypic data from the 10 SNPs in study was obtained through the SNaPshot or minisequencing technique described below.
3.1 Multiplex Single Base Extension
To perform the minisequencing reactions, 10 single base extension (SBE) primers were designed following the same steps used for amplification primers, but ending immediately adjacent to the target SNPs.
For each SNP, 2 possible extension primers could be designed, forward and reverse, but only one was selected based on the best conditions for the minisequencing reaction according to the Software Primer3. The SBE primers of
CYP2C9 SNPs have a degenerated position (indicated in red at the table) because
they anneal with polymorphic sites that could lead to preferential amplification of one of the alleles.
To produce differences in electrophoretic mobility, a non-annealing tail with different sizes was added to the SBE primers. The SBE primers and their characteristics are present in Table 2.
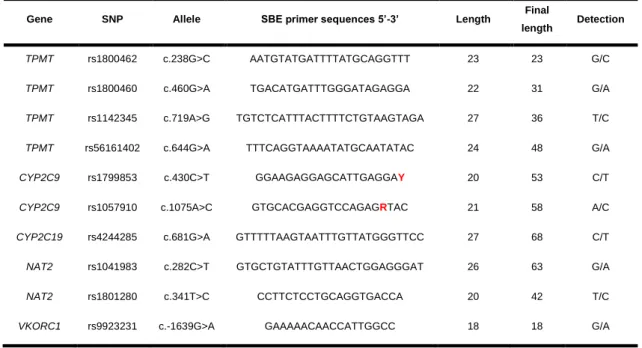
Table 2. Single Base Extension Primers and their characteristics.
Gene SNP Allele SBE primer sequences 5’-3’ Length Final
length Detection
TPMT rs1800462 c.238G>C AATGTATGATTTTATGCAGGTTT 23 23 G/C
TPMT rs1800460 c.460G>A TGACATGATTTGGGATAGAGGA 22 31 G/A
TPMT rs1142345 c.719A>G TGTCTCATTTACTTTTCTGTAAGTAGA 27 36 T/C
TPMT rs56161402 c.644G>A TTTCAGGTAAAATATGCAATATAC 24 48 G/A
CYP2C9 rs1799853 c.430C>T GGAAGAGGAGCATTGAGGAY 20 53 C/T
CYP2C9 rs1057910 c.1075A>C GTGCACGAGGTCCAGAGRTAC 21 58 A/C
CYP2C19 rs4244285 c.681G>A GTTTTTAAGTAATTTGTTATGGGTTCC 27 68 C/T
NAT2 rs1041983 c.282C>T GTGCTGTATTTGTTAACTGGAGGGAT 26 63 G/A
NAT2 rs1801280 c.341T>C CCTTCTCCTGCAGGTGACCA 20 42 T/C
3.2 Minisequencing protocol
Before the minisequencing reactions, an initial purification with ExoSAP-IT® was performed in order to remove the excess of dNTPs and primers present in the PCR product. Each purification reaction contained 1 µL of amplified product and 0.8 µL of ExoSAP-IT® (USB® Products) and the protocol used was 37ºC for 15 min and 85ºC for another 15 min.
A mix including all SBE primers was prepared, containing 0.4 µL of the VKORC1 SBE primer and 0.2 µL of the remaining SBE primers, all with an initial concentration of 20 µM.
The SNaPshotTM reactions were performed in a final volume of 5 µL using 1.8 µL of purified PCR product, 2.2 µL of SBE primers mix and 1 µL of SNaPshotTM Multiplex Kit (Applied Biosystems). The reaction conditions were 25 cycles at 96ºC for 10 sec, 50ºC for 5 sec and 60ºC for 30 sec.
The final products of the SNaPshot reactions were treated with 1 µL of SAP enzyme (USB®) at 37ºC for 60 min and 85ºC for 15 min, to eliminate unincorporated ddNTPs.
These reactions were carried out in a 2720 Thermal Cycler (Applied Biosystems) or/and Thermal Cycler (BioRad).
Finally, 3 µL of the minisequencing-purified products were mixed with 12 µL of Hi-DiTM Formamide (Applied Biosystems) and GeneScanTM-120 LIZTM size standard. Capillary electrophoresis was then performed in an ABI 3130 Genetic Analyser (Applied Biosystems).
4. Sanger Sequencing
The Sanger sequencing technique was performed to validate the results obtained in multiplex PCR and SNaPshot reactions.
An initial purification with ExoSAP-IT® was performed, such as in minisequencing procedure, to eliminate the elements that were not consumed in the amplification reaction. Each purification reaction contained 1.5 µL of amplified product and 0.5 µL of ExoSAP-IT®. The reaction conditions were described in section 3.2.
The sequencing reactions were prepared in a total volume of 5 μL, containing 2 μL of purified PCR product, 1 μL of the amplification primer (forward or reverse) at 2 μM, 1 μL of BigDye sequencing kit and 1 μL of sequencing buffer. The protocol used was 96ºC for 4 min, followed by 35 cycles at 96ºC for 10 sec, 55ºC for 5 sec and 60ºC for 4 min, and a final step at 60ºC for 10 min.
The reactions were executed in 2720 Thermal Cycler (Applied Biosystems) or/and Thermal Cycler (BioRad).
Then, the sequencing products were purified in Sephadex® columns (750 μL) through centrifugation for 4 minutes at 4400 rpm.
The final products were resuspended in 12 μL of Hi-DiTM Formamide and capillary electrophoresis was performed in an ABI 3130 Genetic Analyser (Applied Biosystems).
5. Data analysis
The results of SNaPshot were analysed with GeneMapper® v4.0 and Peak ScannerTM v1.0 Softwares and the sequencing data was analysed with Sequencing Analysis v5.2 and Geneious Pro 5.5.8.
The Arlequin Software v3.5 was used to determine the allelic frequencies, to test departures from Hardy-Weinberg Equilibrium and to perform the Fisher’s exact test (Excoffier and Lischer, 2010). The significant level assumed for these tests was adjusted applying the Bonferroni correction.
The STATISTICA 10 software was also used to execute the Principal Components & Classification Analysis (Version 10, 2010).