UNIVERSIDADE DA BEIRA INTERIOR
Engenharia
Off design efficiency for a gas turbine
Ricardo José Moita Coelho
Dissertação para obtenção do Grau de Mestre em
Engenharia Aeronáutica
(ciclo de estudos integrado)
Orientador: Prof. Doutor Francisco Brojo
iii
Dedication
v
Acknowledgments
I would like to thank every single one that helped me, in this study. My many thanks to my Professor Francisco Brojo, for all the help and patience that he has shown me. And to my friends and colleagues Paulo Figueiredo e David Medroa, for all the back up that they provided to me.
vii
Resume
Started as a base for the calculation sheet, but this report eventually lead to a comparison between two engines of two axle drive and another two with three axle drive. However this was only to prove the results and calculation reliability.
In this comparison and set of results major and principal characteristics from the engines are seen. In addition, a set of upgradable characteristics are considered and even highlighted i the beginning of the report in the Theoretical Considerations. In spite of all the limitations of no-dimensional method, it was possible to have a set of promising results, even considering the basic set of calculation in it mix.
Keywords
ix
Resume (Long)
Using a no dimensional set of calculations, the process wants to create an calculation sheet for the evaluation of Turbofan engines on an Off-design efficiency point of view. This Matlab sheets happen to be able to evaluate, not only that but other engine characteristics, however there is place for upgrades of it and further developments can be expressed in the beginning of the thesis.
For proving the correction and viability an evaluation and comparison of four engine two of 2 axle drive and another 2 of 3 axle drive. Where the problems and limitations of the sheet can be shown, not only in the calculation logic, but also in the results discussion.
This last point is of major importance as the results base is indeed limited, by programming and assumptions, that eventually render this model, pervious to upgrades and eventual revisions( in this last case the no-dimension nature of the calculus)
Keywords
xi
Abstract
This paper presents a study of some characteristics available to an aeronautical gas turbine, on an off design point of view, with ultimate
objective of upgrading either singularly or in conjunction of upgrades, for the best efficiency applicable to the bunch, and with a inferior objective of particles emission reduction from a pre-upgrade version. The model resulting also should be able to be used as a design tool for gas turbine development.
Keywords
xiii
Index
Page Introduction 1 Theoretical Considerations 2 Characterization 4 Fan 4 Compressor 7 Combustor 12 Turbines 21 Ducts 30 Model Implementation 34 Calculations 36 Discussion 46 Results Conclusion 61 Conclusion 62 References 63 Annex 64xv
Figures List
Figure 1: Combustor design guidelines ... 16
Figure 2: Combustion Efficiency vs. Combustor loading ... 17
Figure 3: Primary zone Equivalence Ratio vs. Primary Zone Loading ... 19
Figure 4: Primary zone Equivalence Ratio vs. Primary Zone Loading (engine operations) ... 19
Figure 5: Swindel or Smith chart. It shows contours of constant isentropic efficiency versus loading (1) and axial velocity ratio (2). ... 22
Figure 6: Turbine map representation ... 30
Figure 7: Duct Types ... 33
Figure 8: Efficiency vs Pressure ... 47
Figure 9: Temperature vs. Thrust ... 48
Figure 10: Altitude vs. Pressure ... 50
Figure 11: Altitude vs. Temperature ... 52
Figure 12: Combustion off design vs exit combustion pressure loss ... 54
Figure 13: Efficiency vs. Pressure (three spoon axles) ... 56
Figure 14: Temperature vs.Thrust (three spool axles) ... 57
Figure 15: Altitude vs. Temperature (three spool axle) ... 58
xvii
Acronyms’ List
UBI Universidade da Beira Interior rms Root mean Square
LP MP HP RPV W T P OGV VIGV Rpm T1 FAR CP NGV VAN VSV Cpa Cpg Rend_veio Qnet Low Pressure Medium Presure High Pressure
Remote Piloted Vehicle Weight
Thrust Pressure
Outlet guide vanes Variable inlet guide vanes Rotations per minute First temperature Fuel to air ratio Pressure coefficient Nozzle Guide Vane Variable area Nozzles Variable Stator Vanes
Atmospheric pressure coefficient (1.005 [KJ/KgK]) (exhaust) gaseous pressure coefficient (1.148 [KJ/KgK]) (Portuguese designation) axle efficiency on it’s own Heat capability power [MJ/kg]
1
Introduction
Most of the previous studies focus in the industrial applications (both for electrical and thermal energy application), however the same studies for aeronautical purposes are quite rare at least outside of the industry. This is important since most of the systems and assumptions used in an
industrial plant can be used in the operating environment of an aircraft, being so such studies are required.
The same way, most of this studies use analytical models, of simple design at least as off-design predictions are named. The most of them, means zero-dimensional models (Ismail and Bhinder, 1991; Zhu and Saravanamuttoo, 1992), one-dimensional or more (Stamatis and Mathioudakis, 1992). As referred in the paper by Lazzaretto and Toffolo(2001), “the
zero-dimensional if only the thermodynamic transformations across the component are considered without simulating the internal flow field. One-dimensional models include the variation of thermodynamic and flow quantities along the main flow direction.”
As shown by (Motsamal, Snyman and Meyer) any improvements in engine performance, resulting the increment of thrust or the improvement of the working life of individual components. If such increment on thrust is obtained, temperatures in the system will increase non-uniformly, making material choice one of the least obvious consideration to have but in the conclusions the most important.
Since performance requirement vary according to mission characteristics, for example a passenger aircraft requires minimum running and maintenance costs, for military use maximum availability of thrust and speed for combat response. When reducing running costs by fuel consumption reduction, an increase in range is also available.
As shown by Silva, Khatib and Flemming (2004), the standard approach is always the “control of fuel flow using closed-loop parameters based on a thrust parameter or a selection of physical limiter parameters as operating conditions dictate.(...) In the design of the fuel flow closed-loops, no account is taken of the effects of the open-loop geometry schedules.(...)may be based
Theoretical Considerations
Usually is considered that any development in efficiency is based in the following considerations:
Increasing the engine bypass ratio, which means enlarging the diameter of the propulsor
o (Ducted propulsor with bypass ratios up to about 15 have been demonstrated, but they incur drag and installation penalties. o (bypass ratios above about 10generally require the addition of a
gearbox to the power train, but gearboxes combining required high power capabilities, transmission efficiency, weight and long-life characteristics have yet to be demonstrated in service)
o (unducted propulsors resembling large, swept propellers with bypass ratios of more than 30, have been flight tested and offer gains in propulsive efficiency, of about 0.15(gain of about 25%) compared to modern transport engines.
Use of a undected fan, usually in very high bypass ratio engines thus very large diameter (above 5-10 m) propulsors are simply not feasible for
installation on existing aircraft because they do not fit within the dimensional limits of the wing and landing gear.
o Studies of aircraft with ductless propulsors show that aircraft performance tends to optimize at flight speeds 5-10 % below that of current transports as a result of aerodynamic efficiency
considerations.
o By much as 5%, by integrating the propulsion system with the airframe to pass the vehicle boundary layer through the propulsor (there by concealing the airframe wake)
o By 1%, though more efficient mixing of propulsor and more flows in the duct before the exit plane of the exhaust nozzle.
Increments in the pressure ratio of compression systems
Higher temperature hot sections with reduced (or eliminated) cooling requirements
Improved components efficiencies
Improvement in turbine entry temperatures (to reduce airflow thus core engine size required for a given power output)
3
Despite all of this, the use of already proven improvements may be required. Improvements such as:
o Increased engine inlet temperature o High temperature materials
o Increased compressor pressure ratio o Improved fan and nacelle performance o Reduction of the noise and emissions o Improved reliability
Characterization
Fan
The fan is the first compressor in a turbofan, having downstream from it a flow into the combustor or bypass, and the hot or core streams. If they are multi-staged, for any consideration they are effectively axial flow
compressors and hence their design guidelines are applicable.
Configuration
Fans are always axial flow, as the diameter and downstream ducting required for a centrifugal stage are prohibitive.
The rotor blade is followed by fan tip and fan root stators, usually downstream of the splitter, and their aerodynamic design is often
compromised by the requirements for structural duty, allowing also servicing duties.
Efficiency
The root pressure ratio should initially be assumed equal to the tip for low bypass ratio RPV engines, and around 80% of it for the highest bypass ratio civil engines.
Design practices vary widely between manufacturers , depending upon culture and expense, leading to an appearance for both streams in engines in
operation.
Bypass ratio Practical Considerations
Engine frontal area increase and hence so d weight and pod drag. Cost may also increases.
The number of fan turbine stages increases rapidly. This is because as bypass ratio increases the fan tip speed must be held approximately constant and hence its blade speed reduces. This in addition with the obvious increase of the fan-turbine specific work, as the ratio of fan flow to fan turbine flow
5
increment, and the high loading: this would lead to low efficiency unless the numbers of stages are increased.
Cabin air and aircraft auxiliary power outtakes have a greater-effect on SFC and specific thrust
The perimeter for sealing the thrust reverser when not operational increases, leading to higher leakage.
Inlet mach number
Usually between 0.5 and 0.65
Tip relative Mach number
Fans will invariably be transonic at the tip. Values between 1.4 and 1.8 .
Pressure ratio
The maximum pressure ratio achievable from a single stage fan is around 1.9 . Significantly higher than that attainable from the first stage of a multi-stage core compressor. However in a cruise flight condition the maximum pressure ratio from a single stage will be between 1.7 and 1.8 .
Axial velocity ratio
Normally considered between 0.5 and 0.8 for all stages.
Aspect ratio
Blade aspect ratio at the pitch line based upon axial chord should be between 2.0 and 2.5 for fans without clappers.
Satisfactory blade vibration characteristics then it should be in the range 3.5-2.5. fan stator aspect ratio will be in the same range as for LP compressors unless they have a structural duty or are carrying services, as low as 2.0 .
Rim Speed
For mechanical integrity, rim and tip speeds should be less than 180 m/s and 500m/s, for fans in the hub tip ratio range 0.3-0.4.
Pitch/chord ratio
The DeHaller number should be kept above 0.72 . Depending on technology level, the limiting maximum diffusion factor values may slightly exceed those for axial compressors of 0.6 for the pitch line or 0.4 for tip sections .
Off design performance
As a turbofan is throttled back the swallowing capacity ( √ ⁄ of the first core compressor reduces at a faster rate than that of the cold stream propelling nozzle. This results in bypass ratio increasing as the engine is throttled back
This leads to multiple maps or characteristics (there is a different map for each bypass ratio).
7
Compressors
With the objective of increasing the total pressure of the gas stream to that required by the cycle while absorbing the minimum shaft power possible. The fan is often considered as a single stage compressor on a bypass engine or turbofan and has distinct design features. For multiple stage fans the difference is less and the term LP compressor is more frequently used.
One stage comprises a row of rotor blades followed by a row of stator vanes. A number of stages, with the rotors on a common shaft form a compressor. Often an additional row of outlet guide vanes (OGVs) are required
downstream of the last stator row to carry structural load, or remove any residual swirl prior to the flow entering the downstream duct.
Variable inlet guide vanes (VIGVs) may be employed which consists in a row of stator vanes whose angle may be changed by control system action to improve off-design operation.
Efficiency
Isentropic efficiency is the ideal specific work input, or total temperature rise, for a given pressure ratio divided by the actual pressure. This is usually referred as adiabatic efficiency; however the definition is adiabatic plus reversible.
Mean inlet
Values between 0.4 and 0.6 are common, the highest level being for aero engines in supersonic applications.
Tip number
Conservative and ambitious design levels are 0.9 and 1.3 respectively. The latter requires high diffusion relative to the blade to achieve subsonic
conditions, which increases pressure losses. VIGVs may be employed to reduce these levels.
Stage loading
Efficiency improves as the loading is reduced, more stages are required for a given pressure ratio. Nevertheless, the loading along the pitch line should be between 0.25 and 0.5 for all stages.
Common design practice is to reduce it through the compressor, or occasionally allow it to rise up to the mid stages before reducing again. Stage loading can also be calculated at radial positions other than the pitch line. A key design issue is its value at the hub of the first stage where it is at its highest due to the lower blade speed. Here to maintain acceptable
diffusion rates a value of 0.6 would be conservative and 0.9 ambitious.
Rotational speed
For single spool engines directly driving a generator the speed must be either 3000 or 3600 rpm.
Hub tip ratio
At high values of hub tip ratio, tip clearance becomes a more significant percentage of the blade height. At low hub tip ratios disc and blade stresses become prohibitive and secondary flows become powerful.
To balance these two effects hub tip ratio should be greater than 0.65 for the first stage. For back stages on high pressure ratio compressors values may be as high as 0.92
Axial velocity and axial velocity ratio
Axial velocity ratio or VA/U is the axial velocity divided by the blade speed on the pitch line.
To a first order the axial component of velocity is normally kept constant throughout the compressor. Hence the annulus area decreases from front to rear due to increased density, and axial Mach number reduces due to the
9
increase in temperature. Axial velocity ratio would normally be between 0.5 and 0.75 for all stages.
Aspect ratio
Typical design levels are 1.5-3.5, based upon axial chord, the lower values being more prevalent for HP compressors and small engines where mechanical issues dominate.
Blade gapping
The axial gap between a blade row and its downstream stator row must be large enough to minimize the vibrations due to the upstream bow wave and also to avoid clipping in the event of surge moving the tip of the rotor blade forward. Reciprocally it should be minimised in relation to the engine length and weight considerations. Tipically this gap is usually set to 20% of the upstream chord.
Exit Mach number
Should be not greater than 0.35 and ideally 0.25 .
Exit Swirl angle
Should be zero but certainly less than 10º.
Pitch/chord ratio
The DeHaller number is simply the ratio of row exit to inlet velocity, and should be kept above 0.72 .
The diffusion factor is more elaborate, and is an empirical reflection of the effect of blade spacing (pitch/chord) on the peak blade surface velocity. The limiting maximum value is 0.6 for the pitch line, or 0.4 for rotor tip sections.
Off design performance
Ignoring second-order phenomena such as Reynolds number effects, for a fixed inlet flow angle and no rotating/tertiary stall or inlet distortion the following apply:
For a fixed compressor geometry the map is unique
The operating point on the compressor map is primarily dictated by the components surrounding it as opposed to the compressor itself
Each operating point on the map has a unique velocity triangle( with velocity expressed as Mach number)
Pressure ratio, ⁄ , and efficiency , and any two out of the three parameters may be used as the ordinates for the map. In fact any
combination referred or full dimensionless groups will be suitable if they define flow, pressure ratio and temperature rise.
Reynolds number
When falling below the critical value, the viscous flow effects have a second-order effect. This influences the air, leading to lower flow, pressure ratio and efficiency at a set speed. This low values may also be due to ambient
conditions or due to linearly scaling a compressor to a smaller size.
The compressor geometry, and hence its map, may also be modified due to inlet temperatures’ thermal expansion and changing air properties. This is due to the differential radial growths between the discs/blade, which can cause tip clearance to change. Normally T1 effects are small and usually ignored. Exception only for a HP compressor rig to engine differences, where the faster engine speed due to higher inlet temperature will change stress related
growths.
Surge, rotating stall, and locked stall
For an aerofoil the point of stall is defined as the incidence at which the aerofoil loss coefficient reaches double its minimum value. In a multi-stage compressor stalled operation can be acceptable. For instance at low speeds the front stages may get stalled during normal operation, but steady state operation is possible as the rear stages are unstalled and stabilise the flow against the pressure gradient
Surge can occur throughout the speed range if the surrounding components force the compressor operating point up a speed line such that the pressure ratio is increased to the surge line value.
11
Operation of multi-stage compressors
Each individual stage in a multi-stage compressor has its own unique map. The front stages are pushed towards surge at low speed, due to the flow being restricted by the rear stages which move towards choke. At high speed the situation is reversed with the front stages in choke and the rear stages moving towards surge. These effects occur because the rear stages referred flow increases strongly as speed increases.
Effect of changing rips clearance
Tip clearance is the radial gap between the rotor blades and casing usually in the range of 1-2% rms steady state, and greater transient values.
When changing the compressor’s geometry, the map also changes.
Tip Clearance is particularly powerful on small compressors where it is a more significant percentage of blade height.
Typically a 1% increase in rms tip clearance reduces efficiency by
approximately 1-2%. The surge line is also deteriorated, depends upon the particular compressor design and must be determined by utilizing design codes or more accurately via a rig test. The exchange rate will be in the range of a 1% increase in rms tip clearance reducing the surge line by between 2% and 15% of surge margin.
Combustors
The combustor provides the energy input for the gas turbine cycle. It receives air, inserts fuel, mixes the two components and then it lets the mixture combust, also known as internal combustion, which in the case of gas turbine, at constant pressure.
Do to it, temperature (exit combustor temperature)is the main factor,
since affects the power output and thermal efficiency, however it is limited by the materials properties employed in the combustors construction
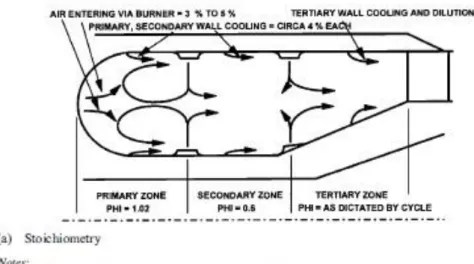
Therefore, these are the considerations to have when designing of a combustor:
A compressor exit diffuser to reduce the Mach number of the air before it reaches the combustor
Primary, secondary and tertiary injector holes through the combustor wall, these are often plunged (rounded) to improve CD and jet positional stability. Mach number through the holes is of the holes is of the order of 0.3 to provide sufficient penetration of the jets into the combustor
A slow moving recirculation ‘primary zone’ to enable the fuel injected to be mixed sufficiently with the air to facilitate combustion and flame
stabilisation.
A secondary zone where further air is injected and combustion is completed
A tertiary zone where the remaining air is injected to quench the mean exit temperature to that required for entry to the turbine, and to control the radial and circumferential temperature traverse
Wall cooling systems
Fuel injectors or burners
Ignition system
The annular combustor is used almost exclusively for aircraft engines due to its low frontal area and weight for a given volume. It is usually forward flow, but when employing a centrifugal compressor reverse flow is often favoured
The reaction
13
Ideally the reaction is:
Where X’s indicates the composition of air. .
The term is the number of moles of air necessary for every mole of fuel. It is given by
Finally, the n0s denote the amount of reaction products. We find that we have
In reality, we don’t have this ideal reaction. In the real world, not all fuel gets combusted. Not all carbon atoms form carbon dioxide CO2. (We will also have carbon monoxide CO.) And
there will be various other reaction products as well. We won’t examine all those reaction products though.
Reactions parameters and drawbacks
The most important characteristic to maintain a combustion will them be the fuel-to-air ratio ( ̇̇
̇̇ ).
Combustion efficiency
Combustion efficiency is the ratio of fuel burnt in the combustor to the total fuel input
Combustor loading may be considered as a measure of the difficulty of the combustor design duty. For efficiency correlations loading is calculated using the total air flow and can volume as this reflects the entire combustion process.
A low value of loading improves combustion efficiency. As design point mass flow and temperature increase then the flame tube volume must be increased to maintain a given value of loading, and eventually efficiency. However the
dominant term is the combustor pressure due to it being raised to the
exponent 1.8; as the inlet pressure increases the required volume for a given loading level decreases rapidly.
Combustor volume should initially be set to achieve a loading value of less than 10Kg/s atm1.8 m3 at the sea level static maximum rating condition. This provides an efficiency of greater than 99.9% for an unconstrained design, and should ensure respectable combustion stability characteristics. On later design developments may have to be modified if the required volume is impractical or, conversely, if off-design efficiency is poor.
Pressure loss
Compressor exit Mach number will be around 0.2-0.35, which is reduced in the combustor entry diffuser to between 0.05 and 0.1 around the can, otherwise wall pressure loss will be unacceptably high.
The combustor cold loss is due to the dump of air being injected through the wall. Good designs would have a value of between 2 and 4% of total pressure at the design point depending upon geometric constraints. With the typical combustor Mach number of 0.025 design point hot loss is around 0.05% and 0.15% for temperature ratios of 2 and 4 respectively
Loading
At the sea level static maximum rating loading should be less than 10Kg/s atm1.8 m3 or in preference 5Kg/s atm1.8 m3.
The highest loading value in the operational envelope will usually occur at idle at the highest altitude, lowest light Mach number and the coldest day. Ideally loading at this condition should be less than 50Kg/s atm1.8 m3, to
ensure acceptable efficiency and weak extinction margin, or at worst be less than 75Kg/s atm1.8 m3 or 100Kg/s atm1.8 m3 for constrained or unconstrained designs respectively.
Furthermore, for aero-engines to achieve combustor relight loading must be less than 300Kg/s atm1.8 m3 when windmilling at the highest required altitude and lowest Mach number.
15
Local Mach numbers and combustion systems areas
The Mach number in the inner and outer annuli prior to the primary zone injector ports should be of the order of 0.1 leading to lower levels further along the annuli.
Low annulus Mach number is essential to maintain a level of Mach number for the injector ports of 0.3, since a ratio of injector port to annulus Mach
number of greater than 2.5 is required for good coefficient of discharge. The injector port Mach number of 0.3 is a compromise between minimising
pressure loss while achieving good penetration. Unless there are angled ports, it is assumed that half of the air entering through the primary ports joins the upstream primary zone, and half the downstream secondary zone.
The flow regime in the primary zone is complex with the most usual being the double torroid . This is an essential to mix the fuel and air properly, and to provide a region of slow velocity in which the flame may be stabilised. The mean axial Mach number leaving the primary zone must be of the order 0.02-0.05
After the secondary zone air flow has been introduced the Mach number within the flame tube may rise to around 0.075-0.1. Finally, the tertiary air is introduced and the flow is accelerated along the turbine entry duct to about 0.2 at the nozzle guide vane leading edge.
Figure 1: Combustor design guidelines
Efficiency
The following chart represents the way of determine efficiency for engine off-design performance, with a chosen curve, it is able to interpolate along it using loading evaluated from the known inlet conditions and the combustor volume.
17
Figure 2: Combustion Efficiency vs. Combustor loading
Fuel air ratio is a third dimension to this chart, but its effect is small and depends on the combustor design, Also the temperature relations can be applicable to this off-design conditions.
Pressure Loss
( √
)
In which is Combustor cold loss (KPa); the cold loss factor;
inlet air flow (kg/s); as the inlet temperature (K); and as inlet pressure (kPa))
(
) (
√
)
In which is Combustor hot loss (KPa); as hot loss factor, as
inlet air flow (kg/s); as the inlet temperature (K), as the exit temperature (K), as the inlet pressure (KPa))
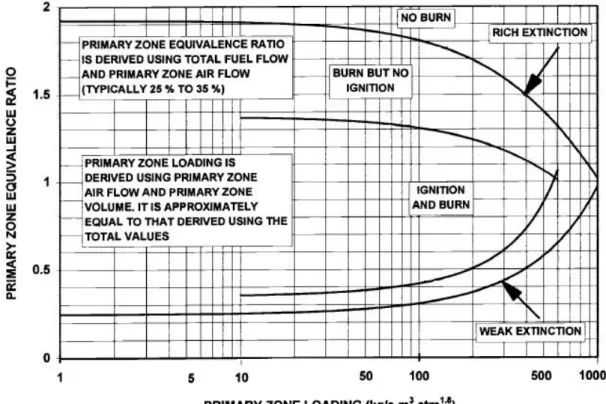
Combustor stability
If fuel is injected correctly into a well designed combustor then stability is primarily a function of velocity, absolute pressure and temperature. If on top of this we add allow velocity, flame stability is increased, at this time high inlet pressure and temperature promote the combustion by the upcoming of a density match between to air and fuel, or by the higher molecular activity For stability considerations, loading is calculated using only the primary zone air flow and volume.
There is a loading value around 1000 beyond which the combustion is not practical, originated primarily by the velocity.
As loading is reduced the flammable equivalence e ratio increases
The fraction of combustor entry air entering the primary zone is constant for off design operation. From that, the primary zone is characterized by a fuel air ratio derived from the total combustor inlet mass flow and fuel flow. However despite rich extinction is rare due to over temperature of other components, weak extinction is quite common since as shown the curve is highly dependent from the individual combustor design
Another instability is called rumble characteristic from weak mixtures it is often is the range from 300 – 700 Hz noise.
Weak extinction
High altitudes provide a km0ore severe off design condition for weak
condition as the typical loading and fuel air ratio variation at a key operation condition can be described in the following chart
19
Figure 3: Primary zone Equivalence Ratio vs. Primary Zone Loading
Starting and restarting
After a dry cranking, fuel must be metered to the combustor and then ignited. Light off occurs with primary zone equivalence ratios in the range 0.35 – 0.75, depending partly on the loading, and immediate combustion efficiency is around 60 – 80%
For aircraft engines the capability to relight within the restart envelope is essential, challenging at high altitude and low inlet pressure and
21
Turbines
Axial flow turbines
To a single stage axial turbine, the stage comprises a row of nozzle guide lines (NGVs) followed by a row of rotor blades mounted on a disc. Shrouded blades have reduced clearance losses and are often interlocked, providing
mechanical damping, however with the inconvenience of creating increases on stress levels. For multi-stage turbine the blading is arranged sequentially in an annulus with the discs connected via conical drive features forming the drum.
High temperature and pressure gas usually enters the first stage NGVs axially at less than 0.2 Mach number and is then accelerated by turning it, which will reduce the flow area. The mean NGV exit Mach number must be between 0.75 to supersonic. There is no work or heat transfer, and only a small loss in total pressure due to friction and turbulent losses. Total temperature remains unchanged, except by addition of any cooling air, while static pressure and temperature reduce due to the acceleration.
Power is extracted across the rotor via the change in whirl velocity; as for a compressor the Euler work is this times the blade velocity. Total temperature and total pressure are reduced.
As for a compressor polytropic efficiency is defined as the isentropic
efficiency of an infinitesimally small step in the expansion process, such that it is constant throughout; it accounts for the fact that the inlet temperature to the back stages of a multi-stage turbine is lower, which leads for less work output is achieved for the same pressure drop. Though not used directly in design point calculations, it enables comparison of turbines with different expansion ratios.
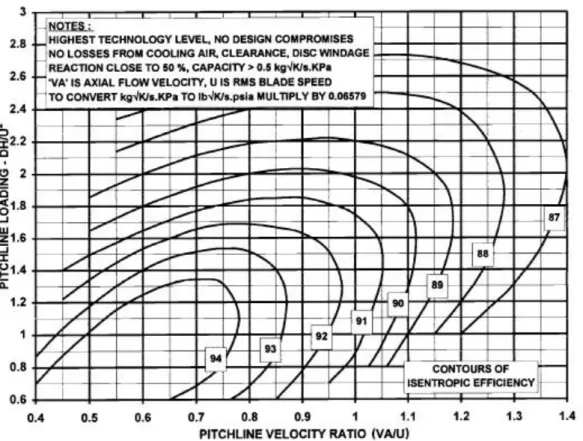
Figure 5: Swindel or Smith chart. It shows contours of constant isentropic efficiency versus loading (1) and axial velocity ratio (2).
As well as being an excellent comparator for different design options the chart may be used to give first-order judgement on the efficiency attainable for a given design, however for this being true, the following should be assured:
The chart provided is for the highest technology level in terms of 3D
orthogonal aerodynamic design, large blading such as for a big engine LP or power turbine (capacity greater than 10 HgK/s*KPa), no cooling air affecting gas path aerodynamics, no windage, 50% reaction zero tip clearance and no other geometric compromises
In a practical design which has all the above merits the highest efficiency level attainable would be 95%
For low capacity (around 0.1 KgK/s*KPA) then levels from the chart should be further debited by approximately three percentage points, with the loss increasing more rapidly at the bottom end of the size range-
Values between the above two levels will be attained for intermediate technology levels, or where some of the other key design parameters
23
described later cannot be set at their optimum level due to geometric or mechanical constraints
Cooling air also lowers the attainable efficiency levels. To a first order, for each percent of rotor blade cooling air the values from the chart should be detailed as below. These values are based on the performance model, assuming that the cooling air does no work in the blade row
o 1.5% per 1% of suction surface film cooling
o 0.5% per 1% of rotor shroud cooling by upstream injection o 0.5% per 1% of trailing edge cooling
o 0.25% per 1% of leading edge or pressure surface cooling
Where applicable the exchange rates are approximately half of the above for NGVs
Non-zero tip clearance is usually inevitable, and lowers efficiency levels
Basic sizing parameters Inlet Mach number
To minimise pressure losses in upstream ducting and to ensure that the gas will accelerate at all points along the NGV surface the mean inlet Mach number to the fast stage should ideally be less than 0.2. It may be higher for subsequent stages.
Blade inlet hub relative Mach number
This should be inferior to 0.7 to ensure that there is acceleration relative to the blade all the way through the blade passage. Should diffusion occur then it may lead to separation and increased pressure loss. NGV exit angle will be between 65º and 75º.
Rotational speed
This must be set to maintain rim speed, tip speed and AN2 within acceptable limits for mechanical integrity, while optimising efficiency via the stage loading and axial velocity ratio. It must also be a suitable compromise with the driven equipment speed requirements.
U: Blade speed
As for the axial flow compressor, stage loading is a non-dimensional
parameter which is a measure of the difficulty of the duty of the stage. For most engines a pitch line value of 1.3 – 2 is typical with the higher values being on the front stages. This will result in expansion ratios per stage of between 2:1 and 3:1 . The highest expansion ratio practical from a single stage with any acceptable level of efficiency is 4.5:1, this pushes the angle guidelines to the limit. The number of stages is a compromise between achieving low loadings and good efficiency, or high loadings and low cost and weight.
Axial velocity ratio
⁄
– Axial velocity (m/s)
This is the ratio of the axial velocity to the blade speed (flow coefficient), at any point in the annulus may be evaluated using Q curves knowing the are, mass flow, total temperature and pressure. It may be assumed to be constant across the annulus. For a given stage loading the corresponding pitch line axial velocity ratio for optimum efficiency is apparent in the previous chart. However if frontal area is paramount then a larger value may be chosen
Hade angle
This is the angle of the inner or outer annulus wall to the axial. These angles are normally kept inferior to 15º to avoid flow separation.
Hub tip ratio
Usually greater than 0.5 to minimise secondary losses, but less than 0.85 due to the increased impact of tip clearance as the blade height is reduced
25
Aspect ratio
As defined for an axial flow compressor based upon chord should ideally be between 2.5 and 3.5, however it may turn out to be as high as 6 for LP turbines.
Axial gap
In a Blade vibration avoidance policy this should be approximately 0.25 times the upstream axial chord
Reaction
⁄
This is the ratio of the static temperature drop across the rotor to that across the total stage. For best efficiency pitch line reaction should be around 0.5, however for cases where the blade temperature is borderline with respect to creep or oxidation then it may go as low as 0.3. This will increase the NGV exit and blade metal temperature, at the same time reduction of the
rearwards axial thrust load which the bearing must react. Hub reaction should ideally always be greater than 0.2 .
An2
This is the product of the annulus area mid-way along the rotor blade, and the blade rotational speed squared.
Since the bade stress is proportional to an2, It is a key mechanical parameter with respect to blade creep life for HP stages and disc stress for LP stages: the allowable AN2 with respect to creep life must be derived from material creep curves where stress is plotted against life for lines of constant metal temperature.
For disc stress, rim speed must be limited to around 400m/s for HP turbines. For the last stage of an LP turbine, designed using to An2 of 50E6 rpm2 m2 the rim speed must be limited to around 350m/s.
Final stage exit Mach number
Should be around 0.3 .The highest allowable is 0.55, above which dramatic breakdown in flow may occur in the downstream diffusing duct such as an exhaust, jet pipe or inlet-turbine duct. A new design should always be in the lower portion of this band as the engine will almost certainly require some further increase which will bring with higher flow and exit Mach number.
27
Off design
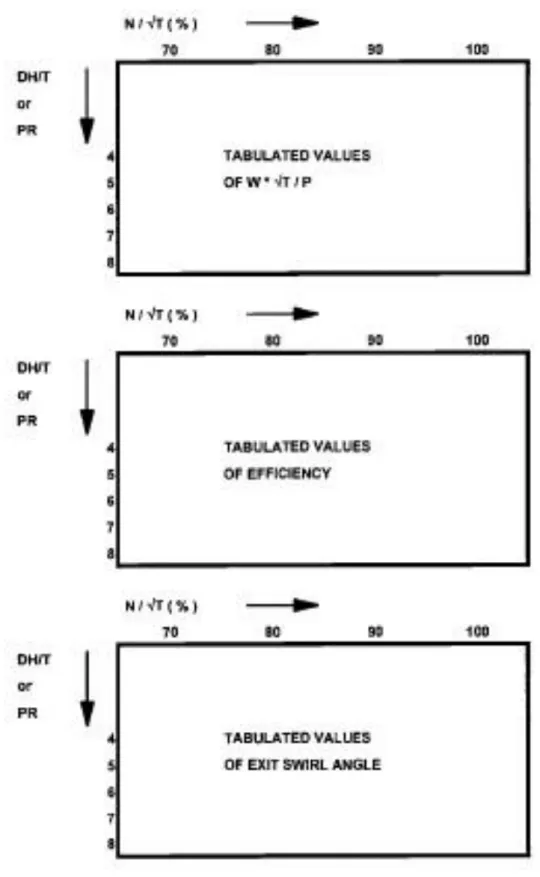
The turbine map
Once the turbine geometry has been fixed at the design point then the
turbine map may be generated to define its performance under all off design conditions. Capacity (referred flow), efficiency and exit swirl angle are plotted for lines of constant referred speed versus the work parameter (dH/Tor CP*dT/t). For each referred speed line there is a maximum flow capacity which cannot be exceeded no matter how much CP*dT/T is increased, in other words Choked.
The chocking capacity is the same for all referred speed lines, usually occurs when chocking occurs in the NGV, should it occur in the rotor blades then these lines separate out with chocking capacity reducing marginally as referred speed is increased due to decreased density in the rotor throat. Limiting output or limit load is the point on the characteristic beyond which no additional power results from an increased expansion ratio.. At this stage, the shock wave moves from the rotor throat to its trailing edge, hence their aerodynamics are not affected by downstream pressure.
Ignoring second-order phenomena such as Reynolds number effects, and for a fixed inlets flow angle the following applies:
For affixed turbine geometry the map is unique
The operating point on the turbine map is dictated by the components surrounding it as opposed to the turbine itself.
Each point on the map has a unique velocity triangle, expressed as Mach number
Expansion ratio, CP*dT/T and efficiency are related in the following formula, hence in fact any two of the three parameters may be used as the ordinates for the map.
( ) : For CP constant at the mean temperature
(
( )
Reynolds number and inlet temperature effects
As In a compressor map, the Reynolds number is strictly a fourth dimension for a turbine map. Capacity and efficiency are both marginally reduced at a referred speed and CP*dT/T. However due to the high pressures and
temperatures in a turbine, Reynolds Number rarely falls below the critical value to then have an effect.
( ⁄ ) ( ) ⁄
(i) K1 and K2 lie between 0.05 and 0.25, and 0.4 and 0.6, respectively. (ii) C5 is the exit annulus height.
(iii) The critical Reynolds number is around 1_105.
AS for a compressor, changes in turbine geometry due to changes in absolute temperature have only a tertiary effect and are usually ignored.
Effect of inlet flow angle – variable area NGVs
The turbine map is only unique for a fixed value of inlet flow angle. Changes will cause a second-order reduction of capacity and efficiency at a referred speed; where in opposition with the compressor that has the presence of a very powerful inlet swirl. This is because for a turbine the first blade row is the NGV which has a rounded leading edge tolerant to incidence variation and the throat is at the trailing edge as opposed to the leading edge. Also the flow is accelerating within the NGV passage and will quickly reattach if there is any separation such that the NGV exit flow angle is unchanged.
29
hence heat recovery, at part power. The operating mechanism to pivot the NGVs is expensive and complex being in a far higher temperature environment than compressor VIGVs or VSVs. They are not practical for HP turbines due to the extreme temperatures and extensive cooling requirements. Each NGV angle represents a unique geometry and hence has its own turbine map. In addition a suite of turbine maps must be loaded into an off-design
performance program, one for each Van angle.
Low speed region
At low speed during starting or windmilling the turbine will not normally show abnormal modes of operation, such as the ‘paddle’ phenomena described for compressors. Generally it always acts as turbine, apart from at zero speed where it behaves as a cascade with pressure drop but no change in total temperature.
Figure 6: Turbine map representation
Near zero work the capacity slope becomes very steep on a conventional map, and the definition of efficiency becomes tenuous. To overcome these
31
starting and windmilling models. The groups √
⁄ and ⁄ are used to read the map, with ⁄ and ⁄ returned from it.
To produce the revised map the existing version is easily translated to this form, as the groups are simple combinations of the existing ones, then it is plotted and extrapolated to low speed and low work, knowing that zero speed must coincide with zero work.
Effect of changing tip clearance
Its ratio to blade height must be set in the range of 1-2% depending upon layout design and size. This is larger than for axial flow compressors since the transient thermal growths are greater for a turbine. A 1% reduction in rms tip clearance will reduce efficiency by around 1%., reflecting the shrouded blades which have tip fences to extract work from any over tip leakage gas.
Shroudless blades have a simple gap and hence the effect will be larger. It may be reduced by using squealers, where a thin portion of the blade is
abraded during engine running in to produce the lowest achievable clearance.
Applying factors and deltas to a map
Often during the engine concept design phase a turbine map may be required for predicting off design performance, but it will not yet have been generated by the turbine design codes. As for compressors common practice is to apply factors and deltas to a map from a similar turbine design to align its design point to that required.
Ducts
A variety of ducts are required which merely pass air between these components, and into or out of the engine. The latter ducts have more arduous duty for aero thrust engines, as intakes must diffuse free stream air from high flight Mach number with minimum total pressure loss, and
propelling nozzles must accelerate hot exhaust gas to produce thrust. The modelling of intake and nozzles is often combined with that of their corresponding exit and entry ducts.
Within them, struts are often required to provide structural support or to allow vital services, such as oiil flow or cooling air to cross a duct.
Subsonic flow in a duct with area change but no work or heat transfer
According to aerodynamic and due to the majority of gas turbine ducts have subsonic flow, where the area change is the leading parameter in a duct with no work or heat transfer.
A reduction in area accelerates the flow, at the same time that the static pressure and temperature.
Usually is assumed that total temperature is unchanged along the duct,
despite the small loss in total pressure due to friction. Conversely, when there is an increase in area, the velocity decreases, and the temperature increase.
Configurations
There are a great number of potent5ial geometries, depending upon the application, and individual design companies.
There is a large plenum upstream of a flare. A snow hood is arranged such that air is taken from ambient vertically upwards, filters and silencers are located in the vertical downtake. If the engine is arranged for cold end drive then a radial intake is employed where a plug surrounds the output shaft.
33
Figure 7: Duct Types
Subsonic aero-engines usually employ a pod mounting with the flight intake diffusing from leading edge to the engine intake leading edge. Furthermore there is the acceleration along the nose bullet as the flow area transitions from circular to annular before the compressor face, if high speeds are
considered, there is on top of all, some diffusion upstream of the flight intake with the flow moving from a narrow stream tube to fill the intake front face. On the other end, when stationary flow accelerates to the flight intake edge from either the front and behind leading edge, so that flow separation in the leading edge can be avoid, it must be rounded.
From the previous pictures, we shall considerer, for subsonic flight, the scroll duct, the bypass duct, and the convergent nozzle, inter compressor ducts.
In the case of the inter-compressor ducts, there is usually a reduction in mean line radius and accelerating flow, however for inter-turbine ducts the
opposite is true.
The scrolled turbine entry duct is often used for feeding, both a radial and an axial turbine. A scroll from a centrifugal compressor exit to a single can of similar geometry but with flow in the reverse direction.
A turbofan bypass duct is usually of constant cross-sectional area, usually is considered proper to be convergent, or con-divergent, depending upon the application.
Duct pressure loss
For design point considerations, total pressure loss is applied as a percentage of inlet total pressure from the following formula
That can be determined by the
Duct Geometry- (loss coefficient (called lambda))determined by
( ) ;
Inlet swirl angle;
Inlet Mach number or dynamic head determined as
Apart from turbine exit ducts, most have constant inlet swirl of zero degrees, and hence is a function of only duct geometry, which when set, and , has
35
been determined, then percentage total pressure loss only varies with inlet dynamic head and increases the Mach number.
The case is that generally, ducts which are diffusing, as opposed to
accelerating, have higher loss coefficients, all due to the flow is more prone to separate, due to the adverse static pressure gradient, incurring
significantly higher turbulent losses which overshadow the wall friction losses from which they suffer. If struts are present then they will for sure increase the loss coefficients shown by between 5 and 10 %, or more if significant incidence or turning occur.
When considering thrust ducts for aircrafts will tend to be towards the higher end of the Mach number range to minimise engine frontal area, also present at the engine intakes differential in that the dynamic head at the duct exit as opposed to entry is used, this can be explained by the ISA SLS, the duct entry Mach number may be very low.
In the case of different geometry, the lambda can be described considering the following conditions: ( duct entrance area; duct exit area)
Sudden expansion: ( )
Dump : ( )
Large step contraction: ( ) (based on exit dynamic head. If a radius is employed at the point of contraction then this may be reduced significantly)
Model implementation
Model
The calculations model is based in a Matlab simulation, of the calculations on a non-dimensional template. This simulation is based on 3 different types of engines, according to the number of axles, and 2 subtypes in each one determined by mixture or not of the flow in the engine.
Considerations
All of the calculations will be set and limited by a group of considerations, which include the isentropic characteristics of the engine components, then we will have:
Control Temperature 1756 Kelvin
Components isentropic efficiency
Admission Bocal 0.93
Compressor (one axle engine) 0.87
Combustion chamber 0.98
Propulsion Bocal 0.95
Axle (one axle engine) 0.9
Fan (3 axle engine) 0.9
Low-pressure compressor (3 axle engine) 0.87 Medium-pressure compressor (3 axle engine) 0.87 High-pressure compressor (3 axle engine) 0.87 Low-pressure turbine (3 axle engine) 0.9 Medium-pressure turbine (3 axle engine) 0.9 High-pressure turbine (3 axle engine) 0.9
37
Losses on off-design calculations
Fan pressure ratio 0.9
Compressors pressure ratio 8
Combustion pressure drop 0.04
Compressor pressure drop 0.03
Compressors pressure ratio (2nd stage, 3 axle engine)
0.9
Compressors pressure ratio (3nd stage, 3 axle engine)
0.9
For the following aircraft engines, two examples with two axle engines and another examples three axle engines, a comparison will be determined.
Two spoon axles
Engine name
GP7270 GEnx-1B64Cruising speed 0.89 0.85 Maximum speed 0.96 0.9
Bypass 8.7 9.6
Real thrust 363 Kn 284 Kn
Three axles
Engines name
TrentXWB Trent 900 Cruising speed 0.85 0.89 Maximum speed 0.89 0.96 Bypass 9.3 8.7 Real thrust 351 Kn 323 Kn
Calculations
The calculations sheet has in it basis the following calculations:
From this, there is five different models of engine, and five different styles of results.
Engine designation
One axle engine
Two axle engine
Three axle engine
Flow mixture
Mixed
No mixture
One axle engine T01
P01 T2 P2 T03 = Tc P03 T4 P4 T4.1 P4.1 Mixture determination Lambda C Thrust Wc f’ TSFC mf ye s no T05 P05 T05 P05 Lambda C A Thrust Wc f’ TSFC mf hl Off-design performan ce √ ⁄ √ ⁄ √ ⁄ OD_VA1=OD_VA2 √ ⁄ √ ( ) OD_CA1=OD_CA2 No Restart True
True Graphs and
step two
39
Step two
( ) ⁄ ( ) ⁄ ( ) ( ⁄ ) ( ) ⁄ ( ) ( ⁄ ) ( ) ⁄ ( ) ⁄ ( ) ( ⁄ ) ( ) ⁄ ( ( ( )) )Two axle engines
T03 P03 T04=TC P04 T05 P05Two axle engine T01
P01 T02 P02 Mixture 1 2 mixed Non- mixed 1 P06= P02 P07= P02 T06 T07 C_pm = (B*Cpa+Cpg)/(B+1) Phi_m = C_pm/(C_pm-R) Wc_7 fl_7 mf_7 Misture determination Lambda_8 C_8 Thrust_8 Wc_8 f’_8 TSFC_8 Mf_8 Lambda_8 C_8 A_8 Thrust_8 Wc_8 f’_8 TSFC_8 Mf_8 Hl_8 T08 P08 Chocked T08 P08 Non-chocked T07 P07 Lambda_7 C_7 Thrust_7 Wc_7 f’_7 TSFC_7 Non-chocked T03 P03 T04=TC P04 2 T05 P05 T06 P06 Misture determination Chocked Chocked T08 P08 Lambda_8 C_8 Thrust_8 Wc_8 f’_8 TSFC_8 Mf_8 Non-chocked T08 P Lambda_8 C_8 Thrust_8 Wc_8 f’_8 TSFC_8
41 Off-design
performance
No Restart True
True Graphs and
step two OD_VA1==OD_VA2 √ ⁄ √ ( ) ( ) √ OD_CA1==OD_CA2 √ ⁄ √ ⁄ √ ⁄
Step two
( ( ( )) ) ( ) ⁄ ( ) ⁄ ( ) ⁄ ( ) ( ⁄ ) ( ) ⁄ ( ) ( ⁄ ) ( ) ⁄ ( ) ( ⁄ ) ( ) ⁄ ( ) ⁄ ( ) ⁄ ( ) ⁄ ( ) ( ⁄ ) ( ) ⁄ ( ) ( ⁄ ) ( ) ⁄ ( ) ( ⁄ ) ( ) ⁄43
3 axle engine
Three axle engine T01
P01 Mixture 1 2 mixed Non- mixed T03 P03 T04 P04 T05=TC P05 1 T07 P07 T06 P06 C_pm = (B*Cpa+Cpg)/(B+1) Phi_m = C_pm/(C_pm-R) P09 T09 Misture determination Lambda_9 C_9 Thrust_9 Wc_9 f’_9 TSFC_9 Mf_9 Chocked T09.1 P09.1 Lambda_9 C_9 A_9 Thrust_9 Wc_9 f’_9 TSFC_9 Mf_9 Hl_9 T09.1 P09.1 Non-chocked T02 P02 T08 P08 T03 P03 T04 P04 2 T05 =TC P05 T06 P06 Misture determination Chocked T07 P07 T08 P08 T09 P09 Lambda_9 C_9 Thrust_9 Wc_9 f’_9 TSFC_9 Mf_9 Non Chocked T09 P09 Lambda_9 C_9 A_9 Thrust_9 Wc_9 f’_9 TSFC_9 Mf_9 Hl_9
Off-design performance
No Restart True
True Graphs and
step two OD_VA1==OD_VA2 √ ⁄ √ ( ) ( ) √ OD_CA1==OD_CA2 √ ⁄ √ ⁄ √ ⁄
45
Step two
Results (annexes)
( ( ( )) ) ( ) ⁄ ( ) ⁄ ( ) ⁄ ( ) ( ⁄ ) ( ) ⁄ ( ) ( ⁄ ) ( ) ⁄ ( ) ( ⁄ ) ( ) ⁄ ( ) ⁄ ( ) ⁄ ( ) ⁄ ( ) ( ⁄ ) ( ) ⁄ ( ) ( ⁄ ) ( ) ⁄ ( ) ( ⁄ ) ( ) ⁄Discussion
The results may not be the best when comparing base values and the results given the values may be quite different. This is due to the input limitations, and calculus limitations, leading to a set of results of basic nature, due specifically to deficient access to variables such as turbine or combustor efficiency, which would have led this calculations to be rearrange in an dimensional set of calculations.
If such a calculus would have been possible, the calculation precision would have been in the range of the industry calculations, with all the complications and costs associated.
In the end, limitations only let me produce and limited set of results greatly limited
Two spoon axle engines
When comparing these two engines, the relations between, the values of The thrust specific fuel consumption, for a ceiling of 39369.6 Feet (12000 meters), will be looked upon, as well as comparison of the evolution of the efficiency in relation to the Pressure, The temperature evolution depending on the thrust experienced.
It will also be compared the variation of Pressure experienced in between stages within the engine per the altitude variation and the same relationship, but the following time with temperature limits and altitude.
Firstly, the comparison of thrust specific fuel consumption in were is clearly lower in the engine GP7270, leads to conclusion that this engine at least by now is 0.167 grams more efficient than the GEnx-1B64, at their cruising velocities and at the same altitude.
thrust specific fuel consumption
GP7270 GEnx-1B64
47
Following to the efficiency in relation the Pressure, the results can be seen as:
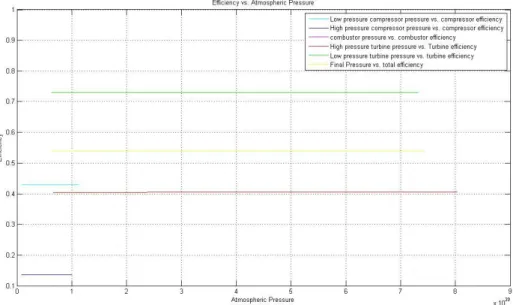
Figure 8: Efficiency vs Pressure
Despite the differences in it input data, the picture of one to another engine are very small.
In similarities, there is the efficiencies displayed which are very close to each other. However as seen, despite the same starting point, the engine GEnx-1B64 sees it’s Pressure lower than in the other engine, for the low pressure and high pressure compressor for the same efficiency.
GP7270
It also states that the action of all turbine pressure and final pressure,
standing in action until near 5*1020 [Pa], instead of what happens in the other engine that stops between 7 *1020 [Pa] to 8*1020 [Pa].
From this, a conclusion cannot be carried out. However, that fact of having a greater variety of pressure values may even impeach in a greater thrust for the engine.
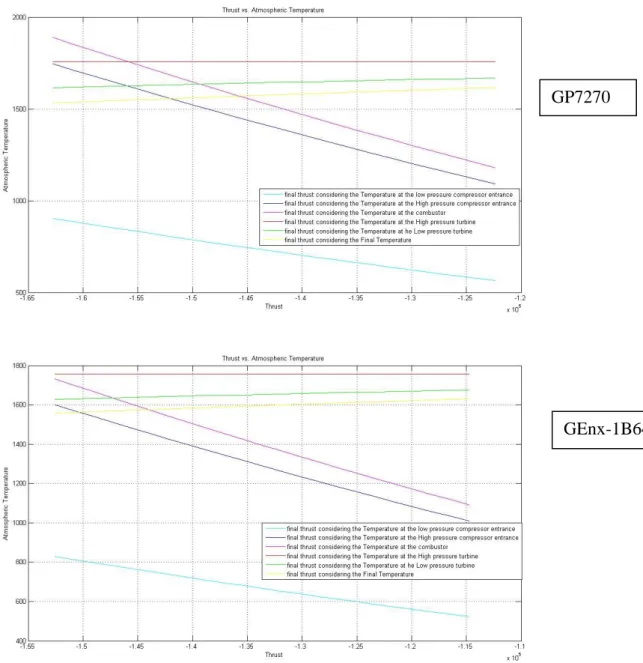
Figure 9: Temperature vs. Thrust
This time, the differences are obvious considering that both engines are set to have the same temperature of combustion.
GP7270
49
For engine GP7270, it is seen that the values experienced in the results calculations, such as in the other engines, are determined by the limitations that are given to the calculations. Then, for these thrust values, there can be seen that the temperature corresponds to the temperature, when entering in the element referred. Thus, there is a different type of graph when up to the combustor and from the same structures since up to the combustor, the results are dependent on the ambient temperature and so have the same curve features,. On the other way, from the combustor, a completely different arrangement of results, due to the tendency to increase temperatures for lower thrust values.
In the figure referred to engine GP7270, the thrust is limited from 1.63*105N to 1.25*105 N, with a top temperature of around 1900K at the combustor
entrance and a minimum of around 600K at the entrance of the air in the low pressure compressor.
In the other figure, with the same values of temperature at the entrance of the low pressure compressor, however the first characteristic to appear is that the maximum temperature is the temperature exiting the combustor at 1765K, then the attention to around 1.15*105 N.ion focus on the thrust levels that are from 1.53*105 N
From all of this, it is possible to consider that engine GP7270 operates and is capable of far greater operational temperatures, which will allow for a greater thrust. Also visible is the influence of a difference in the bypass ratio and speed in the engines thrust.
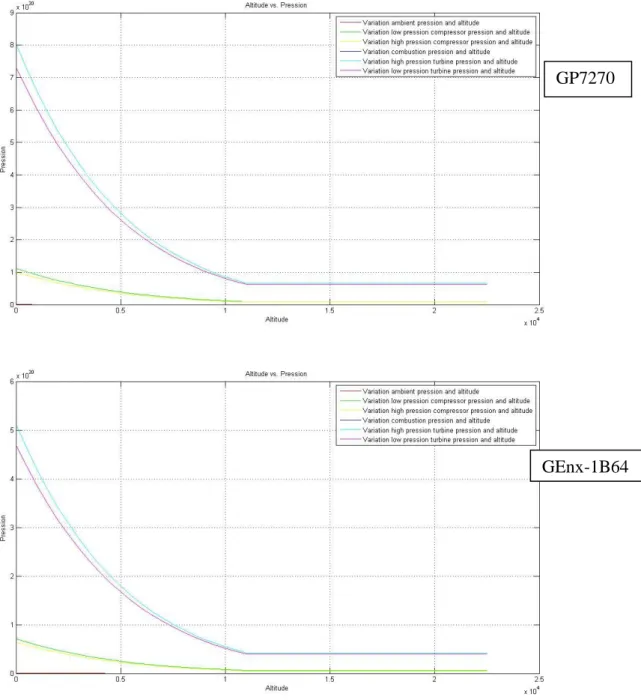
Figure 10: Altitude vs. Pressure
In this set of figures, a similar set of figures are shown, despite changes in pressure values shown.
In the case of the GP7270 engine, the pressure presented in the area post-combustion is in the field of variation from 8*1020 [Pa] to a pressure of less than 1*1020 [Pa]. However a conclusion can be given, when looking at the
point that the pressure stops falling , exactly where standard cruise altitudes are, it also represents the altitude where according to ISA standards, the pressure reduction is stopped. This then gives the assumption that as much as
GP7270
51
wanted, there can not ever be a pressure model for an turbofan engine, that can be independent from ISA standard.
In the other picture, despite having a very similar pressure behaviour, but with lower values, the post-combustion pressures will vary from 5*1020 [Pa] to
less than 05*1020 [Pa], much lower than for engine GP7270. But the difference is not only there, even the other engine, this can be explained by the
different bypass ratio and airspeed, mainly the airspeed which directly influences the pressure values.
One more time, the GP7270 engine appears to be the best and more capable engine.
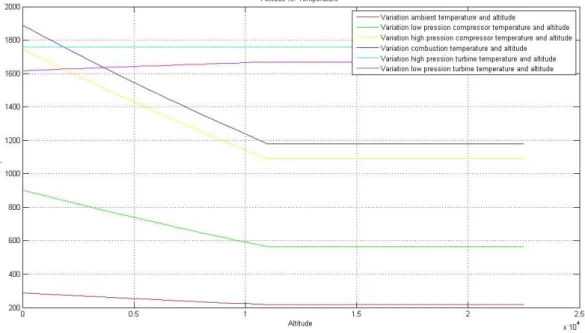
Figure 11: Altitude vs. Temperature
In this final set of pictures, there is a relationship between the temperature variation and the altitude. Also, as seen in the previous set, the ISA standard is determinative for the evolution of the temperature all around the cycle. GP7270
53
Three spoon axle engines
These time, to compare these two engines, the relations between, the values of the thrust and thrust specific fuel consumption, for a ceiling of 39369.6 Feet (12000 meters),will be looked upon; as well as comparison of the evolution of the efficiency in relation to the Pressure, the combustion efficiency vs. Exit combustion pressure loss.
It will also be compared the variation of Pressure experienced in between stages within the engine per the altitude variation and the same relationship, but the following time with temperature limits and altitude.
Firstly, the comparison of thrust where it is quite easy to see that none of the thrust are even comparable to the real values of maximum thrust of 330 KN plus. However this is expected since dimensions and other variables such as compressor and turbine efficiencies, pressure losses, and various Temperature limits, are not available, either by discloser of information or calculation model limitations. Furthermore this values are representative for an altitude 16000 meters, far from the conditions for maximum take-off thrust, were it is considered the maximum thrust.
thrust Trent XWb Trent 900
-0.965*105 -1.016*105 N
Secondly, the Thrust specific fuel consumption in where both engines have a similar value, however it is obvious the higher consumption in the XWB engine.
thrust specific fuel consumption Trent
XWB Trent 900
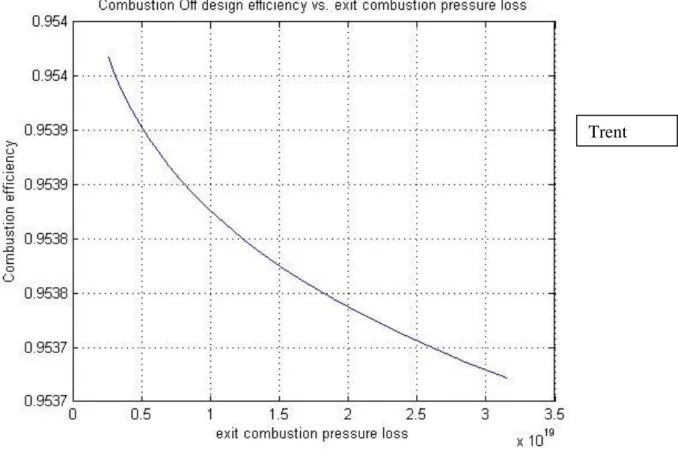
Figure 12: Combustion off design vs exit combustion pressure loss
Used to determining the most capable combustion cycle by project, this pictures show the efficiency, shown by the pressure at the exit of the
Trent XWb
55
combustor, which despite being usually demonstrated by an efficiency 1, by default. It is dependent from the pressure requirements before the
combustion chamber, however in this case, this dependency only exists because in this set of calculations , they are not dimensionally dependent, if it was the case, where this efficiency and pressure are define by the
dimensions and design of the combustor.
In this case, the engine Trent XWb shows a greater efficiency of around 0.9542 and that drops with the increment of pressure to around 0.95372, however it does operate at an inferior set of pressures from 0.25*1019 [Pa] to
around 3*1019 [Pa].
On the other hand, despite presenting an inferior efficiency varying 0.9539 almost 0.954, until a low efficiency of 0.95368; but for a pressure from 0.4*1019 [Pa] to a maximum of 4.4*1019 [Pa].
From this, the Trent XWb engine, allows an cost efficiency advantages, by allowing that the combustor chamber ( the principal part from the engine to have in consideration), have a lower weight for a greater efficiency, since weight is the most limiting factor in the design of an engine, since it is required to have the smallest weight for the biggest thrust possible.
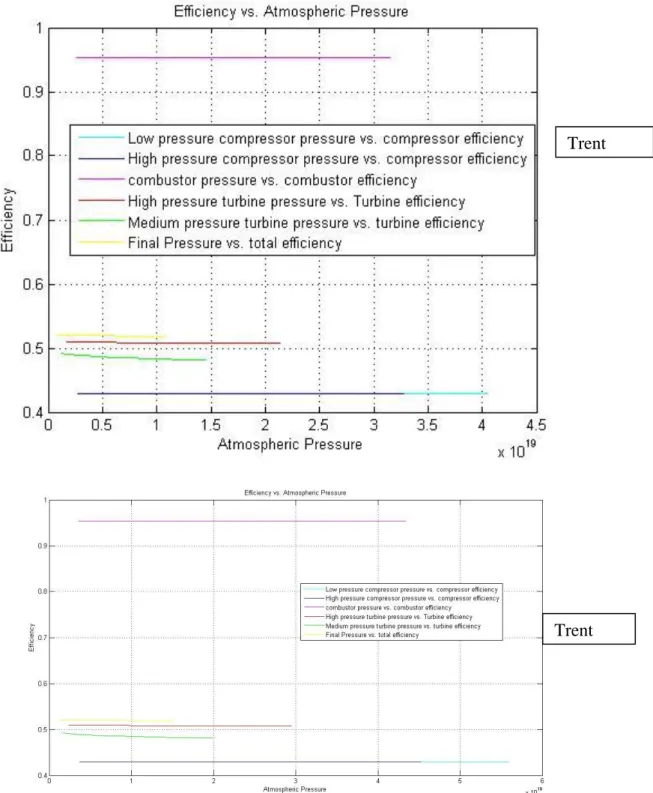
When looking upon to the relation between efficiency and pressure, where it can be perceive an close similarity between the two engines.
Similarities, in the form of almost exactly similar efficiencies, with
differences of 0.001, are only not total similarities because fo the spectrum of pressures felt. For the engine Trent XWb, pressureis defined between 0 [Pa]
Trent XWb
Trent 900
57
to around 4 *1019 [Pa], as in the other engine is between more thtan 0 [Pa] to
more than 5.5 *1019 [Pa].
From this graphs, the only consideration to result is that the Trent XWb engine may be easier to implement as it functions at lower pressures.
Figure 14: Temperature vs.Thrust (three spool axles)
One more time, the similarities between the engines are evident, however a couple of differences are evident as well.
Trent 900 Trent XWb
The limits of thrust vary for engine Trent XWb from -1.35*105 [N] to -0.97*105
[N], and for the Trent 900 from -1.38*105 [N] to -1.025*105 [N]. And the
temperatures values for low and high pressure compressors from 950K to 550K in the 900 engine, while for XWb engine the temperatures are from 850 K to 550 K.
In the second set of differences is quite dependent in the atmospheric temperatures and the speed of the airflow, therefore is comprehensible the lower temperature in the engine with the faster airflow, which in this case is engine Trent XWb.
Figure 15: Altitude vs. Temperature (three spool axle)
Trent XWb
59
When comparing the temperature variation and altitude, both engines have almost the same profile, the only difference is that the initial temperatures (low pressure and medium pressure compressors) for engine Trent XWb the values do not exceed 800K, however for engine Trent 900, it starts at a higher level than 800K and are in all spectrum higher than the other engine.
This can be explain by the fact that the engine Trent XWb has a higher Bypass ratio (9.3 to 8.7) allowing for this image to happen.
Figure 16: Altitude vs. Pressure (three spool axle)
Finally, the pressure variation over altitude is represented in this set of graphs, by a normal variation of pressure, but with a big difference in the values. For engines Trent XWb, the maximum value is of 4.5*1020 [Pa] present in the low pressure turbine, and for more than 6*1020 [Pa] for engine Trent 900. However the values tend to a set of similar values at 11000 meters. Trent XWb