© FECAP
DOI: 10.7819/rbgn.v16i52.1614
Subject Area: Organizational Strategy And Behavior
The Effects of Quality Management Practices on Key Results:
questionnaires sample for the industry of tourist accommodation in Spain
Los efectos de las prácticas de gestión de la calidad en los resultados clave:
muestra
de cuestionarios para el sector del alojamiento turístico en España
Os Efeitos das Práticas de Gestão da Qualidade nos Resultados-chave: amostra de
questionários para o setor de hospedagem turística na Espanha
José Álvarez García1
María de la Cruz del Río Rama2
Mercedes Vila Alonso3
Received on April 21, 2013 / Approved on October 15, 2014 Responsible editor: João Maurício Gama Boaventura, PhD. Evaluation process: Double Blind Review
1. Doctor in Tourism from the University of Vigo. [pepealvarez@unex.es]
2. Doctor in Business Management from the University of Vigo. [delrio@uvigo.es] 3. Doctor in Business Management from the University of Vigo. [mvila@uvigo.es]
Authors’ address: Departamento de Economía Financiera y Contabilidad, Facultad de Estudios Empresariales y Turismo, Universidad de Extremadura - Avenida de la Universidad, nº 47 – CEP. 10071 – Cáceres – Spain
ABSTRACT
In this research work, we examine the direct and indirect effects of quality management practices on key results and we identify the relationship between quality practices. To achieve the proposed objective, a structural model was used, taking into account the previous review of the literature, in order to identify the quality practices and causal relationships with the key results. The theoretical model and hypotheses are tested using data collected from a sample of 186 tourist accommodation companies certified with the “Q for Tourist Quality” standard in Spain, from a questionnaire based on quality practices identified in the literature and on the EFQM
influence key results are quality policy/planning along with leadership, when considering the total effects (direct and indirect).
Keywords: Quality management. Key results. Tourism industry. Structural equation model. Spain.
RESUMEN
En este trabajo de investigación se examinan los efectos directos e indirectos de las prácticas de la Gestión de la Calidad en los resultados clave, y se identifican las relaciones entre las prácticas de la calidad. Para cumplir con el objetivo propuesto se plantea un modelo estructural teniendo en cuenta la revisión previa de la literatura con el propósito de identificar las prácticas de calidad y las relaciones causales con los resultados clave. El modelo teórico y sus hipótesis son testados usando los datos obtenidos de una muestra de 186 empresas de alojamiento turístico certificadas con la marca “Q de Calidad Turística” en España, a partir de un cuestionario elaborado en base a las prácticas de calidad definidas en la literatura y por el Modelo EFQM, tomando como referencia algunas de las escalas más relevantes. La metodología empleada consiste en la aplicación de un Análisis Factorial Exploratorio y Confirmatorio para validar las escalas (fiabilidad, unidimensionalidad y validez) y delimitar el número de ítems de cada uno de los instrumentos de medida de los constructos planteados para, a continuación, estimar el modelo causal propuesto procediendo a contrastar las hipótesis planteadas mediante la técnica Modelo de Ecuaciones Estructurales (SEM). Los resultados obtenidos apoyan las relaciones entre las prácticas de la calidad y el impacto directo y positivo de dos de las prácticas: gestión de los procesos y política/planificación de la calidad, en los resultados clave. También se observó que las prácticas de calidad que más influyen en los resultados clave son la política/planificación de la calidad junto con el liderazgo teniendo en cuenta los efectos totales (directos e indirectos).
Palabras clave: Gestión de la calidad. Resultados clave. Sector turístico. Modelo de ecuaciones estructurales. España.
RESUMO
No presente trabalho de pesquisa foram analisados os efeitos diretos e indiretos das práticas de Gestão da Qualidade nos resultados-chave e foram identificadas as relações entre as práticas da qualidade. Para atingir o objetivo proposto, apresenta-se um modelo estrutural que leva em consideração a revisão prévia da literatura com o propósito de identificar as práticas da qualidade e as relações causais com os resultados-chave. O modelo teórico e suas hipóteses foram testados usando-se os dados obtidos a partir de uma amostra de 186 empresas de hospedagem turística certificadas com a marca “Q de Qualidade Turística” na Espanha, a partir de um questionário elaborado com base nas práticas de qualidade definidas na literatura e pelo Modelo EFQM, tomando-se como referência algumas das escalas mais relevantes. A metodologia usada consiste na aplicação de uma Análise Fatorial Exploratória e Confirmatória para validar as escalas (confiabilidade, unidimensionalidade e validade) e delimitar o número de itens de cada um dos instrumentos de medida dos construtos propostos, para, em seguida, elaborar o modelo causal proposto, procedendo ao teste das hipóteses levantadas por meio da técnica do Modelo de Equações Estruturais (SEM). Os resultados obtidos reforçam as relações entre as práticas de qualidade e o impacto direto e positivo de duas das práticas: gestão de processos e política/ planejamento da qualidade, nos resultados-chave. Também foi observado que as práticas da qualidade que mais influenciam nos resultados-chave são a política/planejamento da qualidade junto com a liderança, levando-se em conta os efeitos totais (diretos e indiretos).
Palavras-chave: Gestão da qualidade. Resultados-chave. Setor turístico. Modelo de equações estruturais. Espanha.
1 INTRODUCTION
allow companies to be competitive in current markets, by providing then with a focus on continuous improvement of each of the business aspects; to improve the activities, which we call internal quality (LEE; TO; YU, 2009; MAK, 2011) and the performance of the companies (external quality) or business performance (POWELL, 1995; KAYNAK, 2003; ROCA PUIG et al., 2005).
In this respect, the TQM allows companies to increase their market share, the customers’ and employees’ satisfaction, as well as the service efficiency and quality by improving their internal processes (CAMISÓN; CRUZ; GONZÁLEZ, 2007; SILA, 2007; LEE; TO; YU, 2009; MAK, 2011). A longer list of benefits resulting from the implementation and certification of ISO 9000 standards can be checked in Camisón, Cruz and González, 2007.
In the literature review about Quality Management, we could identify two clearly defined lines in regard to the management system:
1) Studies which purpose is to elaborate an instrument to measure quality. Their objective is to identify the main quality practices (critical factors), in the manufacturing industry (FLYNN; SCHROEDER; SAKAKIBARA, 1994; AHIRE; GOLHAR; WALLER, 1996), those applicable both to the services and manufacturing industries (SARAPH; BENSON; SCHROEDER, 1989; BLACK; PORTER, 1996; QUAZI et al., 1998, RAO; SOLIS; RAGHUNATHAN, 1999), and the elaboration of a measurement instrument to measure the service quality only applicable to service companies (the SERVQUAL model) elaborated by Parasuraman, Zeithaml e Berry (1988), servperf, hotelqual.
2) Studies which have shown the connection between quality management and results improvement in the company, and with the performance improvement. Few studies have identified the direct or indirect relation between both variables. Data show the existence of connections between
the TQM factors and the company’s performance, however it could not be strictly evidenced that the TQM leads to a higher performance, but only that there is a relation (POWELL, 1995). On the other hand, in other studies such relation is very weak and not always significant (SOUSA; VOSS, 2002). Therefore, the TQM not always improves the performance. Kaynak (2003) states that the impossibility of obtaining consistent results could be due to three significant differences among the studies. On one hand, the design of investigations; some authors such as Douglas and Judge (2001) regard the TQM as a single construct, while others such as Samson and Terziowski (1999) regard it as a multidimensional construct. Secondly, the measurement of performance levels: Samson and Terziowski (1999) consider the operational performance, and Douglas and Judge (2001) the financial performance. In third place, the analysis techniques, multiple regression in the study of Samson and Terziowski (1999), and correlations in the study of Powell (1995).
In this line, the goal of this investigation work is to analyze the structure of relations between quality practices and key results, i.e., how they operate and their degree of influence on them, as well as the existing interrelations between practices.
This investigation is relevant to the professionals of the tourist accommodation industry, because it can provide information about which quality practices they should focus on to improve key results (financial/performance).
are few investigations studying the positive impact of the implementation of quality management in tourism companies, both considering the financial performance and the performance improvements (CLAVER; TARÍ; PEREIRA, 2006; NICOLAU; SELLERS, 2010; RUBIO-ANDRADA; ALONSO-ALMEIDA; RODRÍGUEZ-ANTÓN, 2011; ALONSO-A L M E I D ALONSO-A ; R O D R Í G U E Z - ALONSO-A N T Ó N ; RUBIO-ANDRADA, 2012; TARÍ-GUILLÓ; PEREIRA-MOLINER, 2012).
Thus, our starting point is to conduct a study on the tourism industry, more specifically on the tourist accommodation segment, given the importance of the tourism industry in current economies (according the World Tourism Organization-WTO, the contribution of tourism to the world economic activity was estimated as being around 5% in 2011, its contribution to the employment is estimated as being between 6% and 7% of the total number of jobs in the entire world, both direct and indirect jobs), an industry in which the quality cannot be managed as in the manufacturing industry (CAMISÓN; CRUZ; GONZÁLEZ, 2007), due to the special features of services in view of the products; intangibility, inseparability of production from consumption, labor intensity, heterogeneity, caducity, etc., and that is why the study of Quality Management is so important for this industry.
In face of our work, we are interested in highlighting that the study is conducted in companies that have the “Q of Touristic Quality” Brand based on the standard UNE182001:2008 – hotels and touristic apartments, intermediary Quality Management System between assurance (ISO 9001) and Total Quality (EFQM). So far, the investigations on Quality Management were mainly done within the scope of ISO 9001 or the European Excellence Model (EFQM), and given the peculiarities of the UNE standard we expose as follows, we regard the conduction of investigations within this context as important.
With the aim of providing satisfaction to the customer, this standard standardizes from the management system to the service provision, including infrastructure and equipment. From the
customer viewpoint, the ISO 9001 certification (specific for the implementation of the Quality Management System) does not ensure a concrete quality level, but only that the service will comply with the specifications defined by the establishment. In the case of the standards of the ICTE – Instituto para la Calidad Turística Española - www.icte.es (standards that define the customer service level), such standards specify that a specific quality system should be determined for the touristic establishment (Camisón, Cruz, and González, 2007), and include the service specifications that should be implemented by the company adhering to the system.
In order to achieve the proposed objective, this work is structured in the following items. Firstly, a review of the literature on quality management practices and their relation with results is done. Secondly, from such literature review, the theoretical model and the hypothesis are defined. In the next item, the employed methodology is described; in this work, we have decided to use a questionnaire with 68 items grouped into 7 constructs accomplished by 186 tourist accommodation companies certified with the “Q of Touristic Quality” brand in Spain, and then the results from the structural model are shown. In the next item, results are discussed and the study limitations are shown, ending with conclusions and future lines of investigation.
2 LITERATURE REVIEW
2.1 Quality management practices
The TQM is configured by a system of values/principles, as well as by a set of practices or techniques used to be effectively implemented. In the literature about the subject, it was demonstrated that to effectively implement the TQM with success it is necessary to take into account quality principles along with practices, tools and techniques that allow the application of such principles (ZHANG, 2000). Kanji (1998) determines that the critical success factors are the key areas of the organization that, once properly managed, ensure the improvement of competitiveness and the business excellence.
Such critical factors/practices of quality to be taken into account were identified in three different areas:
1) The contributions of quality gurus that show both the strong and weak points of quality management, fundamental to develop further studies that have identified the critical factors, in an attempt to provide companies with quality components they should focus on.
2) Models for the quality implementation. Two major trends; standardized standards of quality assurance, such as the ISO 9000 standards family, and models underlying quality awards based on quality management such as the EFQM Model, etc.
3) Investigations carried out by researchers. In this respect, the critical factors identified vary according to the researcher, since each researcher highlights those that from his/her viewpoint are fundamental to correctly manage the organization, improve competitiveness and business excellence (KANJI, 1998).
Because of all that, it is necessary to come to an agreement on which are those quality management principles. Many researchers have conducted investigations on that throughout the years, with highlight on three works that have proposed to compile the critical factors used in the studies performed in the past few years: Sila
and Ebrahimpour (2002); Claver, Tarí and Molina (2003); Camisón, Cruz and González (2007).
In our investigation, the critical factors considered are the following: leadership, quality policy/planning, alliances and resources, employees management, learning, processes management, and continuous improvement. In order to choose the critical factors, we based on previous investigations, especially on those works that have elaborated a measurement instrument of the Quality Management, applied both to manufacturing and service companies (SARAPH; BENSON; SCHROEDER, 1989; FLYNN; SCHROEDER; SAKAKIBARA, 1994; BLACK; PORTER, 1996; AHIRE; GOLHAR; WALLER, 1996; QUAZI et al., 1998), and on the EFQM model.
2.2 Relation between the tqm and the business
result
As the starting point, it seems interesting to us to define the meaning of business performance, i.e., the different levels of performance within the company. This encompasses both the quality results (subjective variables) and the economic-financial result (objective variables).
According to Claver, Tarí and Pereira (2006, p. 35) “quality can influence performance through two supplementary ways”. It can have: a) internal effects through processes (increase of workers and infrastructure productivity, improvement of efficiency, reduction of costs), and b) external effects through the market (related to the effect of quality on customers satisfaction and on services demand; increase of sales and market share, improvement of image, etc. (SINGELS; RUËL; VAN DE WATER, 2001).
results than the non-certified ones in aspects such as rework, efficiency, customers and employees satisfaction, service quality and market share (LEE; TO; YU, 2009; MAK, 2011), although the effects on the financial result are not yet clear; (2) the second approach indicates that certified companies get better financial results than the non-certified ones, since they improve their internal processes (MOKHTAR; MUDA, 2012); (3) the third and more negative approach states that the certification does not influence business results (MARTÍNEZ-COSTA; et al, 2009; LO; YEUNG; CHENG, 2011)”.
Studies actually conducted within the context of the tourism industry also show disparities of results, but we agree with Tarí-Guilló and Pereira-Moliner (2012, p. 55) that indicate that “certification can improve results, including financial results”, in companies of the tourism industry.
In regard to works studying the positive effect on the business performance, we see a broad relation of those in Claver, Tarí and Pereira, 2006. A subsequent work by Ul Hassan et al. (2012) has also examined the effect of TQM practices on the results of quality, business and organizations. In their work, they collect several works in which the impact on business results is positive; Karani and Bichanga (2012), Zehir et al. (2012). Likewise, Marín Vinueza (2009) conducted a study in which he summarizes the contributions made in the investigation of quality and its relation with financial results.
This positive relation can also be found in studies of the tourism industry. To improve financial results (CLAVER; TARÍ; PEREIRA, 2006; NICOLAU; SELLERS, 2010; RUBIO-ANDRADA; ALONSO-ALMEIDA; RODRÍGUEZ-ANTÓN, 2011; SEDLÁCEK et al., 2011, ALONSO-ALMEIDA; RODRÍGUEZ-ANTÓN; RUBIO-ANDRADA, 2012), to improve operational results and quality results (NIELD; KOZAK, 1999; RUBIO-ANDRADA; A L O N S O A L M E I D A ; RO D R Í G U E Z
-ANTÓN, 2011; TARÍ-GUILLÓ; PEREIRA-MOLINER, 2012).
2.3 The investigation model and hypothesis
proposal
Through the literature review conducted, we could generally evidence that TQM practices are related with each other, and with results (KAYNAK, 2003; TARÍ; MOLINA; CASTEJÓN, 2007; MOON; et al, 2011; TARÍ-GUILLÓ; PEREIRA-MOLINER, 2012; HERAS-SAIZARBITORIA; MARIMON; CASADESÚS, 2012). In our investigation, we propose a model of relations between TQM practices and key results in the tourist accommodation segment with the aim of studying the direct and indirect relations between both variables. Due to the scarce literature on the study of such relations in the tourism industry, the hypotheses proposed in the investigation model come from studies conducted within the manufacturing or services industries scope.
2.3.1 Leadership
Leadership Management is the most important factor for the successful implementation of the TQM, a statement made by quality gurus (JURAN, 1988) and corroborated by the results of countless studies (SARAPH; BENSON; SCHROEDER, 1989; FLYNN; SCHROEDER; SAKAKIBARA, 1994; CURKOVIC; VICKERY; DROGE, 2000), since it improves performance, influencing other quality practices. In this regard, in order to manage quality in the organization, quality should be planned (SARAPH; SEBASTIAN, 1993). Management is in charge of such planning by defining values, objectives, systems to satisfy customers (AHIRE; GOLHAR; WALLER, 1996) and an environment of learning, and internal and external cooperation
(ANDERSON; RUNGTUSANATHAM;
SCHROEDER, 1994). Through this, the
permanently visible in all management levels (DEAN; BOWEN, 1994), since it works as a guide and stimulates the process of implementation of Quality Management. Considering the above, we propose the following hypotheses:
H1: High management leadership positively and significantly influences alliances and resources.
H2: High management leadership positively and significantly influences quality policy/planning.
H3: High management leadership positively and significantly influences people management.
H4: High management leadership positively and significantly influences learning.
2.3.2 Alliances and resources
The relation between alliances and resources in managing processes within the company is an aspect frequently addressed in literature (CURKOVIC; VICKERY; DROGE, 2000; ESKILDSEN; DAHLGAARD, 2000). They actually analyze how the organization plans and manages its external alliances and internal resources in support to its policy, strategy and effective functioning of its processes.
Eskildsen and Dahlgaard (2000) carried out an empiric analysis of the EFQM model in which they found a positive and significant relation between alliances and resources management and key processes management. Others have suggested that good relations with suppliers can have a positive effect on processes management (KAYNAK, 2003), as well as other practices such as quality planning, human resources management, focus on the customer (SAMSON; TERZIOVSKI, 1999) and learning
(ANDERSON; RUNGTUSANATHAM;
SCHROEDER, 1994). Consequently, quality
planning, human resources management, learning, suppliers management, and focus on
the customer are related in a positive way with processes management. This leads us to propose the following hypotheses:
H8: Alliances and resources management positively and significantly influences processes management.
H9: Alliances and resources management positively and significantly influences continuous improvement.
2.3.3 Quality policy/planning
Another critical factor that might have positive effects on processes management and continuous improvement is the quality policy/ planning. According to Winn and Cameron (1998), policy and strategy should be practiced by developing key processes, an appropriate human resources policy and management, and by establishing alliances. Likewise, Samson and Terziovski (1999) state that planning can impact the processes management. Since a company has to plan its activities to improve quality, it seems logical that planning should positively affect its processes management and its continuous improvement (TARÍ; MOLINA; CASTEJÓN, 2007).
In the same line, a study conducted by Eskildsen and Dahlgaard (2000) demonstrated that the policy and strategy defined by management condition people and resources management, and they have also verified that processes depend on people and resources management, and on the very definition of policy and strategy. Accordingly, Reiner (2002) confirms in his work that policy and strategy influence leadership and processes management. Leadership is also related to resources, and determines the management of processes.
The aforementioned lead us to propose the following hypotheses:
H6: Quality policy/planning positively and significantly influence the management of people.
H10: Quality policy/planning positively and significantly influence the management of processes.
H11: Quality policy/planning positively and significantly influence the continuous improvement.
2.3.4 Employees management
T he relation between employees management and processes management has not been fully analyzed by the researchers of the quality management sphere. In this regard, we should highlight the studies of Samson and Terziovski (1999); Wilson and Collier (2000) that confirm that employees and processes management are interrelated. In subsequent works, Kristensen, Juhl and Eskildsen (2001); Eskildsen, Kristensen and Juhl (2002), state that people management has a direct relation with processes management, since the later is influenced by human resources management. In fact, they state that those organizations that do not make efforts to motivate their employees to solve problems do not manage to get them fully involved with processes management, nor in effectively transferring knowledge, all of that reflecting on processes management. This leads us to propose the following hypotheses:
H12: Employees management positively and significantly influences processes management.
H13: Employees management positively and significantly influences continuous improvement management.
H7: Employees management positively and significantly influences learning.
2.3;5 Learning
Learning is the last critical factor directly affecting processes management and
continuous improvement (ANDERSON;
RUNGTUSANATHAM; SCHROEDER, 1994).
In this regard, learning and capacity building can have a positive effect on continuous improvement, because the continuous improvement is based on the constant guidance towards learning, which should include investment in capacity building (HACKMAN; WAGEMAN, 1995). According to Tarí, Molina and Castejón (2007:489) “learning and processes management are mutually reinforced”, since people are those who conduct processes and, therefore, can influence them thanks to the learning process that facilitates the application of processes management (ANDERSON;
RUNGTUSANATHAM; SCHROEDER, 1994).
We propose the following hypotheses:
H14: Learning positively and significantly influences processes management.
H15: Learning positively and significantly influences the continuous improvement.
2.3.6 Management through processes and continuous improvement
Processes management contributes to continuous improvement (ANDERSON; RUNGTUSANATHAM; SCHROEDER, 1994), and thus we propose the following hypotheses:
H16: Processes management positively and significantly influences continuous improvement.
H17 (4): Processes management positively and significantly influences key results.
H18 (4): Continuous improvement positively and significantly influences key results.
The proposed structural model is shown in the figure. The figure shows the relations between latent variables to see how quality practices/critical factors affect key results,
i.e., to see if continuous management and processes management can actually be considered as predecessors of key results. In addition, we want to show if leadership influences the predecessors of key results through alliances and resources, quality policy/planning, employees management and learning, and therefore impacts such results through them.
FIGURE 1 – Diagram representing the proposed structural model
Source: The authors
3 INVESTIGATION METHODOLOGY
3.1 Construction of the measurement
instrument
With the aim of accomplishing the proposed objective, getting to know the interrelations between quality practices and key results of the organization, we have designed a questionnaire taking as reference the quality practices defined in the literature and by the EFQM Model. The review result was the generation of a set of items, taking as reference some of the most relevant scales: Saraph, Benson and Schroeder (1989), Black and Porter (1996); Powell (1995); Ahire, Golhar and Waller (1996) and EFQM Model. The questionnaire is comprised of 68 items grouped into 7 constructs,
leadership, quality policy/planning, alliances and resources, employees management, learning, processes management, and key results.
3.2 Target population
to be answered by them. The questionnaire was answered by 186 companies representing a response rate of 32.86%, and an error margin of 6.01%. The data collection processe started on April 1 and ended on May 30, 2010, being conducted through successive e-mails exchanged. In face of our work, we are interested in highlighting the most relevant feature of our target population. The tourist accommodation companies comprising the target population have implemented and are certified with the “Q of Touristic Quality” brand based on the UNE182001:2008 standard – hotels and touristic apartments. This brand was created in 1997 in Spain, being a Quality Management System specific and unique in the world for the Tourism Industry, granted by the Instituto de Calidad Turística Español (private, independent and non-profit organization), and currently there are 21 standards encompassing 21 touristic subsectors.
There are very few studies which scope is the Q of Touristic Quality. We can mention the study conducted by Álvarez, Fraiz and Del Río (2011), who have analyzed the barriers faced by Spanish beach resorts in the process of implementing the Q; Tarí-Guilló and Pereira-Moliner (2012) who have analyzed the influence of quality on hotel chains profits, and the study of Viada-Stenger, Balbastre-Benavent and Redondo-Cano (2010) that has analyzed the implementation of a Quality Management System (Q of Touristic Quality standard) in the case of the hotels segment.
As for the sample profile, companies belonging to nearly all the Comunidades Autónomas have answered the questionnaire, since we pursued the representativeness of each of them. As for the size or dimension of the establishments, most of them corresponds to small companies, 53.8% (0-49 workers), and medium companies, 46.2% (50 to 249 workers), 100 and 86 companies respectively. There are 65 (34.9%) companies certified for 3 years or less in the UNE 182001:2008 Standard (hotels and touristic apartments), 77 (41.4%) companies
certified for more than 3 years, but for 6 years or less, and 44 (23.7%) companies certified for more than 6 years.
3.3 Test of reliability and validity of
measurements
With the aim of evidencing whether the theoretical concepts considered have been properly measured through the items defined in the questionnaire, we have conducted an analysis of the constructs measurement instruments that are part of the proposed model. We have developed such process in two phases: one of exploratory nature through the exploratory factorial analysis, and the other in which we have conducted a first order Factorial Analysis, further depurating the observable variables, and keeping those that better represent the latent concept (HAIR et al., 1999).
In order to calculate the reliability, we have used the internal consistency method or Kunder Richardson method. With the aim of showing the scale reliability, the following analyses were carried out: we have proved that all the items of the scale had acceptable values of item-total correlation (over 0.3), and analyzed the a of Cronbach (1951), evidencing that they surpass the minimum allowed limit of 0.7. With this process, we have limited the number of items that will measure each concept.
The analysis of measurement scales reliability in the case of quality practices has allowed us to evidence that there is an item GEM8 in the employees management scale that has an item-total correlation below the recommended minimum (Nurosis, 1993) of 0.3, which was eliminated to improve the Alpha of Cronbach. In case of the result scale, RC6 and RC7 (key results) were eliminated. After depurating the scales, the Alpha of Cronbach coefficient has values above the 0.7 recommended by Nunnally (1979), which indicates to us the proper internal consistency of all analyzed scales.
with varimax rotation that allows to identify the underlying dimensions of each of the constructs, by sharing the variance amongst the different factors (HAIR et al., 1999).
As a prior step to conduct the factorial analysis, it is necessary to specify that the data obtained through the questionnaire are adequate to conduct the factorial analysis. To that end, it is necessary to examine the correlations matrix and to evidence if it is effectively pertinent to proceed with the analysis. In that manner: (1) we have proved that in the correlations matrix, amongst all the available variables, there is a significant number of high correlations (>0.5), and furthermore the determinant of the correlations matrix has a value near zero in all the scales; (2) Bartlett Sphericity Test, in our case, we can refuse this hypothesis in all the scales since the test value is high and is associated to a signification level below 0.05; (3) Test of appropriateness of Kaiser-Meyer-Olkin (KMO) measurement, in our case it has a value above 0.7; (4) The MSA Index is acceptable for values below 0.5; it has a value above 0.7.
The application of the factorial analysis did not suppose the elimination of any item, in all cases the factorial loads are above 0.5 (except GP8), not considering as significant factorial loads below 0.3 (HAIR et al., 1999). In all the scales, the accumulated percentage of the explained variance is above 50%.
As the second phase of the scales depuration process, we have submitted the factorial solutions to validation through the Confirmatory Factorial Analysis technique, which allows us to examine the measurement model and the structural model and the global model, which ensures the validity and reliability of the measurement scales by further depurating them if necessary.
In order to perform the structural measurement model adjustment we take into consideration the following indicators: (1) the
t value of each standardized critical coefficient should be over +- 1.96, and the standardized factorial loads of different variables should be over 0.5 (HILDEBRANT, 1987; STEENKAMP; VAN TRIJP, 1991); (2) the R2 parameter, which
measures the individual reliability of each indicator, shall have the value 0.5 recommended by Sharma (1996), while other authors, Homburg and Pflesser (2000), consider that values above 0.4 are sufficient (the clear noncompliance with limits marked in those indicators implicates the elimination of the indicators of the measurement scale and the reevaluation of the model). And, at last, we should evaluate the global model, we have determined the goodness of the model adjustment, not existing a set of measures generally accepted when jointly considering the measurement model and the structural model. Levý-Magin and Varela (2006) propose absolute, unhurried and incremental adjustment measures. To proceed with the analysis, we propose the following confirmatory factorial analyses for the different measurement scales in separate: (1) leadership; (2) quality policy/planning; (3) alliances and resources; (4) employees management; (5) learning; (6) processes management; (7) continuous improvement; and (8) key results.
T h e c r i t e r i a u s e d t o j u d g e t h e appropriateness of eliminating items were the Lambda estimator value (>0.5), the corresponding “t of Student” statistic value, and the R2 coefficient
TABLE 1 – Results of the confirmatory factorial analysis
Measurement variables
Standardized
loads T-student R2
Adjustment goodness
Measurement variables
Standardized
loads T-student R2
Adjustment goodness Leadership Learning lI3 LI5 LI6 LI7 LI8 0.691 0.902 0.873 0.728 0.827 ---11.135 10.849 9.208 10.351 0.478 0.814 0.762 0.530 0.684
χ2= 9.275 (P = 0.099) GFI =0.981 AGFI = 0.944
CFI = 0.993 χ2Normalized (χ2/df) = 1.875
AP4 AP6 AP7 AP8 0.841 0.823 0.859 0.882 ---13.387 14.292 14.847 0.707 0.677 0.738 0.779
χ2= 2.554 (P = 0.279) GFI =0.993 AGFI = 0.965
CFI = 0.999
Quality policy/planning Processes management: processes
pO1 PO3 PO4 PO5 PO6 PO7 0.787 0.746 0.641 0.823 0.914 0.863 ---10.955 9.134 12.425 14.239 13.232 0.620 0.556 0.412 0.677 0.836 0.745
χ2= 11.862 (P = 0.221) GFI = 0.978 AGFI = 0.948
CFI = 0.996 χ2Normalized (χ2/df) = 1.318
GP1 GP2 GP3 GP4 GP5 0.716 0.858 0.864 0.791 0.647 ---10.973 11.036 10.171 8.344 0.512 0.737 0.747 0.625 0.518
χ2= 5.257 (P = 0.385) GFI = 0.989 AGFI = 0.967
CFI = 0.999
Alliances and resources Processes management: continuous improvement
AL4 AL5 AL6 AL7 0.623 0.820 0.920 0.878 ---9.002 9.628 9.417 0.388 0.672 0.846 0.771
χ2= 6.332 (P = 0.042) GFI = 0.984 AGFI = 0.921
CFI = 0.990 χ2Normalized (χ2/df) = 3.166
GP12 GP13 GP14 GP15 0.586 0.796 0.961 0.965 ---8.463 9.423 9.435 0.344 0.634 0.924 0.931
χ2= 2.521 (P = 0.284) GFI = 0.993 AGFI = 0.966
CFI = 0.999
Employees management Key results
gEM1 GEM2 GEM5 GEM6 GEM7 GEM10 0.825 0.785 0.824 0.901 0.875 0.660 ---12.443 13.365 15.325 14.657 9.838 0.681 0.619 0.679 0.811 0.766 0.436
χ2= 14.613 (P = 0.102) GFI = 0.973 AGFI = 0.938
CFI = 0.993 χ2Normalized (χ2/df) = 1.624
RC2 RC3 RC4 RC10 0.853 0.866 0.801 0.499 ---13.345 12.370 6.852 0.728 0.751 0.642 0.249
χ2= 4.150 (P = 0.126) GFI = 0.989 AGFI = 0.943
CFI = 0.994
Source: The authors
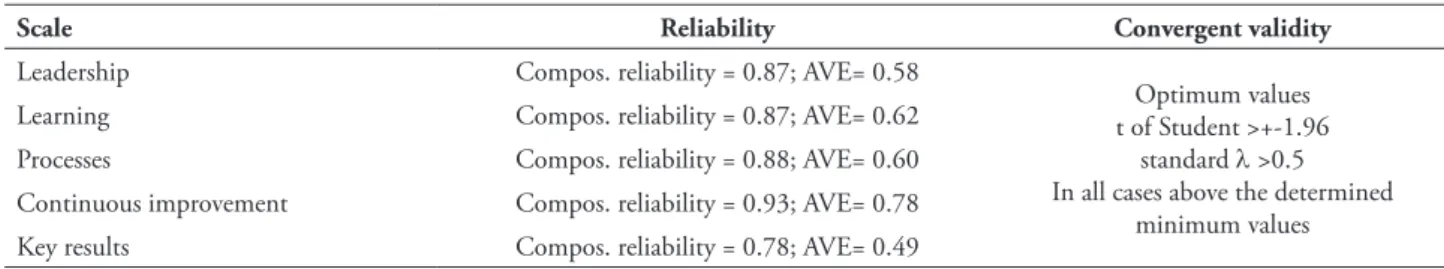
Proceeding with the evaluation of the measurement model, to finalize we have conducted the study of the different scales reliability, to which we have considered the Composed Reliability Coefficient and the Extracted Variance. In the case of reliability, it is considered that it has to have a minimum value of 0.7; although it is not an absolute standard, and there are researchers
that support that values above 0.6 are sufficient (BAGOZZI; YI, 1998). The extracted variance (AVE) reflects the total variance quantity of indicators collected by the latent construct, and shall be above 0.5 (HAIR et al., 1999). In our case,
both reliability tests, as observed in table 2, surpass the optimum accepted values in all the scales.
TABLE 2 – Analysis of scales reliability and validity
Scale Reliability Convergent validity
Leadership Compos. reliability = 0.87; AVE= 0.58
Optimum values t of Student >+-1.96
standard l >0.5 In all cases above the determined
minimum values Learning Compos. reliability = 0.87; AVE= 0.62
At last, to appraise the validity, the contents validity is studied (supported by the literature review done); the concept validity measured through the convergent validity (to which we have examined whether the standardized loads are >0.5 and the factorial loads > +-1.96), this occurring in all cases.
4 RESULTS OF THE STRUCTURAL
MODEL
In order to appraise the model, we have used structural equations, and more specifically the confirmatory factorial analysis, considering the measurement models previously obtained, resulting from the scale depuration process. The proposed initial model had non-significant critical coefficients (the t value to be significant has to be t>1.96), which supposed the successive elimination of causal relations H8 (alliances and
resources-processes management), H11 (quality policy/planning-continuous improvement), H15 (learning-continuous improvement).
After eliminating causal relations which critical coefficients were not significant, the model was re-specified, and it was verified that the data adjustment was low. For this reason, the modification indexes of potential relations and waste matrixes were studied. From both analyses, significant relations initially not considered were deduced, among which: continuous improvement-processes management, and quality policy/planning and key results.
The results of the final structural model confirm the proposed relations, and the critical coefficients of standardized loads in all cases are significant. The associated probability χ2 is 0.091 surpassing the recommended 0.05, which along with the indexes of the adjustment goodness make us regard the model as adequate, because they are within the recommended levels.
FIGURE 2 – Diagram Of The Final Structural Model
With the aim of further examining the effects of variables included in the model, the direct, indirect and total effects of the quality practices were taken into consideration in the key
results variable. Results show us that the quality policy/planning, along with leadership, are the most influential quality practices to key results.
TABLE 3 – Direct, indirect and total effects on key results
Effects 2. 3. 4. 5. 6. 7. 8th
1. LEADERSHIP
Direct 0.773 0.369 0.275 - 0.175 -
-Indirect - 0.339 0.467 0.563 0.481 0.620 0.377 Total 0.773 0.708 0.742 0.563 0.656 0.620 0.377
2. POLICY_PLANNING
Direct - 0.439 0.604 - - 0.206 0.308
Indirect - - - 0.380 0.298 0.263 0.105 Total - 0.439 0.604 0.380 0.298 0.468 0.413
3. MANAGEMENTEMPLOYEES_
Direct - - - 0.570 0.679 0.255
-Indirect - - - 0.288 0.121
Total - - - 0.570 0.679 0.543 0121
4. ALLIANCES_RESOURCES
Direct - - - 0.215 - -
-Indirect - - - 0.040 0.009
Total - - - 0.215 - 0.040 0.009
5. PM_Continuous improvement
Direct - - - 0.188
-Indirect - - - 0.042
Total - - - 0.188 0.042
6. LEARNING
Direct - - - 0.266
-Indirect - - - 0.059
Total - - - 0.266 0.059
7. PM_Processes
Direct - - - 0.223
Indirect - - -
-Total - - - 0.223
a RS_CLAVE Source: The authors
5 DISCUSSION OF RESULTS
5.1 Discussion
The main objective of this work was to investigate, on one side, the relation between TQM practices or critical factors and the key results, identifying the direct and indirect effects amongst the variables proposed in the proposed structural model.
Once the proposed model was tested, results show that there is a positive relation between the quality practices we have taken into consideration and the key results of the tourist
accommodation sector. This result supports those obtained by other works that have used different investigation methodologies (se compilation of studies which objective is to analyze the relations between quality management and business results in Nair, 2006), conducted in the manufacturing or services industries:
• Those in which the quality practices are operationalize in a single construct (HENDRICH; SINGHAL, 1996; DOUGLAS; JUDGE, 2001).
2006; UL HASSAN et al., 2012; MOBALLEGHI; MOGHADDAM, 2011; POWELL, 1995; SAJJAD; AMJAD, 2011; SHAIKH, 2012).
• At last, studies that use Structural Equations models and measure the quality as a multidimensional construct (ANDERSON et al., 1995; BRAH; WONG; RAO, 2000; KAYNAK, 2003; DEMIRBAG et al., 2006; SANTOS-VIJANDE; ALVAREZ-GONZALEZ, 2007; TARÍ; MOLINA; CASTEJÓN, 2 0 0 7 ; B O U - L L U S A R , 2 0 0 9 ; CARMONA; RIVAS; MARTÍM, 2010;
ARUMUGAM; MOJTAHEDZADEH;
MAL ARVIZHI, 2011; GÓMEZ;
COSTA; LORENTE, 2011; MOON et al., 2011; IQBAL et al., 2012).
On the other hand, these results also support those obtained by Langer (1997) and Nield and Kozak (1999) in the hotels segment, which have shown that the total quality management can influence the performance of hotels.
Results confirm the importance of the leadership factor to obtain key results, being this factor directly related to four variables included in the model; alliances and resources, quality policy/planning, employees management and learning. Direct effects supported by the works of Anderson et al. (1995), Flynn, Schroeder and Sakakibara (1995), Kaynak (2003), Tarí, Molina and Castejón (2007), Carmona, Rivas and Martín (2010), Gómez, Costa and Lorente (2011), Moon et al. (2011), variables that in turn directly influence the processes management, except for alliances and resources.
The management of processes which precedent variables are those previously mentioned, along with continuous improvement, is directly related to key results, this results being corroborated by the studies of Flynn, Schroeder and Sakakibara (1994), Ahire and Dreyfus (2000). Key results are directly influenced by processes
management and quality policy/planning. This study differs from the results of the work of Tarí, Molina and Castejón (2007), in which the quality results are directly influenced by the continuous improvement and employees management, but we should take into consideration that such authors include the construct of quality results; customers results, people results, results in the society, and quality results (key results), and in our study we only consider how the variables influence the key results.
From the study of direct and indirect effects, we can affirm that quality practices that most influence key results are quality policy/ planning, along with leadership.
At last, the R2 measurement that indicate
to us the variance quantity of the construct that is explained by the model (Figure 2) can be regarded as acceptable, and therefore the model is capable of explaining the key results, from the direct effect of processes management and quality policy/ planning, plus the indirect effect of the remaining quality practices encompassed by the model.
5.2 Limitations of the investigation
This investigation has some limitations. The first results from the conduction of the study and the specific features of the analyzed subsector “tourist accommodation”. The generalization of its conclusions should be carefully analyzed, always previously analyzing the features of the segment intended to study.
6 CONCLUSIONS
The tourism industry in Spain has had to face a very competitive environment and an increasingly globalized market in recent years.
We agree with Tarí-Guilló and Pereira-Moliner (2012, p. 63) who recommend that “the ICTE should foster the certification of a higher number of hotels”; only 3.60% of Spanish hotels are certified (469 hotels according to ICTE data in February 2013). There are many reasons why hotels should implement the Q standard (ICTE, 2012), benefits which have been empirically demonstrated in countless studies (HERAS-SAIZARBITORIA; ARANA; CASADESÚS, 2006; CAMISÓN; CRUZ; GONZÁLEZ, 2007): (1) improvement of the business management reflected on the product excellence, and consequently on competitiveness, (2) increase of staff capacity-building, (3) higher customer satisfaction, the system put into operation tools that allow satisfying the customers’ expectations, (4) continuous improvement of the establishment, etc.
Viada-Stenger, Balbastre-Benavent and Redondo-Cano (2010, p. 194) have conducted a study of the Hotel Majestic de Lanzarote case concluding that “the effective application of the quality management system [...] can provide several benefits to the organization, such as reputation, differentiation from competitors, increase of internal efficiency, processes improvement, customer satisfaction, and publicity”.
From the results of this study, we can withdraw the following implications to the tourist accommodation segment:
• The results indicate that the Q of Touristic Quality, systematized quality system (HERAS-SAIZARBITORIA, 2011), can be an important tool to improve the key results of establishments (ANTONY; ANTONY; GHOSH, 2004; CLAVER; TARÍ; PEREIRA, 2006; MARTÍNEZ-COSTA et al., 2009). This result contributes to supplement other studies mainly focused on the ISO 9001 standard, thus expanding to the case of
the Q certification of the ICTE on tourist accommodation.
• The quality practices that most influence key results are quality policy/planning, along with leadership. Leadership and the commitment of the organizations’ managers are fundamental aspects in the whole process of quality management. Managers should create values, set objectives, quality workers, and above all create an internal environment stimulating people to be involved in achieving the objectives defined by management. On the other hand, managers should focus on Quality planning, as part of Quality Management that defines quality objectives and strategies to achieve them (operational processes and resources).
REFERENCES
AHIRE, S. L.; DREYFUS, P. The impact of design management and process management on quality: an empirical examination. Journal of Operations Management, Amsterdam, v. 18, n. 5, p. 549-575, 2000.
AHIRE, S.L.; GOLHAR, D.Y.; WALLER, M. A. Development and validation of TQM implementation constructs. Decision Sciences, Atlanta, v. 27, n. 1, p. 23-56, Mar. 1996.
ALONSO-ALMEIDA, M. M.; RODRÍGUEZ-ANTÓN, J. M.; RUBIO-ANDRADA, L. Reasons for implementing certified quality systems and impact on performance: an analyses of the hotel industry. The Service Industries Journal, [S. l.], v. 32, p. 919-936, May 2012.
ÁLVAREZ, J.; FRAIZ, J. A.; DEL RÍO, M. C. The Q for tourist quality barriers found in the implementation process by certified Spanish resorts. International Conference “From Villes Thermales To Sustainable Health And Wellness
ANDERSON, J. C.; RUNGTUSANATHAM, M.; SCHROEDER, R. G. A theory of quality management underlying the Deming management
method. Academy of Management Review,
Briarcliff Manor, v. 19, n. 3, p. 472-509, July 1994.
ANDERSON, J. C.; RUNGTUSANATHAM, M.; SCHROEDER, R. G.; DEVARAJ, S. A Path Analytic Model of a Theory of Quality Management Underlying the Deming Management Method: Preliminary Empirical Findings. Decision Sciences, v. 26, n. 5, p. 637-658, 1995.
ANTONY, J.; ANTONY, F. J.; GHOSH, S. Evaluating service quality in a UK hotel chain: a case study. International Journal of
Contemporary Hospitality Management,
Bradford, v. 16, n. 6, p. 380-384, 2004.
ARUMUGAM, V. C.; MOJTAHEDZADEH, R.; MALARVIZHI, C. A. Critical success factors of total quality management and their impact on performance of Iranian automotive industry. In International Conference on Innovation,
Management and Service IPEDR, 2011, v. 14,
p. 312-316, Singapore: IACSIT Press.
BAGOZZI, R. P.; YI, Y. On the evaluation of structural equation models, Journal of the Academy of Marketing Science, [S. l.], v.16, n.1, p. 74-94, 1998.
BLACK, S. A.; PORTER, L. J. Identification of the critical factors of TQM. Decision Sciences, Atlanta, v. 27, n. 1, p. 1-21, Winter 1996.
BOU-LLUSAR, J. C. et al. An empirical
assessment of the EFQM Excellence Model: evaluation as a TQM framework relative to the MBNQA Model. Journal of Operations Management, Amsterdam, v. 27, n. 1, p. 1-22, Jan. 2009.
BRAH, S. A.; WONG, J. L.; RAO, B. M. TQM and business performance in the service sector: a Singapore study. International Journal of
Operations & Production Management, [S. l.], v. 20, n. 11, p. 1293-1312, 2000.
CAMISÓN, C.; CRUZ, S.; GONZÁLEZ, T.
Gestión de la calidad: conceptos, enfoques y sistemas. Madrid: Pearson Prentice Hall, 2007. CARMONA, M; RIVAS, M.A.; MARTÍN, E. Análisis de las relaciones intravariables del modelo EFQM mediante modelos de ecuaciones estructurales. 4th International Conference on Industrial Engineering and Industrial Management XIV Congreso de Ingeniería de Organización Donostia- San Sebastian, September 8th -10th, 2010.Disponible en: http://
adingor.es/congresos/web/uploads/cio/cio2010/ BUSINESS_ADMINISTRATION//96-106.pdf. CASADESÚS, M.; MARIMON, F.; ALONSO, M. The future of standardised quality management in tourism: evidence from the Spanish tourist sector. The Service Industries Journal, [S. l.], v. 30, n. 14, p. 2457-2474, Dec. 2010.
CLAVER, E.; TARÍ, J. J.; MOLINA, J. F. Critical factors and results of quality management: an empirical study. Total Quality Management and Business Excellence, Abingdon, v. 14, n. 1, p. 91-118, 2003.
______; ______; PEREIRA, J. Does quality impact on hotel performance? International Journal of Contemporar y Hospitality Management, Bradford, v.18, n. 4, p. 350-358, 2006.
CRONBACH, L. J. Coefficient alpha and the internal structure of test. Psychometricka, [S. l.], v. 16, n. 3, p. 297-334, Sept. 1951.
CURKOVIC, S.; VICKERY, S.; DROGE, C. Quality-related action programs: their impact on quality performance and firm performance.
Decision Sciences, Atlanta, v. 31, n. 4, p.
885-905, 2000.
practice through theory development. Academy
of Management Review, Briarcliff Manor, v. 19,
n. 3, p. 392-418, 1994.
DEMIRBAG, M. et al. TQM and market orientation’s impact on SMEs’ performance.
Industrial Management & Data Systems,
Orlando, v. 106, n. 8, p. 1206-1228, 2006.
DOUGLAS, T. J.; JUDGE, W. Q. Total quality management implementation and competitive advantage: the role of structural control and exploration. Academy of Management Journal, Briarcliff Manor, v. 44, n. 1, p. 158-169, 2001. ESKILDSEN, J. K.; DAHLGAARD, J. J. A casual model for employee satisfaction. Total Quality Management, [S. l.], v. 11, n. 8, p. 1081-1094, 2000.
ESKILDSEN; KRISTENSEN, K.; JUHL, H. J. Trends in EFQM criterion weights: the case of Denmark 1998-2001. Measurement Business Excellence, Bradford,v. 6, p. 22-28, 2002. FLYNN, B. B.; SCHROEDER, R. G.; SAKAKIBARA, S. The impact of quality management practices on performance and competitive advantage. Decision Sciences, v.26, n. 5, p. 659-691, 1995.
FLYNN, B. B.; SCHROEDER, R. G.; SAKAKIBARA, S. A framework for quality management research and associated measurement instrument. Journal of Operations Management, Amsterdam, v. 11, n. 4, p. 339-366, Mar. 1994. GÓMEZ, J. G.; COSTA, M. M.; LORENTE, A. R. M. A critical evaluation of the EFQM model.
International Journal of Quality & Reliability Management, Bradford, v. 28, n. 5, p. 484-502, 2011.
HACKMAN, J.R.; WAGEMAN, R. Total quality management: empirical, conceptual, and practical
issues”. Administrative Science Quarterly,
Ithaca, v. 40, n. 2, p. 72-119, 1995.
HAIR, J. F. et al. Análisis multivariante. 5th ed. Madrid: Prentice Hall, 1999.
HERAS-SAIZARBITORIA, I. ¿ Qué fue de la “isomanía”?: ISO 9000, ISO 14000 y otros metaestándares en perspectiva. Universia Business Review, Madrid, n. 29, p. 66-79, 2011. HERAS-SAIZARBITORIA, I.; ARANA, G.; CASADESÚS, M. The impact of quality management in European companies’ performance: the case of the Spanish companies. European Business Review, Bradford, v. 18, n. 2, p. 114-131, 2006.
______; MARIMON, F.; CASADESÚS, M. An empirical study of the relationships within the categories of the EFQM model. Total Quality Management & Business Excellence, Abingdon, v. 23, n. 5-6, p. 523-540, 2012.
HILDEBRANT, J. Consumer retail satisfaction in rural areas: A reanalysis for survey data. Journal of Economic Psychology, Amsterdam,v. 8, n. 1, p. 19-42, Mar. 1987.
HOMBURG, C. H.; PFLESSER, C. H. A multiple liar model of market-oriented organizational culture: meassurement issuies and performance outcomes. Journal of Marketing Research, [S. l.],v. 37, n.11, p. 449-462, 2000. IQBAL, T. et al. TQM and organization performance: the mediation and moderation fit.
Life Science Journal, [S. l.], v. 9, n. 4, 2012.
JURAN, J. M. Juran on Planning for Quality. The Free Press, Nueva York, 1988.
KANJI, G. K. Measurement of business excellence.
Total Quality Management, Abingdon, v. 9, n.7,
p. 633-643, Oct.1998.
KARANI, S. R.; BICHANGA, W. O. Effects of total quality management implementation on business performance in service institutions: a case of Kenya Wildlife Services International. Journal of Research Studies in Management, [S. l.], v. 1, n. 1, 59-76, 2012.
on firm performance. Journal of Operations Management, Amsterdam, v. 21, n.4, p. 405-435, 2003.
KRISTENSEN, K.; JUHL, H. J.; ESKILDSEN, J. Benchmarking Excellence. Measuring Business
Excellence, Bradford, v. 5, p. 19-23, 2001.
LANGER, M. Service quality in tourism:
measurement methods and empirical analysis. Frankfurt: Peter Lang, 1997.
LEE, P. K. C.; TO, W. M.; YU, B. T. W. The implementation and performance outcomes of ISO 9000 in service organizations: an empirical taxonomy. International Journal of Quality & Reliability Management, Bradford, v. 26, n. 7, p. 646-662, 2009.
LÉVY-MAGIN, J. P.; VARELA, J. Modelización
con estructuras de covarianzas en ciencias
sociales. España: NETBIBLO, 2006.
LO, C. K.Y., YEUNG, A. C. L. Y CHENG, T. C. E. Meta-standards, financial performance and senior executive compensation in China: an institutional perspective. International Journal of Production Economics, Amsterdam,v. 129, n. 1, p. 119-126, Jan. 2011.
MAK, B. L. M. ISO certification in the tour operator sector. International Journal of Contemporary Hospitality Management, Bradford, v. 23, n. 1, p. 115-130, 2011.
MARÍN VINUESA, L. M. Enfoques de estudio y modelos de investigación sobre calidad y resultados: una revisión crítica. Cuadernos de
Gestión, [S. l.], v. 9, n. 2, p. 89-110, 2009.
MARTÍNEZ-COSTA, M. et al. ISO 9000/1994,
ISO 9001/2000 and TQM: the performance debate revisited. Journal of Operations Management, Amsterdam, v. 27, n. 6, p. 495-511, Dec. 2009.
MOBALLEGHI, M.; MOGHADDAM, G. G. Linking TQM and financial performance. In 3rd International Conference on Information and
Financial Engineering, 2011, Shanghai, (China), p. 417-422. Disponible en: http://www.ipedr. com/vol12/77-C173.pdf
MOKHTAR, M. Z.; MUDA, M. S. Comparative study on performance measure and attributes between ISO and non-ISO certification companies. International Journal of Business and Management, Toronto, v. 7, n. 3, p. 185-193, 2012.
MOON, J. Y.; et al. A study on the causal relationships in the Korean National Quality Award Model. Total Quality Management & Business Excellence, Abingdon, v. 22, n. 7, p. 705-726, 2011.
NABITZ, U. et al. Improving the EFQM Model: an empirical study on model development and theory building on model defelopment and theory building using concept mapping. Total Quality
Management, [S. l.], v. 12, n. 1, p. 69-81, 2001.
NAIR, A. Meta-analysis of the relationship between quality management practices and firm performance: implications for quality management theory development. Journal of Operations Management, Amsterdam, v. 24, n. 6, p. 948-975, Dec. 2006.
NICOLAU, J. L.; SELLERS, R. The quality of quality awards: diminishing information asymmetries in a hotel chain. Journal of Business Research, New York, v. 63, n. 8, p. 832-839, Aug. 2010.
NIELD, K.; KOZAK, M. Quality certification in the hospitality industry: analyzing the benefits of ISO 9000. Cornell Hotel and Restaurant Administration Quarterly, Cornell, v. 40, n. 2, p. 40-45, Apr. 1999.
NUNNALLY, J. Psychometric theory. New York: McGraw-Hill, 1979.
NUROSIS, M. J. SPSS. Statistical Data Análisis. Chicado: SPSS Inc, 1993.
turismo internacional. 2011. Disponible en: <http://mkt.unwto.org/sites/all/files/docpdf/ unwtohighlights11sphr_2.pdf>. Acceso en: 12 nov. 2012.
PARASURAMAN, A.; ZEITHAML, V. A.; BERRY, L. L. A multiple-item scale for measuring consumer perceptions of service quality. Journal
of Retailing, New York, v. 64, n. 1, p. 12-40,
Spring 1988.
POWELL, T. C. Total quality management as competitive advantage: a review and empirical study. Strategic Management Journal, Chichester, v. 16, n. 1, p. 15-37, 1995.
QUAZI, H. A.; et al. Critical factors in quality management and guidelines for self-assessment: the case of Singapore. Total Quality
Management, [S. l.], v. 9, n. 1, p. 35-55, 1998.
RAO, S. S.; SOLIS, L. E.; RAGHUNATHAN, T. S. A framework for international quality management research: development and validation of a measurement instrument. Total Quality Management, London, v. 10, n. 7, p. 1047-1075, 1999.
REINER, G. (2002). Analysis of critical factors of company success based on the EFQM excellence model. Proceedings of the 7th World Congress for Total Quality Management, Verona, Italy. In: Kanji Quality Culture (Ed.), v.2, p. 361–366). Sheffield, UK: Kanji Quality Culture.
ROCA PUIG, V. et al. Un estudio de las relaciones entre los elementos de la dirección de la calidad y su carácter contingente. Revista Europea de Dirección y Economía de la Empresa, [S. l.], v. 14, n. 1, p. 11-24, 2005.
R U B I O A N D R A D A , L . ; A L O N S O -ALMEIDA, M. M.; RODRÍGUEZ-ANTÓN, J. M. Motivations and impacts in the firm and stakeholders of quality certification: evidence from small- and medium-sized service enterprises. Total Quality Management & Business Excellence, Abingdon, v. 22, n. 8, p. 833-852, Aug. 2011.
SAJJAD, F.; AMJAD, S. Assessment of total quality management practices and organizational development: the case of Telecom Services Sector of Pakistan. Mediterranean Journal of Social Sciences, Rome, v. 2, n. 2, p. 321-330, May 2011. SAMSON, D.; TERZIOVSKI, M. The relationship between total quality management practices and operational performance. Journal of Operations Management, Amsterdam,v.17, n. 4, p. 393-409, 1999.
SANTOS-VIJANDE, M. L.; ALVAREZ-GONZALEZ, L. I. TQM and firms performance: an EFQM excellence model research based survey.
International Journal of Business Science and Applied Management, [S. l.], v. 2, n. 2, p. 21-41, 2007.
SARAPH, J. V.; SEBASTIAN, R.J. Developing a quality culture. Quality Progress, Milwaukee, USA, v, 26, n. 9, p. 73-78, Sept. 1993.
SARAPH, J. V.; BENSON, P. G.; SCHROEDER,
R. G. An instrument for measuring the critical factors of quality management. Decision Sciences, Atlanta, v. 20, n. 4, p. 810-829, Dec. 1989.
SEDLÁČEK, M. et al. Relationship between quality and performance: tourism companies
in the Czech Republic. Review of Economic
Perspectives, Czech Republic, v. 11, n. 4,
p. 195-222, 2011.
SHAIKH, M. J. TQM and business performance: An investigation into FMCG Companies in Pakistan. International Journal of Scientific & Technology Research, [S. l.], v. 1, n. 10, p. 1-12, Nov. 2012.
SHARMA, S. Applied multivariate techniques. New York: John Wiley & Sons, 1996.
SINGELS, J.; RUËL, G.; VAN DE WATER, H. ISO 9000 series certification and performance.
International Journal of Quality & Reliability Management, Bradford, v. 18, n 1, p. 62-75, 2001.
SILA, I. Examining the effects of contextual factors on TQM and performance through the lens of organizational theories: an empirical study. Journal of Operations Management, Amsterdam. v. 25, n. 1, p. 83-109, 2007.
SILA, I.; EBRAHIMPOUR, M. An investigation of the total quality management survey based research published between 1989 and 2000: a literature review. International Journal of Quality & Reliability Management, Bradford, v. 19, n. 7, p. 902-970, 2002.
SOUSA, R.; VOSS, C. A. Quality management re-visited: a reflective review and agenda for future research. Journal of Operations Management, Amsterdam, v. 20, n. 1, p. 91-109, Feb. 2002. STEENKAMP, J. B.; VAN TRIJP, H. C. M. The use of LISREL in validating marketing constructs. International Journal of Research in Marketing,
Amsterdam,v. 8, n. 4, p. 283-299, 1991.
TARÍ, J. J.; HERAS-SAIZARBITORIA, I.; DICK, G. Internal and external drivers for quality certification in the service industry: do they have different impacts on success? SSRN – Social Science Research Network, [S.l.], Apr. 2012. Disponible en: <http://papers.ssrn.com/sol3/ papers.cfm?abstract_id=2041039>. Acesso em: 12 nov. 2012.
TARÍ, J. J.; MOLINA, J. F.; CASTEJÓN, J. L. The relationship between quality management practices and their effects on quality outcomes. European
Journal of Operational Research, v. 183, n. 2, p. 483-501, 2007.
TARÍ-GUILLÓ, J. J.; PEREIRA-MOLINER, J. Calidad y rentabilidad: análisis del certificado Q en las cadenas hoteleras. Universia Business Review, Madrid, n. 34, p. 52-67, 2012.
UL HASSAN, M. et al. Impact of TQM practices on firm´s performance of Pakistans´s manufacturing organizations. International Journal of Academic Research in Business and Social Sciences, [S. l.], v. 2, n. 10, p. 232-259,
2012.
VIADA-STENGER, M. C.; BALBASTRE-BENAVENT, F.; REDONDO-CANO, A. M.
The implementation of a quality management system based on the Q tourist quality standard. The case of hotel sector. Service Business, Heidelberg, v. 4, n. 3-4, p. 177-196, Dec. 2010.
WILSON, D. D.; COLLIER, D. A. An empirical investigation of the Malcolm Baldrige National Quality Award causal model. Decision Sciences, Atlanta, v. 31, n. 2, p. 361-383, 2000.
WINN, B.A.; CAMERON, K.S. Organizational quality: an examination of the Baldrige National Quality Award causal model. Decision Sciences, Atlanta, v. 39, n. 5, p. 491-512, 1998.
ZHANG, Z. Quality management approach in China. The TQM Magazine, Beldford, v. 12, n. 2, p. 92-105, 2000.
ZEHIR, C. et al. Total quality management
APPENDIX A - QUESTIONNAIRE
Questionnaire with 86 questions answered by the quality leaders of 186 tourist accommodation companies in Spain, in order to measure each of the constructs that are part of the proposed structural model.
Leadership (a of Cronbach=0.912; reliability measurement), regards the responsibility and behavior of all the management team in leading the company in the process of providing a service, according to the customer requirements with the aim of satisfying customers, as well as the impulse of all actions needed to continuously improve all the service provision processes, ensuring that the organization management system is developed and put into operation:
• Employees are stimulated to help implementing changes in the organization
• Managers and supervisors motivate their employees and help them performing a high level work
• Management recognizes the efforts and improvements attained by the staff
• Managers keep in contact with customers, suppliers, and this implies the encouragement and participation in alliances and improvement actions
• Managers identify and stimulate changes that should be carried out to improve, and their effectiveness is reviewed once implemented
Quality policy/planning (a = 0.920), regards: how the organization develops its mission and vision, through a strategy clearly focused on its interest groups „Customers, Employees, Society and Investors), supported by policies, plans, objectives, goals and proper processes). (It refers to: how the organization develops its mission and vision, through a strategy clearly focused on its interest groups „Customers, Employees, Society and Investors), supported by policies, plans, objectives, goals and proper processes:
• Strategies and plans are developed and implemented based on the information about customers’ requirements and the company’s capacities.
• Management communicates its strategy and objectives to all the staff
• Management communicates its strategy and objectives to customers, suppliers and other known external agents
• Staff is involved in defining objectives and plans
• Key processes are identified and developed from the business strategies or plans
• Results are evaluated by comparing them with the planned results, with the aim of introducing improvements Alliances and resources (a =0.879), refers to: How the organization plans and manages its external collaborators and internal resources to support it quality policy and strategy, and the effective functioning of its processes:
• A management plan for buildings, equipment and other materials (utilization manner, maintenance, insurances, renovations, etc.) is elaborated to improve the total performance of the organization
• Economic and financial resources are assigned and properly used in order to ensure the success of the strategy
• All the important information and generated knowledge is collected and managed, resulting in a reliable information user-friendly for the corresponding staff
• In general, the management of alliances and resources is done according to the strategy
Employees management (a =0.923), refers to: How the organization manages and develops the knowledge of people comprising it, and releases all their potential, both individually and in the team, and in the whole organization, and how it plans those activities to support its policy and strategy, and the effective functioning of its processes.
• The human resources management is done in line with the business strategy and/or plans
• Management is qualified in quality principles
• Employees are qualified in team work
• The experience and capacity building of people are adjusted to current and future needs, or according to the case, specific capacity building plans are developed.
• People are encouraged and supported to take responsibilities and make decisions, with no risk to the organization, get involved in improvement activities, work in teams, etc.
• The communication amongst the whole staff is down-up, up-down, and horizontal, so that employees are considered to be well informed, and their opinions are valued.
Learning (a =0.935), learning is the process through which new habilidades, destrezas, conocimientos, conductas valores are acquired as the result of the estudio, experiencia, instrucción, reasoning and observación:
• All company’s employees are trained in the total quality concepts
• Employees are qualified to develop team work
• Availability of resources for staff capacity building within the organization
Processes management (a =0.891), refers to: how the organization designs, manages and improves its processes with the aim of supporting its policy and strategy, and to generate value in an increasing manner to its customers and other stakeholders:
• Control and continuous improvement of key processes
• Prevention of defective products/services is a strong attitude in this organization
• Processes used in this organization include quality measurements
• Employees involved in different processes know how to evaluate them
• New products/services are developed with the intention to access other markets, anticipate the current market needs, or to be better than main competitors
Continuous improvement (a =0.845), dynamic character process that implies the execution of gradual, but very frequent changes, standardizing the obtained results after each improvement achieved “It is always possible to improve things”:
• Information is managed to support the quality improvement (analysis of business information, costs and financial aspects to support the development of improvement priorities)
• Increase of direct personal contacts of the organization with customers
• Use of customers’ requirements as the base for quality
• Managers and supervisors support the activities that improve the customers’ satisfaction Key results (a =0.878), what the organization achieves in regard to its planned final performance:
• Our quality program increased our revenue
• Our quality program increased our productivity
• Our quality program improved our competitive position
• The causes of such key results are analyzed and improvement plans or actions are implemented Note: All items are defined according the Likert scale of 7 positions. Items kept in the scale are shown.