JOSÉ ÁLVAREZ GARCÍA [email protected] Professor at Departamento de Economía Financiera y Contabilidad, Universidad de Extremadura - Extremadura, Spain
MARÍA DE LA CRUZ DEL RÍO RAMA [email protected]
Professor at Departamento de Organización de Empresas y Marketing, Universidad de Vigo – Ourense – Galicia, Spain
MERCEDES VILA ALONSO [email protected]
Professor at Departamento de Organización de Empresas y Marketing, Universidad de Vigo - Ourense - Galicia, Spain
JOSÉ ANTONIO FRAIZ BREA [email protected]
Professor at Departamento de Organización de Empresas y Marketing, Universidad de Vigo - Ourense - Galicia, Spain
ARTIGOS
Submitted 01.15.2013. Approved 01.09.2014
Evaluated by double blind review process. Scientiic Editor: Antonio Domingos Padula
DEPENDENCE RELATIONSHIP BETWEEN
THE CRITICAL QUALITY FACTORS AND
SOCIAL IMPACT
Relação de dependência entre os fatores críticos de qualidade e impacto social
Relación de dependencia entre los factores críticos de la calidad e impacto social
ABSTRACT
This paper shows the results of the empirical study conducted in 186 tourist accommodation busi-nesses in Spain certiied under the “Q for Tourist Quality”, own System Quality Management. It was raised with the purpose of analyzing the structure of the relationship between critical quality factors and results-social impact, how they operate and the level of their inluence on obtaining these results within the company. Starting from a deep theoretical revision we propose a theoretical model toge-ther with the hypotheses to be tested, and we proceed to validation using the technique of Structural Equation Models. The results obtained show that companies wishing to improve their social impact should take into account that leadership is the most important factor to achieve it. Leadership in-directly afects the social impact through its inluence on alliances and resources, quality policy/ planning, personnel management and learning.
KEYWORDS | Quality management, “Q for Tourist Quality”, social impact results, accommodation bu-sinesses, causal model.
RESUMO
Este artigo apresenta os resultados do estudo empírico realizado em 186 empresas de alojamento turístico na Espanha, certiicadas de acordo com “Q de Qualidade Turística”, Sistema de Gestão da Qualidade próprio. Foi criado com a inalidade de analisar a estrutura da relação entre os fatores críticos de impacto de qualidade e resultados – impacto social, como se operam e do nível da sua inluência sobre a obtenção destes resultados dentro da empresa. A partir de uma revisão teórica in-tegrante propomos um modelo teórico juntamente com as hipóteses a serem testadas, e procedemos à validação usando a técnica de modelos de equações estruturais. Os resultados obtidos mostram que as empresas que desejam melhorar seus resultados e impacto social deve levar em conta que a liderança é o fator mais importante para tal. A liderança afeta indiretamente o impacto social através de sua inluência sobre alianças e recursos, política de qualidade e planejamento, gestão de pessoal e de aprendizagem.
PALAVRAS-CHAVE | Gestão da Qualidade, “Q de Qualidade Turística”, resultados do impacto social, empresas de hospedagem, modelo causal.
RESUMEN
Este artículo presenta los resultados de un estudio empírico realizado en 186 empresas de alojamien-to turístico en España, certiicadas de acuerdo con la marca “Q de Calidad Turística”, un sistema de gestión de la calidad propio. Fue elaborado con la inalidad de analizar la estructura de la relación entre los factores fundamentales de la calidad y los resultados –el impacto social–, cómo se operan y el nivel de su inluencia sobre la obtención de dichos resultados dentro de la empresa. A partir de una revisión teórica integrada, proponemos un modelo teórico junto con las hipótesis que se han de probar y procedemos a su validación usando la técnica de los modelos de ecuaciones estructurales. Los resultados obtenidos muestran que las empresas que desean mejorar sus resultados y el impacto social deben tener en cuenta que el liderazgo es el factor más importante para ello. El liderazgo afecta indirectamente el impacto social a través de su inluencia sobre alianzas y recursos, política de cali-dad y planiicación, gestión del personal y del aprendizaje.
PALABRAS CLAVE | Gestión de la calidad, “Q de Calidad Turística”, resultados del impacto social, em-presas de alojamiento, modelo causal.
INTRODUCTION
Quality Management is used by companies as a way to improve their activities (internal quality) and their performance (exter-nal quality) (Kaynak, 2003), which allows them to achieve a sig-niicant improvement in satisfying customers, employees and business performance (Ghobadian & Gallear, 1996). Similarly, quality will allow them to diferentiate and compete in the cur-rent context, characterized by rapid changes in supply and de-mand (Casadesus, Marimon, & Alonso, 2010). For this reason, research in the quality management ield is necessary and rele-vant due to its impact on business operations.
The review of previous literature has enabled us to de-tect that quality management has been widely studied in the in-dustrial sector (Selles & Trigueros, 2008), but there are very few studies in the tourism sector (Harrington & Akehurst, 2000), a sector with unique and very diferent characteristics. On the oth-er hand, studies in the quality management area have been con-ducted mainly in the insurance ield, based on ISO 9001 or on Total Quality Management, EFQM Excellence Model.
The relevance of our study is based primarily on the se-lected target population, tourism businesses that have the Q for Tourism Quality Label, own brand of the sector in Spain and unique in the world. It will enable us to close the existing gap in:
1. Studies in tourism sector, considered by the Government as a strategic mainstay for economic recovery under the National and Integral Tourism Plan 2012-2015 (PNIT). The 2012:3 PNIT states that Spain is “the world’s irst destination in holiday tourism, the second country in tourism expenditure and the fourth in number of tourists. The tourist activity makes up for more than 10% GDP, creates 11% employment and counter-acts, to a great extent, our trade deicit. It is an important asset for the creation of wealth and employment, performing with great dynamism even in times of crisis and has a great stimu-lating ability on other productive sectors”.
2. Studies on the tourism sector are necessary because in practice quality of services cannot be managed in the same way as in industrial enterprises, due to special characteristics of services as opposed to products (intan-gibility, inseparability of consumption production, etc.).
3. Studies in Spanish tourism companies with a quality man-agement system based on the UNE 182001:2008, norm “Q for Quality” mark of hotels and tourist apartments. Legisla-tion is at an intermediate level between ISO 9001 (quality assurance) and the EFQM Model (Total Quality).
Secondly, the analysis of interrelations structure be-tween the diferent critical quality and results, are of vital im-portance when managing total quality in an organization. The knowledge of these internal relationships enables an organiza-tion to know which critical factors it must focus its eforts on and which have a greater efect on improving the performance of a particular interest group.
Therefore, the objective of this paper is to analyze the lationship structure between the critical quality factors and re-sults/social impact (corporate social responsibility, including environmental actions, social, ethical and expectations of soci-ety regarding organizations at a speciic moment of time (Carroll & Sabana, 2010). This will enable companies to know which key factors they should focus their eforts on, in order to improve the results in society, i.e., those management quality practices that help to develop elements of corporate social responsibility. According to the literature reviewed, we propose a theoretical model that enables us to analyze whether continuous improve-ment and process manageimprove-ment can be considered antecedents of results/social impact. We also want to contrast leadership in-luence through alliances and resources, quality policy/plan-ning, employee management and learning on the antecedents of results/ social impact.
To respond to the objectives, the work is divided into sev-eral sections. Firstly, establishing the theoretical framework used to conduct research and, from the theoretical review, a theoreti-cal model and hypotheses are established. The second section describes the methodology used, while the third includes the analysis of the results. The inal section presents the main con-clusions and implications of the work and future lines of research.
THEORETICAL FRAMEWORK AND
HYPOTHESES
The basic framework for this study is TQM and the mark “Q for Tourist Quality”. Quality has now become one of the key variables of competitiveness that companies should incorporate into their corporate strategy. Kanji (1998) determined that the principles or critical success factors are the key areas of the organization which, when properly managed, ensure improvement of competi-tiveness and business excellence. In the literature on the subject, it has been shown that for a Total Quality Management implemen-tation to be successful, the principles of quality or critical factors must be taken into account (Zhang, 2000).
orga-nization, improve competitiveness and business excellence. However, it is necessary to reach consensus on those quality management principles.
Many researchers conducted research in this direction (Saraph, Benson, & Schroeder, 1989; Conca, Llopis, & Tarí, 2004; among others). After this compilation of studies, it is clear that the TQM principles considered are diferent among diferent researchers, and vary in number. Ritchie and Dale (2000) state that despite the diferences between them, there are a number of common elements. In our research, the critical factors con-sidered are: leadership, quality policy/planning, alliances and resources, employee management, learning, process manage-ment and continuous improvemanage-ment.
With respect to the mark “Q for Tourist Quality”, it has originated in the commitment by the Spanish tourism industry in the early 90’s to implement quality standards. This quality management system has four components (Casadesús, Mari-mon, & Alonso, 2010, p. 2459): (1) quality standards speciic for each of the tourism sub-sectors, which deine the process, service standards and quality requirements thereof; (2) a cer-tiication system whereby an independent third party ensures that companies comply with the rules, (3) the Q Mark for Quali-ty Tourism, (4) a management body, known as the ICTE that pro-motes the system and is responsible for its execution, integrity and dissemination.
Its standards are at an intermediate level between ISO 9001 and EFQM Model, so that its implementation is perfectly compatible with ISO 9001 certiication and excellence and the diference between the two certiications meet the requirements and the level of demand for reference standards.
Although “Q for Quality” and ISO 9001 are compatible, they are not two identical systems. In this regard, Camisón, Cruz, and González (2007, p.618) identiies a number of diferences be-tween them: ISO 9001 is speciic for implementation of a Quality Management System, while ICTE standards include service speci-ications that should be implemented by the enterprise, ISO 9001 is more versatile and applicable to any organization while ICTE norms apply only to tourism. ISO 9001 certiication does not guar-antee a particular quality level but the service will meet the spec-iications recommended by the establishment.
Once deined the theoretical framework, we consider the hypotheses to be tested in order to respond to the objective stat-ed in our theoretical model, in which we analyze the structure of relationships between critical factors/quality elements and re-sults/social impact, i.e. how they perform and their level of inlu-ence on the results in society and the interrelationships between them. This will enable companies to know what key factors they should focus their eforts on, in order to improve social impact.
Relationship of leadership with alliances and
resources, quality policy/planning, employee
management and learning
Leadership management is the most important factor to suc-cessfully implement Quality Management principles; this statement is corroborated by numerous studies carried out by Saraph, Benson, and Schroeder (1989), among others. There-fore, leadership is considered to be one of the most important factors for the success of TQM (Fotopoulos & Psomas, 2010).
Leadership should be visible, permanent, efective and be extended to all executive levels (Waldman, 1994) because it acts as a guide and drive of Quality Management implementation pro-cess, creates and disseminates this management philosophy val-ues and should show his involvement through: (1) investment in human, material and inancial resources to support the achieve-ment of objectives and continuous improveachieve-ment which caus-es a positive efect on the organization strategic rcaus-esourccaus-es man-agement (Tutuncu & Kucukusta, 2007), (2) training of employees and encourage their involvement in quality management as one of the factors inluencing the successful implementation of TQM (Claver, Tarí, & Molina, 2003; Jiménez & Martínez, 2009).
Based on the above, it can be said that leadership is pos-itively associated with quality planning, employee manage-ment, learning, and alliances and resources. Therefore, we pro-pose the following hypotheses:
H1: Top management leadership has a positive and signii-cant inluence on alliances and resources.
H2: Top management leadership has a signiicant and pos-itive inluence on quality policy/planning.
H3: Top management leadership management has a signii-cant and positive inluence on personnel management.
H4: Top management leadership has a positive and signii-cant inluence on learning.
Relationship between alliances and resources,
quality policy/planning, employee
manage-ment and learning with process managemanage-ment
and continuous improvement
Each of the critical factors directly inluenced by leadership, in turn inluence the management of processes and continuous improvement.
strategy and effective process operation, is an aspect which is frequently dealt with in the literature on quality manage-ment (Curkovic, Melnyk, Calantone, & Handfield, 2000). Some authors like Eskildsen and Dahlgaard (2000), Valmo-hammadi (2011) and Heras, Marimon, and Casadesús (2012) have performed empirical analyses of the EFQM model, in which they found a positive and significant relationship be-tween management of alliances and resources and manage-ment of key processes. This collaboration contributes to ex-cellence in service delivery and generates customer value (Criado & Calvo-Mora, 2009).
Thus, good relationships with suppliers can have a pos-itive efect on process management (Kaynak, 2003), as well as other practices such as quality planning, human resource man-agement, customer focus (Samson & Terziovski, 1999) and learning (Anderson, Rungtusanatham, & Schroeder, 1994). As a result, quality planning, human resource management, learn-ing, supplier management and customer focus are positively re-lated to process management. Companies, like any organiza-tion, must optimize their scarce resources and properly manage suppliers of certain inputs that are a major expense in the bud-get, which will lead to better and more eicient performance of their processes or key activities (Osseo-Asare & Longbottom, 2002; Ward & Chandler, 1999).
This leads us to propose the following hypotheses:
H8: The management of alliances and resources has a sig-niicant and positive inluence on process management.
H9: The management of alliances and resources has a sig-niicant and positive inluence on continuous improvement.
The last criterion directly afecting process management and continuous improvement is quality policy and planning. Ac-cording to Winn and Cameron (1998), policy and strategy should be implemented through the deployment of key processes, ad-equate policy and personnel management, and by establishing alliance. According to Samson and Terziovski (1999), planning can impact on process improvement.
In a work developed by Eskildsen and Dahlgaard (2000), it was shown that the policy and strategy deined by manage-ment conditions personnel and resource managemanage-ment. It also veriies that the process depends on people and resources man-agement and the deinition itself of policy and strategy. In the same vein Reiner (2002), in his study, conirms that the policy and strategy has an inluence on leadership and management processes. Leadership is also related to resources and deter-mines management processes.
The above leads us to consider the following hypotheses:
H5: Quality policy/planning have a positive and signiicant efect on alliance and resource management.
H6: Quality policy/planning have a positive and signiicant efect on personnel management.
H10: Quality policy/planning have a positive and signii-cant efect on process management.
H11: Quality policy/planning have a positive and signii-cant efect on continuous improvement.
There are very few empirical studies that analyze the re-lationship between employee management and process man-agement. Wilson and Collier (2000) demonstrate how human resource management is signiicantly and positively related to process management, as the work of Kristensen, Juhl, and Es-kildsen, 2001 and EsEs-kildsen, Kristensen, and Juhl, 2002, who claim that personnel management has a direct relationship with process management, since processes are inluenced by human resource management. This research conirms that those orga-nizations that do not strive to motivate their employees to solve problems, will not achieve full involvement of their employees in process improvement, nor efective knowledge transfer which will afect process management.
According to Ahmad and Schroeder (2002) and Jiménez and Martínez-Costa (2009), personnel management is one of the most important parts for Total Quality Management success, since qual-ity improvement process is an organizational learning process, based on individuals. Thus, one of the best practices used in this sense, is empowerment, which consists of delegating employees the authority to evaluate, implement and control processes.
This leads us to propose the following hypotheses:
H12: Employee management has a positive and signiicant inluence on process management.
H13: Employee management has a positive and signiicant inluence on continuous improvement management.
H7: Employee management has a positive and signiicant inluence on learning.
H14: Learning has a positive and signiicant inluence on process management.
H15: Learning has a positive and signiicant inluence on continuous improvement.
In this context, process management contributes to contin-uous improvement (Anderson, Rungtusanatham & Schro-eder, 1994), so we pose the following hypothesis:
H16: Process management has a positive and signiicant ef-fect on continuous improvement.
Relationship of process management and
con-tinuous improvement with social impact results
In the EFQM model, process management is the link between the agents and results. So, proper process management and continuous improvement is positively related to the results of the organization, employees and customers (Bou-Llusar, Es-crig-Tena, Roca-Puig, & Beltrán-Martín, 2009; Gómez, Martínez, & Martínez, 2011; Heras et al., 2012).
Quality as excellence is not only intended to achieve key business outcomes, but also internal customer (employee) and external (consumers and / or users) satisfaction, as well as sat-isfaction of the society in which the irms carry out their activi-ty (Nabitz, Severens, Van Der Vrink, & Cansen, 2001, p. 70). In
this sense, Tarí and García (2011, p.77) demonstrated in their study “that companies with a higher level of quality manage-ment show, at the same time greater awareness for certain di-mensions of social responsibility.”
Some authors, considering numerous studies (Curkov-ic, 2003; Witanachchi, Handa, Karandagoda, Pathirage, Tenna-koon & Pullaperuma, 2007) that analyze how quality manage-ment can facilitate the developmanage-ment of social responsibility and environmental management, support the idea that the de-velopment of critical quality factors drives the dede-velopment of corporate social responsibility (McAdam & Leonard, 2003; Wi-tanachchi, Handa, Karandagoda, Pathirage, Tennakoon & Pulla-peruma, 2007). Considering these studies we pose the follow-ing hypothesis:
H17 (3): Process management has a positive and signiicant inluence on the social impact results.
H18 (3): Continuous improvement has a positive and signif-icant inluence on social impact results.
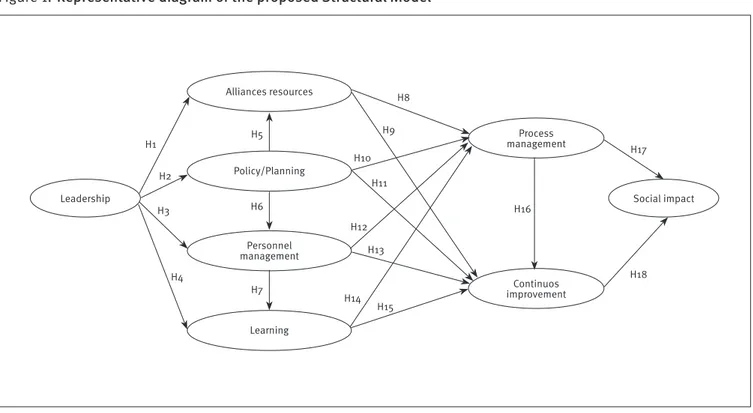
To summarize, in Figure 1 a sequence diagram or “path diagram” is shown with all the irst-order latent variables, in-cluding the hypotheses to be contrasted, which make up the theoretical model to be tested in this research. In Table 1, we collect the existing sources of scientiic information on the pro-posed theoretical model.
Figure 1.
Representative diagram of the proposed Structural Model
Alliances resources
Policy/Planning
Personnel management
Process management
Continuos improvement
Social impact Leadership
Learning H1
H2 H3
H4
H5
H6
H7
H8 H9 H10
H11
H12 H13
H14 H15
H16
H17
TABLE 1.
Reference studies
Construct Reference Studies
Leadership Dean and Bowen, 1994; Ahire et al., 1996; Yusof and Aspinwall, 1999.
Employee Management Flynn et al., 1994; Ahire et al., 1996.; Wilson and Collier, 2000; Ahmad and Schroeder, 2002.
Quality policy/planning Saraph et al., 1989; Porter and Parker, 1993; Black and Porter, 1996; Win and Cameron, 1998; Quazi et al., 1998; Ravichandran and Rai, 2000; Wilson and Collier, 2000.
Alliances and resources Ward and Chandler, 1999; Eskildsen and Dahlgaard, 2000; Curkovic et al., 2000 ; Osseo-Asare and Longbottom, 2002.
Processes and continuous improvement
Wilson and Collier, 2000; Eskildsen and Dahlgaard, 2000; Curkovic et al., 2000; Pannirselvam and Ferguson, 2001.
Learning Anderson et al., 1994; Hackman and Wageman, 1995.
Processes and continuous
improvement-Results Nabitz et al., 2001; Westlund, 2001; Reiner, 2002.
Critical factors-Results Boje and Winsor (1993); Mann and Keohe (1994); Spector and Beer (1994); Flynn et al. (1995); Powell (1995); Adam et al. (1997); Taylor and Wright (2003).
METHODOLOGY
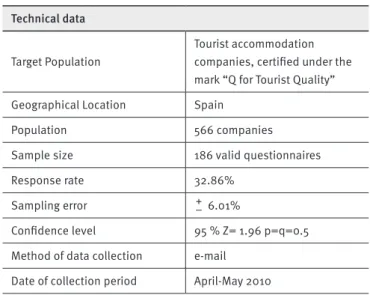
To contrast our theoretical model, we have chosen the tourist ac-commodation sector in Spain “Q for Quality” certiied. This de-cision is justiied by the three reasons already mentioned in the introduction of this work. Thus, the sample studied was com-posed of 566 companies. The database was developed from in-formation found on the website of ICTE-(Institute for Spanish Tourism Quality- www.icte.es). 186 companies responded to the questionnaire representing a 32.86% response rate and 6.01% margin of error (Table 2).
TABLE 2.
Technical information of study
Technical data
Target Population
Tourist accommodation companies, certiied under the mark “Q for Tourist Quality”
Geographical Location Spain
Population 566 companies
Sample size 186 valid questionnaires
Response rate 32.86%
Sampling error 6.01%
Conidence level 95 % Z= 1.96 p=q=0.5
Method of data collection e-mail
Date of collection period April-May 2010
Regarding the sample proile, if we analyze the size of the establishments, 100 of them (53.8%) correspond to small
busi-nesses (0-49 employees) and 86 to medium-sized enterprises representing 46.2% (50 to 249 employees). There are 65 (34.9%) irms which have been certiied with the UNE 182001:2008 and UNE186001: 2009 (hotels and apartments, spas) for 3 years and under, 77 (41.4%) irms for more than 3 years and up to 6 years and 44 enterprises (23.7%) with over 6 years.
In developing the measurement scales used to assess each of the proposed constructs, some of the most relevant scales in the literature have been used as a reference and adapted to the specific characteristics of the tourist accom-modation sector (Grandzol & Gershon, 1998, EFQM, 1999, among others).
DATA ANALYSIS
Test for reliability and validity
We begin our analysis by checking whether the measuring instru-ments of our model variables have been adequately measured through the proposed items in the survey. We have followed An-derson and Gerbing (1988) methodological recommendations, to validate measurement scales, by assessing their psychomet-ric properties: reliability, unidimensionality and validity.
We have developed this process in two phases: one with an exploratory nature, by using an exploratory factorial analy-sis and another one in which we carry out a Conirmatory Fac-torial Analysis of irst order for each of the scales, trying to edit more the observable variables and maintain those items that best represent the latent concept.
Estimation of the measurement model (reliability, unidimensionality and validity)
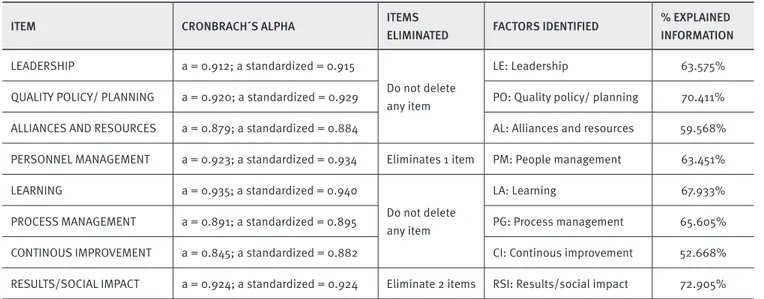
In order to test the scale reliability, the following analysis (internal consistency method or method of Kunder Richardson) was car-ried out: we check that all the scale items have an acceptable item-total correlation (above 0.3), and analyze Cronbach a together with the Standardized Cronbach a, proving that they exceed the minimum allowable limit of 0.8. This process enables us to deine the number of items measuring each concept (Table 3).
TABLE 3.
Reliability of measurement scales, critical factors and results/social impact
ITEM CRONBRACH´S ALPHA ITEMS
ELIMINATED FACTORS IDENTIFIED
% EXPLAINED INFORMATION
LEADERSHIP a = 0.912; a standardized = 0.915
Do not delete any item
LE: Leadership 63.575%
QUALITY POLICY/ PLANNING a = 0.920; a standardized = 0.929 PO: Quality policy/ planning 70.411%
ALLIANCES AND RESOURCES a = 0.879; a standardized = 0.884 AL: Alliances and resources 59.568%
PERSONNEL MANAGEMENT a = 0.923; a standardized = 0.934 Eliminates 1 item PM: People management 63.451%
LEARNING a = 0.935; a standardized = 0.940
Do not delete any item
LA: Learning 67.933%
PROCESS MANAGEMENT a = 0.891; a standardized = 0.895 PG: Process management 65.605%
CONTINOUS IMPROVEMENT a = 0.845; a standardized = 0.882 CI: Continous improvement 52.668%
RESULTS/SOCIAL IMPACT a = 0.924; a standardized = 0.924 Eliminate 2 items RSI: Results/social impact 72.905%
Measurement scales reliability analysis in the case of critical factors has enabled us to verify that there is an item in the employee management scale, which shows an item-total correlation below the recommended minimum (Nurosis, 1993) 0.3, which was removed to improve Cronbach’s alpha and in the case of the social impact result scale, 2 items were removed. Af-ter editing the scales, Cronbach’s alpha coeicient takes values above 0.8 recommended by Grande and Abascal (1999), which indicates the internal consistency of all scales analyzed.
In a previous factorial analysis, we found that process management was not unidimensional, but was made up of two factors which we have identiied as processes and continu-ous improvement. We then carried out a conirmatory factori-al anfactori-alysis to conirm the existence of a single underlying con-cept. We have developed a rivals model strategy, in which we proposed a irst-order factorial model where the diferent di-mensions were not diferentiated, but where the items loaded on one only factor which is compared with a irst-order mod-el, where the critical dimensions are shown with their corre-sponding items. We conirm that the most appropriate mod-el was one in which we proposed two critical dimensions and then proposed a 2nd order model that enabled us to prove that
there were two distinct dimensions, processes and continuous improvement and that the process management construct is
not made up of two critical dimensions. In this sense, what Saraph, Benson & Schroeder (1989) stated in their research is conirmed; process management is not unidimensional, and future studies should consider that critical factor management processes should be divided into two separate constructs. Therefore, in this research, from the start, it was decided to consider two diferent constructs, process management and continuous improvement.
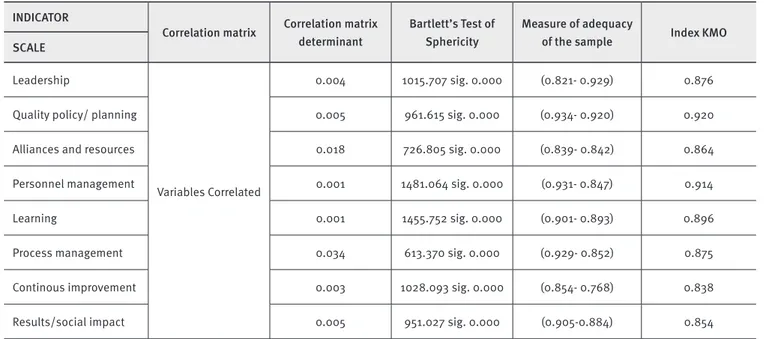
To conirm unidimensionality, we conducted an Explor-atory Factorial Analysis of principal components with varimax rotation, in order to identify the underlying dimensions in each of the constructs when dividing the variance between the difer-ent factors (Table 4). The application of the factorial analysis did not imply removing any items as shown in Table 3, in all cases the factorial loadings are above 0.5 (except 1), and factor load-ings lower than 0.3 were not considered signiicant (Hair, Ander-son, Tathaman & Black, 1999). In all scales the cumulative per-centage of variance explained exceeds 50%.
TABLE 4.
Table 4- Indicators of the degree of association between variables
INDICATOR
Correlation matrix Correlation matrix
determinant
Bartlett’s Test of Sphericity
Measure of adequacy
of the sample Index KMO
SCALE
Leadership
Variables Correlated
0.004 1015.707 sig. 0.000 (0.821- 0.929) 0.876
Quality policy/ planning 0.005 961.615 sig. 0.000 (0.934- 0.920) 0.920
Alliances and resources 0.018 726.805 sig. 0.000 (0.839- 0.842) 0.864
Personnel management 0.001 1481.064 sig. 0.000 (0.931- 0.847) 0.914
Learning 0.001 1455.752 sig. 0.000 (0.901- 0.893) 0.896
Process management 0.034 613.370 sig. 0.000 (0.929- 0.852) 0.875
Continous improvement 0.003 1028.093 sig. 0.000 (0.854- 0.768) 0.838
Results/social impact 0.005 951.027 sig. 0.000 (0.905-0.884) 0.854
Conirmatory factorial analysis - an estimate of
the measurement model
In the second phase of editing scales, we submit the factori-al solutions to vfactori-alidation by the Conirmatory Factorifactori-al Anfactori-aly- Analy-sis technique, examining the measurement model, the structur-al model and the globstructur-al model, which guarantees the vstructur-alidity and reliability of measurement scales and editing them more, if necessary.
Firstly, in this process of editing measurement scales, we have reviewed the infringed estimation, trying to identify those coeicients whose values are outside acceptable limits (Hair, Anderson, Tathaman & Black, 1999, p. 637): (1) negative or non-signiicant error variances, (2) standardized coeicients exceeding or very close to 1.0, and (3) very high standard errors associated with any estimated coeicient.
To adjust the structural measurement model, we consid-er the following indicators: (1) the t value for each standardized critical coeicient must exceed ± 1.96 and the standardized fac-torial loadings of the diferent variables must be greater than 0.05 (Steenkamp & Van Trjp, 1991), (2) the parameter R2, which
measures the individual reliability of each indicator, will take a value of 0.5 recommended by Sharma (1996). Not meeting the limits set for these indicators, will imply the removal of mea-surement scale indicators and re-estimating the model. And inally we must evaluate the global model. We determine the goodness-of-it of the model, without having a set of general-ly accepted measures when considering together the measure-ment and structural model.
To continue the analysis, we propose the following con-irmatory factorial analysis for the diferent measurement scales separately (Table 5). The criteria used to judge the appropriate-ness of removing items were Lambda estimator (>0.5) value, the corresponding “Student t-test” statistic and R2 coeicient test,
which measures each indicator’s reliability. On the other hand, every model has good absolute, incremental and parsimony it measures, as can be seen in Table 5, since all indicators have val-ues within the limits generally accepted and the probability asso-ciated c2 is above the recommended 0.05, except for the allianc-es and rallianc-esourcallianc-es scale with a very close value (c2 = 0.042).
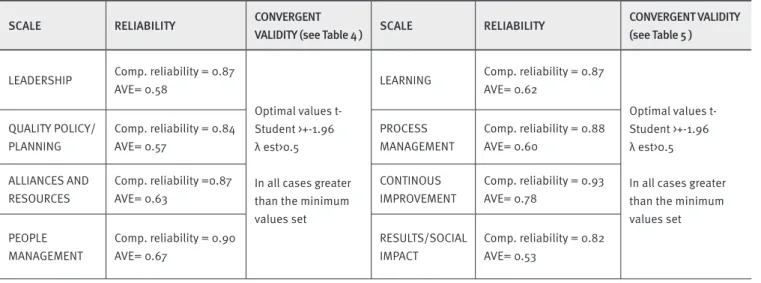
Continuing the measurement model assessment, we have inally conducted the scales reliability study, for which Composite Reliability Coeicient and Variance Extracted were considered. In the case of reliability, it should take a minimum value of 0.7, although it is not an absolute standard and there are researchers who argue that values above 0.6 are suicient (Bagozzi & Yi, 1988). In turn, the variance extracted (AVE), re-lects the total amount of indicators variance, shown by the la-tent construct, and the higher the values, the more represent-ed are the critical dimension on their loading indicators, which must be greater than 0,5 (Hair et al., 1999). In our case, both tests of reliability, as shown in Table 6, exceed in all scales, the optimum values accepted.
TABLE 5.
Results of the conirmatory factorial analysis
VARIABLE ESTIMATES T-STUDENT R2 GOODNESS FIT VARIABLE ESTIMATES T-STUDENT R2 GOODNESS FIT
LEADERSHIP LEARNING LE3 LE5 LE6 LE7 LE8 0.691 0.902 0.873 0.728 0.827 ---11.135 10.849 9.208 10.351 0.478 0.814 0.762 0.530 0.684
x2= 9.275 (P = 0.099)
GFI =0.981 AGFI = 0.944 CFI = 0.993 (x2/df) = 1.875
LA4 LA6 LA7 LA8 0.841 0.823 0.859 0.882 ---13.387 14.292 14.847 0.707 0.677 0.738 0.779
x2= 2.554 (P = 0.279)
GFI =0.993 AGFI = 0.965 CFI = 0.999 (x2/df) = 1.277
QUALITY POLICY/ PLANNING PROCESS MANAGEMENT
PO1 PO3 PO4 PO5 PO6 PO7 0.787 0.746 0.641 0.823 0.914 0.863 ---10.955 9.134 12.425 14.239 13.232 0.620 0.556 0.412 0.677 0.836 0.745
x2= 11.862 (P = 0.221)
GFI = 0.978 AGFI = 0.948 CFI = 0.996 (x2/df) = 1.318
PG1 PG2 PG3 PG4 PG5 0.716 0.858 0.864 0.791 0.647 ---10.973 11.036 10.171 8.344 0.512 0.737 0.747 0.625 0.518
x2= 5.257 (P = 0.385)
GFI = 0.989 AGFI = 0.967 CFI = 0.999 (x2/df) = 1.051
ALLIANCES AND RESOURCES CONTINUOUS IMPROVEMENT
AL4 AL5 AL6 AL7 0.623 0.820 0.920 0.878 ---9.002 9.628 9.417 0.388 0.672 0.846 0.771
c2= 6.332 (P = 0.042) GFI = 0.984
AGFI = 0.921 CFI = 0.990 (c2/df) = 3.166
CI12 CI13 CI14 CI15 0.586 0.796 0.961 0.965 ---8.463 9.423 9.435 0.344 0.634 0.924 0.931
x2= 2.521 (P = 0.284)
GFI = 0.993 AGFI = 0.966 CFI = 0.999 (x2/df) = 1.260
PERSONNEL MANAGEMENT RESULTS/SOCIAL IMPACT
PM1 PM2 PM5 PM6 PM7 PM10 0.825 0.785 0.824 0.901 0.875 0.660 ---12.443 13.365 15.325 14.657 9.838 0.681 0.619 0.679 0.811 0.766 0.436
x2= 14.613 (P = 0.102)
GFI = 0.973 AGFI = 0.938 CFI = 0.993 (x2/df) = 1.624
RSI3 RSI6 RSI7 RSI8 0.672 0.993 0.928 0.719 ---11.846 11.523 9.4221 0.452 0.985 0.862 0.515
x2= 3.732 (P = 0.155)
GFI = 0.990 AGFI = 0.952 CFI = 0.997 (x2/df) = 1.866
TABLE 6.
Analysis of reliability and validity of scales
SCALE RELIABILITY CONVERGENT
VALIDITY (see Table 4 ) SCALE RELIABILITY
CONVERGENT VALIDITY (see Table 5 )
LEADERSHIP Comp. reliability = 0.87 AVE= 0.58
Optimal values t- Student >+-1.96 λ est>0.5
In all cases greater than the minimum values set
LEARNING Comp. reliability = 0.87 AVE= 0.62
Optimal values t- Student >+-1.96 λ est>0.5
In all cases greater than the minimum values set QUALITY POLICY/
PLANNING
Comp. reliability = 0.84 AVE= 0.57
PROCESS MANAGEMENT
Comp. reliability = 0.88 AVE= 0.60
ALLIANCES AND RESOURCES
Comp. reliability =0.87 AVE= 0.63
CONTINOUS IMPROVEMENT
Comp. reliability = 0.93 AVE= 0.78
PEOPLE MANAGEMENT
Comp. reliability = 0.90 AVE= 0.67
RESULTS/SOCIAL IMPACT
Causal model estimation and analysis of results
In this last phase of the analysis, the aim is to estimate the glob-al model in order to contrast the diferent hypotheses, based on the theory. We contrasted the relationship between the latent variables to see how the critical factors afect the results in so-ciety, that is, to see if in fact, continuous improvement and pro-cess management can be considered antecedents of social im-pact. We also want to test whether leadership has an inluence through alliances and resources, quality policy/planning, em-ployee management and learning on the antecedents of social impact, and therefore afect the results.
To estimate the global latent model, we have used the structural equation model, and more speciically the Conirma-tory Factorial Analysis, considering the models previously ob-tained as a result of the editing scale. We opted for the strategy development model, where we propose an initial model (Figure 1) based on the theory and which we aim to support empirically. With this strategy of analysis, if the proposed model is not well adjusted to the data, it is successively modiied until it reaches a good adjustment.
The estimation technique applied is the maximum likeli-hood method, using the bootstrapping process with 200 sam-ples, choosing the aggregation of all the diferent items of the diferent observable variables into a single one, which we did by
calculating the average of items measuring each latent variable, representing each critical dimension or latent variable by that average. As a preliminary step, we have tested the scale uni-dimensionality, an indispensable condition for this procedure to be correct (Anderson & Gerbing, 1988; Baumgartner & Hom-burg, 1996).
Luque (2000) recommends paying attention to the es-timated structural model, regardless of the global adjustment measures indicating acceptable values. So, the irst thing to evaluate is the signiicance attained by the estimated coei-cients, so that the parameter estimates are statistically difer-ent from zero, ie, for a signiicance level equal to 0.05, the value of “t” must reach 1.96. If a parameter does not reach that level, it means that the relationship does not have a substantial efect and should be eliminated and the model reformulated.
Three of the relationships proposed in the model have a signiicance level below the required minimum of + -1.96: H8 “alliances_resources “process management” (T-Student = 1.084), H11 “policy planning “ continuous improvement” (T-stu-dent = 1.219), H15 “learning “continuous improvement” (T-Stu-dent = -0.950). After removal of non-contrasted causal relation-ships, we proceed to the re-speciication of the model. Final structural model results conirm the proposed relationships, being the standardized critical coeicient loadings, in all cases signiicant (Figure 2).
Figure 2.
Final structural diagram model
Alliances Resources
Policy Planning
Personnel Management
Process management
Continuos improvement
Social impact Leadership
Learning H1
H2
H3 H4
H5
H6
H7
H9
H10
H12
H13
H14
H15 H19
H17(3) 0.215***
R2=0.638 R2=0.697
1
1
1 1
1
1
1 1
e7
e5 e1
e3
e2
e6
e8
e4
|2 = 19.493 (p=0.417) RMSEA = 0.046 GFI = 0.974 CFI = 0.995 AGFI = 0.934 NFI = 0.983 |2/DF = 1.392
R2=0.138 R2=0.527
R2=0.660 R2=0.597
R2=0.579 0.604*** 0.275***
0.369*** 0.773***
0.206**
0.570***
0.227**
0.371*** 0.439***
0.255**
0.266*** 0.679***
0.175**
The results of the inal structural model conirm the pro-posed relationships, being the critical coeicients of the stan-dardized loadings in all cases signiicant. The R2 measure, that
indicates the amount of variance of the construct, which is ex-plained by the model, ie, provides useful information to evalu-ate, to what degree, the model latent variables are explained by their corresponding predictors, in the case of the structural model, shown in Figure 2, and can be regarded as acceptable.
Thus, the model has the ability to explain social impact results by using the direct efect of process management plus
the indirect efect of other critical factors speciied in the model. The probability associated with c2 is 0.149, exceeding the
rec-ommended 0.05 along with the goodness-of-it indexes, makes us consider the model as appropriate, as they are within the rec-ommended levels (Figure 2).
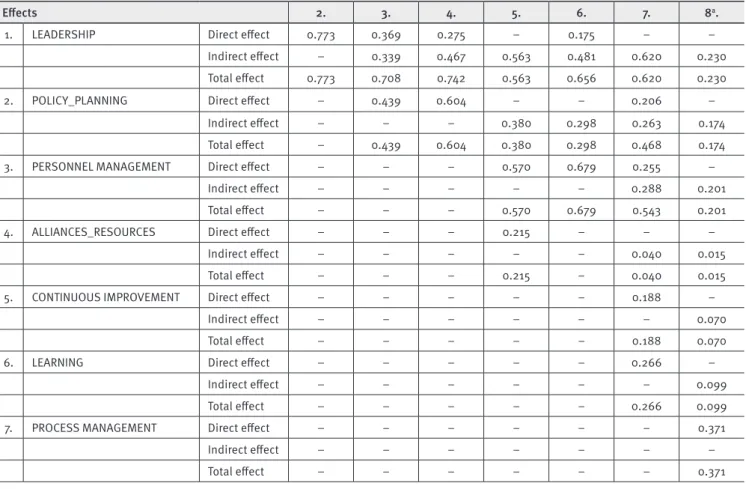
In order to examine more in-depth the efects of the vari-ables included in the model, we have taken into account the di-rect, indirect and total efects of critical factors on the variable results/social impact (Table 7).
TABLE 7.
Efect on endogenous variables
Efects 2. 3. 4. 5. 6. 7. 8a.
1. LEADERSHIP Direct efect 0.773 0.369 0.275 – 0.175 – –
Indirect efect – 0.339 0.467 0.563 0.481 0.620 0.230
Total efect 0.773 0.708 0.742 0.563 0.656 0.620 0.230
2. POLICY_PLANNING Direct efect – 0.439 0.604 – – 0.206 –
Indirect efect – – – 0.380 0.298 0.263 0.174
Total efect – 0.439 0.604 0.380 0.298 0.468 0.174
3. PERSONNEL MANAGEMENT Direct efect – – – 0.570 0.679 0.255 –
Indirect efect – – – – – 0.288 0.201
Total efect – – – 0.570 0.679 0.543 0.201
4. ALLIANCES_RESOURCES Direct efect – – – 0.215 – – –
Indirect efect – – – – – 0.040 0.015
Total efect – – – 0.215 – 0.040 0.015
5. CONTINUOUS IMPROVEMENT Direct efect – – – – – 0.188 –
Indirect efect – – – – – – 0.070
Total efect – – – – – 0.188 0.070
6. LEARNING Direct efect – – – – – 0.266 –
Indirect efect – – – – – – 0.099
Total efect – – – – – 0.266 0.099
7. PROCESS MANAGEMENT Direct efect – – – – – – 0.371
Indirect efect – – – – – – –
Total efect – – – – – – 0.371
a Results/Social Impact
The data in this table show that process management is the only variable with direct efect on the social impact results. The greatest indirect efect on social impact results comes from leadership, produced through multiple channels of inluence (alliances and resources, quality policy and planning, employee management, learning and management processes).
In summary, the critical factors that inluence social im-pact results are management processes along with leadership (lest=0.371 y lest=0.230 total efect), both very weak efects which makes us assume that there are missing explanatory vari-ables in the social impact results model.
CONCLUSIONS, LIMITATIONS AND
FUTURE LINES OF RESEARCH
manage-ment (Curkovic, 2003), require ethical behaviour(McAdam & Leonard, 2003), need a stakeholder focus (Waddock and Bod-well, 2004), and may facilitate the development of activities that are socially responsible (Withanachchi, Handa, Karandagoda, Pathirage, Tennakoon & Pullaperuma, 2007)”.
The data show the importance of the top management leadership factor in achieving social impact results, while this fac-tor is directly related to alliances and resources, quality policy/ planning, employee management and learning. Thus, leadership drives the Total Quality Management process, a claim which is supported by this variable efect on the rest of the critical factors taken into account. These relationships have been conirmed in other studies carried out in diferent sectors of tourism and based on diferent models of Total Quality implementation, like the work of Ahire, Waller & Golhar (1996), Winn and Cameron (1998), Es-kildsen and Dahlgaard (2000), or Wilson and Collier (2000), Cal-vo-Mora, Leal, and Roldán (2005), Carmona, Rivas, and Martín (2010), Heras, Marimon, and Casadesús (2012). In turn, the larg-est indirect efect on customer results comes from leadership.
Process management is directly inluenced by three vari-ables which are employee management, quality policy/plan-ning and learpolicy/plan-ning, and in turn acts directly on the social impact results and is indirectly inluenced by alliances and resources through continuous improvement. Therefore, the relationship between policy and planning with managing people and re-sources is conirmed, which was also conirmed by Ahire,Waller and Golhar (1996), Eskildsen and Dahlgaard (2000), Wilson and Collier (2000), Calvo-Mora, Leal, and Roldán (2005), Carmona, Rivas, and Martín (2010).
In the structural model proposed it can be observed that personnel management is a key factor, due to its inluence on process management and continuous improvement. These re-sults partially corroborate those obtained by Tarí, Molina, and Castejón (2007) which did ind a relationship between person-nel management and process management, but not with contin-uous improvement, establishing an indirect link through learn-ing and process management.
In summary, the critical factors with greatest inluence on social impact results are process management along with lead-ership, both very weak efects, which makes us assume that there are missing explanatory variables in the social impact re-sults model, as this can only be explained by 13.8% of the criti-cal factors that we have included in the model.
Thus, the model has low explanatory power for the re-sults in society into the context analyzed (tourist accommoda-tion sector), and puts in evidence that there are external factors which inluence those results and that it would be of great inter-est to invinter-estigate (Carmona, Rivas & Martín, 2010).
In the work done by Tarí and García (2011, p.80), one of the few studies that relate the quality and social responsibil-ity; the review of the literature suggests that “there are par-allels between the two, what justiies a mutually supportive; companies with quality systems can more easily adopt envi-ronmental aspects (Corbett & Kirsch, 2001; Marimon, Heras & Casadesús, 2009.), ethical (Ahmed & Machold, 2004) and so-cial (McAdam & Leonard, 2003; Withanachchi et al., 2007); the practices of quality management help develop elements of so-cial responsibility.”
We believe that the model low predictive power, con-sidering the evidence provided by the literature which claims that critical implementation factors of quality can facilitate the development of social responsibility practices (Tarí & García, 2011), is due to the low involvement of leadership in the development of a culture of social responsibility for the organization. In this sense, the main implication for the man-agement of tourist accommodation businesses is that would be recommended is that the leadership of top management in addition to promoting a culture of quality (development of quality management practices), would show a greater com-mitment of social responsibility dimensions (environmental, social and ethical) focusing its efforts on the development and promotion of a socially responsible culture within the or-ganization.
The irst limitation of this research is derived from the reali-zation of the study and the speciic characteristics of the analyzed subsector “tourist accommodation”. The generalization of its con-clusions must be analyzed with caution and always from a previous analysis of the characteristics of the sector to be studied.
On the other hand, the data were obtained from per-ceptions of quality managers, which implies the risk of re-ceiving biased responses by the person involved, and there-fore interested in the processes which are to be assessed, as objectively as possible. Therefore, we thought it would important to perform the same study taking into account, not only the response of the person responsible for qual-ity but also of the different human resources belonging to the company, which would provide different viewpoints. A third limitation is related to the cross section thereof, as this paper has analyzed the relationship in a specific mo-ment in time.
REFERENCES
Adam, E. E., Corbett, L. M., Flores, B. E., Harrison, N. J., Lee, T.S., Rho, B.H. & Westbrook, R. (1997). An international study of quality improve-ment approach and irm performance. International Journal of Opera-tions and Production Management, 17(9), 842-873.
Ahire, L. S., Waller, M. A., & Golhar, D.Y. (1996). Quality management in TQM versus non-TQM irms: an empirical investigation. International Journal of Quality and Reliability Management, 13(8), 8-27.
Ahmad, S. & Schroeder, G. (2002). The importance of recruitment and selection process for sustainability of total quality management. Inter-national Journal of Quality and Reliability Management, 19(5), 540-550.
Ahmed, P. K. & Machold, S. (2004). The quality and ethics connection: toward virtuous organizations. Total Quality Management & Business Excellence, 15(4), 527-545.
Anderson, J. C. & Gerbing, D. W. (1998). Structural equation modeling in practice: a review and recommended two-step approach. Psychological Bulletin, 103(3), 411-423.
Anderson, J., Rungtusanatham, M., & Schroeder, R. G. (1994). A Theory of Quality Management underlying the Deming Management Method. Academy of Management Review, 19(3), 472-509.
Bagozzi, R. P. & Yi, Y. (1988). On the evaluation of structural equation models. Journal of the Academy of Marketing Science, 16(1), 74-94.
Baumgartner, H. & Homburg, C. H. (1996). Applications of structural equation modeling in marketing and consumer research: a review. In-ternational Journal of Research in Marketing, 13(2), 139-161.
Black, S. A. & Porter, L. J. (1996). Identiication of the critical factors of TQM. Decision Sciences, 27(1), 1-21.
Boje, D.M. & Winsor, R. D. (1993). The resurrection of Taylorism: to-tal quality management’s hidden agenda. Journal of Organizational Change Management, 6(4), 57-70.
Bou-Llusar, J. C., Escrig-Tena, A. B., Roca-Puig, V., & Beltrán-Martín, I. (2009). An empirical assessment of the EFQM excellence model: evalu-ation as a TQM framework relative to the MBNQA model. Journal of Op-erations Management, 27(1), 1-22.
Calvo-Mora, A., Leal, A. G., & Roldán, J. L. (2005). Relationships between the EFQM model criteria: a study in Spanish universities. Total Quality Management & Business Excellence, 16(6), 741-770.
Camisón, C., Cruz, S., & González, T. (2007). Gestión de la calidad: con-ceptos, enfoques y sistemas. Madrid: Pearson – Prentice Hall.
Carmona, M., Rivas, M. Á. & Martín, E. (2010). Análisis de las relaciones intravariables del modelo EFQM mediante Modelos de Ecuaciones Estructurales. In 4th International Conference On Industrial Engineering and Industrial Management (pp. 96-106).
Carroll, A. B. & K. M. Shabana. (2010). The business case for corporate social responsibility: a review of concepts, research and practice. Inter-national Journal of Management Reviews, 12(1), 85-105.
Casadesus, M., Marimon, F., & Alonso, M. (2010). The future of stan-dardised quality management in tourism: evidence from the Spanish tourist sector. The Service Industries Journal, 30(14), 2457-2474.
Claver, E., Tarí, J.J. & Molina, J.F. (2003). Critical factors and results of quality management: an empirical study. Total Quality Management and Business Excellence, 14(1), 91-118.
Conca, F.J., Llopis, J., & Tarí, J. J. (2004). Development of a measure to assess quality management in certiied irms. European Journal of Oper-ational Research, 156(3), 683-697.
Corbett, C. & Kirsch, D. (2001). International difusion of ISO 14000 certi-ication. Production and Operations Management, 10(3), 327-342.
Curkovic, S. (2003). Environmentally responsible manufacturing: the de-velopment and validation of a measurement model. European Journal of Operational Research, 146(1), 130-155.
Curkovic, S., Melnyk, S, Calantone, R. & Handield R. (2000). Validating the Malcolm Baldrige National Quality Award framework through struc-tural equation modelling. International Journal of Production Research, 38(4), 765-791.
Criado, F. & Calvo-Mora, A. (2009). Excellence proiles in Spanish irms with quality management systems. Total Quality Management & Busi-ness Excellence, 20(6), 655-679.
EFQM. (1999). EFQM Model for Business Excellence: Company Guide-lines. European Foundation for Quality Management, Bruselas.
EFQM mediante Modelos de Ecuaciones Estructurales. (2010). 4th Inter-national Conference on Industrial Engineering and Industrial Manage-ment, XIV Congreso Ingeniería de Organización (CIO), 8–10 September, San Sebastian, Spain.
Eskildsen, J. K. & Dahlgaard, J. J. (2000). A casual model for employee satisfaction. Total Quality Management, 11(8), 1081-1094.
Eskildsen, J. K., Kristensen, K., & Juhl, H. J. (2002). Trends in EFQM cri-terion weights: the case of Denmark 1998-2001. Measurement Business Excellence, 6(2), 22-28.
Fotopoulos, C.V. & Psomas, E. L. (2010). The structural relationships be-tween TQM factors and organizational performance. The TQM Journal, 22(5), 539-552.
Ghobadian, A. & Gallear, D. N. (1996). Total quality management in SMEs. Omega. The International Journal of Management Science, 24(1), 83-106.
Gómez, J., Martínez, M. and Martínez, A.R. (2011). A critical evaluation of the EFQM model. International Journal of Quality & Reliability Manage-ment, 28(5), 484-502.
Grande, I. & Abascal, E. (2000). Fundamentos y Técnicas de Investi-gación Comercial. 5ª edición, Madrid: ESIC Editorial.
Grandzol, J. R. & Gershon, M. (1998). A survey instrument for standard-izing TQM modeling research. International Journal of Quality Science, 3(1), 80-105.
Hackman, J. R. Wageman, R. (1995). & Total quality management: empir-ical, conceptual, and practical issues. Administrative Science Quarterly, 40(2), 309-342.
Hair, J., Anderson, R., Tathaman, R. & Black, W. (1999). Análisis Multivar-iante. 5ª edicción, Madrid: Prentice Hall.
Harrington, D. & Akehurst, G. (2000). An empirical study of service qual-ity implementation. The Service Industries Journal, 20(2), 133-156.
Heras, I., Marimon, F., & Casadesús, M. (2012). An empirical study of the relationships within the categories of the EFQM Model. Total Quality Mangement, 23(5-6), 523-540.
Jimenez-Jimenez, D. & Martinez-Costa, M. (2009). The performance ef-fect of HRM and TQM: a study in Spanish organizations. International Journal of Operations & Production Management, 29(12), 1266-1289.
Kanji, G. K. (1998). Measurement of business excellence. Total Quality Management, 9(7), 633-643.
Kristensen, K., Juhl, H. J., & Eskildsen, J. (2001). Benchmarking excel-lence. Measuring Business Excellence, 5(1), 19-24.
Luque, T. (2000). Técnicas de Análisis de Datos e Investigación de Mer-cados. Madrid: Ediciones Piramide, Madrid.
Marimon, F., Heras I., & Casadesús, M. (2009). ISO 9000 and ISO 14000 standards: a projection model for the decline phase. Total Quality Man-agement & Business Excellence, 20(1), 1-21.
McAdam, R. & Leonard D. (2003). Corporate social responsibility in a total quality management context: opportunities for sustainable growth. Corporate Governance, 3(4), 36-45.
Mann, R. & Kehoe, D. (1994). An evaluation of the efects of quality im-provement activities on business performance. International Journal of Quality & Reliability Management, 11(4), 29-44.
Nabitz, U.W., Severens, P., Van Der Vrink, W. & Cansen, P. (2001). Improv-ing the EFQM Model: an empirical study on model development and the-ory building on model defelopment and thethe-ory building using concept mapping. Total Quality Management, 12(12), 69-81.
Nurosis, M. J. (1993). SPSS. Statistical Data Análisis. SPSS Inc.
Osseo-Asare, A. E. & Longbottom, D. (2002). The need for education and training in the use of the EFQM model for quality management in UK higher education institutions. Quality Assurance in Education, 10(1), 26-36.
Porter, L. J. & Parker, A. J. (1993). Total quality management - the critical success factors. Total Quality Management, 4(1), 13-22.
Quazi, H. A., Jemangin, J., Kit, L.W., & Kian, C. L. (1998). Critical factors in quality management and guidelines or self-assessment: the case of Singapore. Total Quality Management, 9(1), 35-55.
Ravichandran, T. & Rai. A. (2000). Total quality management in informa-tion systems development: key constructs and relainforma-tionships. Journal of Management in Information Systems, 16(3), 119-155.
Reiner, G. (2002). Analysis of critical factors of company success based on the EFQM excellence model. Proceedings of the 7th World Congress for Total Quality Management, Verona (Italy), 2, pp. 361-366.
Ritchie, L. & Dale, B. G. (2000). Self-assessment using the business ex-cellence model: a study of practice and process. International Journal of Production Economics, 66(3), 241-254.
Samson, D. & Terziovski, M. (1999). The relationship between total qual-ity management practices and operational performance. Journal of Op-erations Management, 17(4), 393-409.
Saraph, J., Benson, G., & Schroeder, R. (1989). An instrument for mea-suring the critical factors of quality management. Decision Sciences, 20(4), 810-829.
Sharma, S. (1996). Applied Multivariate Techniques. New York: Ed. John Wiley & Sons.
Selles, M. E. & Trigueros-Pina, J. A. (2008). Management and measure-ment of quality in ISO 9000 organisations: an empirical study in Spain. Total Quality Management & Business Excellence, 19(5), 481-492.
Spector, B. & Beer, M. (1994). Beyond TQM programmes. Journal of Or-ganizational Change Management, 7(2), 63-70.
Steenkamp, J. B. & Van Trjp, H. C. M. (1991). The use of LISREL in vali-dating marketing constructs. International Journal of Research in Mar-keting, 8(4), 283-299.
Tarí, J. J. (2011). Research into quality management and social responsi-bility. Journal of Business Ethics, 102(4), 623-638.
Tarí, J. J. & García, M. (2011). La gestión de la calidad y la responsabil-idad social en empresas de servicios. Revista de Dirección y Adminis-tración de Empresas, 18, 77-93.
Tarí, J. J., Molina, J. F., & Castejón, J. L. (2007). The relationship between quality management practices and their efects on quality outcomes. European Journal of Operational Research, 183(2), 483-501.
Taylor, W. A. & Wright, G. H. (2003). A longitudinal study of TQM imple-mentation: factors inluencing success and failure. Omega, 31(2), 97-111.
Tutuncu, O. & Kucukusta, D. (2007). Relationship between organization-al commitment and EFQM business excellence model: a study on Turkish quality award winners. Total Quality Management, 18(10), 1083-1096.
Valmohammadi, C. (2011). The impact of TQM implementation on the organizational performance of Iranian manufacturing SMEs. The TQM Journal, 23(5), 496-509.
Waldman, D. A. (1994). The contributions of total quality management to a theory of work performance. Academy of Management Review, 19(3), 510-536.
Ward, B. & Chandler, W. D. (1999). Applying quality management con-cepts to managing business scholls. SAM Advance Management Jour-nal, Autumn, 64, 21-24.
Westlund, A. H. (2001). Measuring environmental impact on society in the EFQM system. Total Quality Management, 12(1), 125-135.
Wilson, D. D. & Collier, D. A. (2000). An empirical investigation of the Malcolm Baldrige National Quality Award Casual Model. Decision Sci-ences, 31(2), 361-383.
Winn, B. A. & Cameron, K. S. (1998). Organizational quality: an exam-ination of the Malcolm Baldrige National Quality Award causal model. Decision Sciences, 39(5), 491-512.
Withanachchi, N., Handa, K., Karandagoda, P., Pathirage, N., Tennakoon C., & Pullaperuma, D. (2007). TQM emphasizing 5-S principles: a break-through for chronic managerial constraints at public hospitals in devel-oping countries. International Journal of Public Sector Management, 20(3), 168-177.
Yusof, S. M. & Aspinwall, E. (1999). Critical success factors for total qual-ity management implementation in small and medium enterprises. Total Quality Management, 17(2), 221-231.