NURSING WORKLOAD AND PATIENT MORTALITY AT AN INTENSIVE
CARE UNIT
Aline Nassiff1, Thamiris Ricci de Araújo2, Mayra Gonçalves Menegueti3, Fernando Bellissimo-Rodrigues4, Anibal Basile-Filho5, Ana Maria Laus6
1 Master’s Student, College of Nursing (EERP). University of São Paulo at Ribeirão Preto. Ribeirão Preto, São Paulo, Brazil. E-mail: aline.nassiff@usp.br
2 Doctor Student, EERP/USP. Ribeirão Preto, São Paulo, Brazil. E-mail: thamirisricci@usp.br 3 Ph.D. in Science. EERP/USP. Ribeirão Preto, São Paulo, Brazil. E-mail: mayramenegueti@usp.br
4 Ph.D. in Clinical Medice. Professor, Department of Social Medicine. Ribeirão Preto Medical School (FMRP), USP. Ribeirão Preto, São Paulo, Brazil. E-mail: fbellissimo@fmrp.usp.br
5 Ph.D. in Surgery Sciences. Professor, Department of Surgery and Anatomy. FMRP/USP. Ribeirão Preto, São Paulo, Brazil. E-mail: abasile@fmrp.usp.br
6 Ph.D. in Fundamental Nursing. Professor, Department of General and Specialized Nursing. EERP/USP. Ribeirão Preto, São Paulo, Brazil. E-mail. analaus@eerp.usp.br
ABSTRACT
Objective: to verify if the nursing workload is a predictor of mortality at an Intensive Care Unit.
Method: cross-sectional and retrospective documentary study, developed at the Intensive Care Unit of a tertiary university hospital. The Receiver Operator Characteristic Curve was used, consisting of the Nursing Activities Score and the APACHE severity score, using logistic regression to analyze the prediction of mortality.
Results: the sample included 324 patients, 214 (66%) of whom survived. The mean Nursing Activities Score during the first 24 hours of
hospitalization was 79.3 points, ranging from 34.8 to 134.2 points, and the median APACHE II was 24.5 (2-42). In the analysis of the Receiver Operator Characteristic Curve, the Nursing Activities Score evidenced an area under the curve corresponding to 0.626; CI between 0.570 and 0.678 and an APACHE II score of 0.721, with a 95% confidence interval from 0.669 to 0.769.
Conclusion: the nursing workload did not serve as a mortality predictor at the Intensive Care Unit, as the patients who demand the main nursing workload are not necessarily the patients who evolve to death.
DESCRIPTORS: Workload. Nursing staff. Intensive Care Units. Mortality. Severity of illness index.
CARGA DE TRABALHO DE ENFERMAGEM E MORTALIDADE DOS
PACIENTES EM UNIDADE DE TERAPIA INTENSIVA
RESUMO
Objetivo: verificar se a carga de trabalho de enfermagem é um preditor de mortalidade em Unidade de Terapia Intensiva.
Método: estudo documental, retrospectivo, corte transversal, desenvolvido na Unidade de Terapia Intensiva de um hospital universitário terciário. Utilizou-se a curva Receiver Operator Characteristic Curve composta pelo Nursing Activities Score e índice de gravidade APACHE e regressão logística para análise da predição de mortalidade.
Resultados: compuseram a amostra 324 pacientes, sendo 214 (66%) sobreviventes. A média Nursing Activities Score das primeiras 24 horas de internação foi de 79,3 pontos, variando de 34,8 a 134,2 pontos e o APACHE II mediano foi 24,5 (2-42). Na análise da curva Receiver Operator Characteristic Curve o Nursing Activities Score evidenciou uma área sobre a curva de 0,626; IC 0,570 a 0,678 e o APACHE II de 0,721 com intervalo de confiança IC 95% de 0,669 a 0,769.
Conclusão: a carga de trabalho de enfermagem não foi um preditor de mortalidade em Unidade de Terapia Intensiva, pois os pacientes que demandam a maior carga de trabalho de enfermagem não necessariamente são aqueles que evoluem para o óbito.
DESCRITORES: Carga de trabalho. Recursos humanos de enfermagem. Unidades de Terapia Intensiva. Mortalidade. Índice de gravidade de doença.
CARGA DE TRABAJO DE ENFERMERÍA Y LA MORTALIDAD DE LOS
PACIENTES EN UNIDAD DE TERAPIA INTENSIVA
RESUMEN
Objetivo: verificar si la carga de trabajo de enfermería es um como predictor de mortalidad en Unidad de Terapia Intensiva.
Método: estudio documental, retrospectivo, corte transversal, desarrollado en la Unidad de Terapia Intensiva de un hospital universitario terciario. Se utilizó la curva Receiver Operator Characteristic Curve compuesta por el Nursing Activity Score y índice de gravedad APACHE y regresión logística para análisis de la predicción de mortalidad.
Resultados: compusieron la muestra 324 pacientes, siendo 214 (66%) sobrevivientes. El promedio Nursing Activities Score de las primeras 24 horas de internación fue de 79,3 puntos, variando de 34,8 a 134,2 puntos y el APACHE II mediano fue de 24,5 (2-42). En el análisis de la curva Receiver Operator Characteristic Curve o Nursing Activities Score evidenció un área sobre la curva de 0,626; IC 0,570 a 0,678 y el APACHE II de 0,721 con intervalo de confianza IC 95% de 0,669 a 0,769.
Conclusión: la carga de trabajo de enfermería no fue un predictor de mortalidad en Unidad de Terapia Intensiva, pues los pacientes que demandan la mayor carga de trabajo de enfermería no necesariamente son aquellos que evolucionan a muerte
DESCRIPTORES: Carga de trabajo. Personal de enfermería. Unidades de cuidados intensivos. Mortalidad. Índice de severidad de la
enfermedad.
INTRODUCTION
The performance assessment of Intensive Care Units (ICU) based on parameters related to the nurs-ing workload and quantitative severity prognoses
permits optimizing financial resources and offers
support for the allocation of human resources in these services, thus prioritizing the quality and safety of care.1
The nursing workload consists of all activities that are direct or indirectly performed in patient care, with direct interference from the patient’s degree of dependency.2 One of the measures is the Nursing
Activities Score (NAS), a classification system that
has been translated and validated for the Brazilian reality. This tool has demonstrated satisfactory reli-ability, criterion and construct validity to measure
the nursing workload at ICU and to justify the need
for additional staff in case of increased workload.3-4 Likewise, evaluating the severity of the disease permits not only analyzing the patients’ clinical conditions and their prognosis, but also guiding and analyzing the impact of the new therapeutic inter-ventions. Among the main prognostic score systems in ICUs, the Acute Physiology and Chronic Health Evaluation (APACHE) stands out which, although more complex, is more precise when compared to the other instruments.5
The literature does not present solid evi-dence that more severe patients demand a higher workload, but it is observed that, in patients who presented a higher NAS, the mortality rate was also higher, demonstrating these indices.6-7
Corroborating these data, a study indicates that patients who evolved to death and stayed at the ICU more than six days required more hours of
nursing care when compared to the survivors and patients who spent less time at the ICU.8
Research conducted at a cardiology ICU dem-onstrated a weak correlation between workload and
the Simplified Acute Physiology Score II (SAPS)
and Logistic Organ Dysfunction System (LODS) and their respective mortality risks, and it can be
affirmed that they did not influence the care length.9 In this context, the research hypothesis can be raised that the workload, although intended to quantify the nursing care hours needed, when exhaustive, can also serve as a mortality predictor.
That assumption guided this research, aiming to verify if the nursing workload is a predictor of mortality in the Intensive Care Unit.
METHOD
This is a cross-sectional and retrospective documentary study. The study was developed in the ICU of a tertiary university hospital.
The exclusive focus of the ICU is care for adult patients from different medical specialties. It offers nine beds for clinical and surgical patients. The nursing team consists of 14 nurses, 18 technicians and 29 nursing assistants with a weekly workload of 30 hours, and the uninterrupted work is organized so that each professional is responsible for all care.
The eligible population consisted of adult patients admitted to the ICU in 2014, aged 18 years or older, regardless of gender, type of treatment or diagnosis, and with at least 24 hours of hospitaliza-tion in the unit, and readmissions were excluded.
clinical/demographic characteristics and workload - NAS were collected from the database extracted from the reports of the Institution’s Information and Analysis Center and registered in a script developed by the authors.
The nurses apply the NAS index daily to all patients, during the period of hospitalization, and later registered in the institution’s electronic system.
The data used were NAS values for the first 24 hours
of hospitalization.
To conduct the study, we chose to use a sever-ity index as a parameter of comparison to the result obtained by the NAS analysis. Thus, the severity of
the patients included in the study was identified by
calculating APACHE II, using clinical and
labora-tory data for the first day of hospitalization of each
patient, being a score commonly used in ICU.10 The data ordered and stored in spreadsheets developed in Microsoft® Excel 2010 were analyzed using descriptive statistics and the ROC - Receiver Operator Characteristic Curve,11 using Stata (version 14 for Windows®) to determine the ability of NAS and APACHE to predict mortality.
In addition, a logistic regression model was developed, with mortality as the dependent
vari-able. The nursing workload was included in the final
model, as well as other variables associated with mortality in the univariate analysis with p-values inferior to 0.20.
The project received approval from the
Research Ethics Committee under protocol 51458615.3.0000.5393, with exemption from the Informed Consent Form.
RESULTS
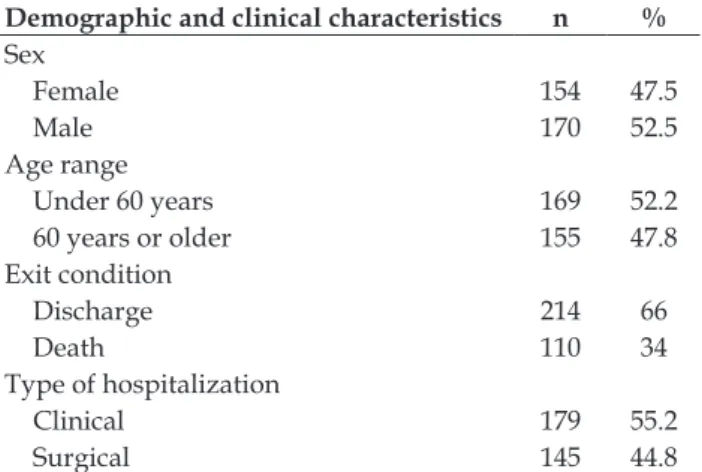
In total, 324 patients were included in the study, whose demographic and clinical character-istics have been described in table 1.
The mean age found at the ICU was 56.9 years, standard deviation 16.19 years, median 59 years, and minimum and maximum ages of 19 and 89 years, respectively.
Regarding the origin, 49.7% ( =161) of the pa-tients came from the ward, 15.4% (n=50) from the surgical center, 14.5% (n=47) from other hospitals, 10.9 % (n=35) from the recovery unit, 8% (n=26) from outpatient clinics at the hospital where the study was conducted and 1.5% (n=5) from the ob-stetric center. The mean length of stay was 8.02 days
(standard deviation 10.45 days), median five days,
with a minimum of one and a maximum of 87 days.
Table 1 – Distribution of patients hospitalized at the Intensive Care Unit according to demographic and clinical characteristics. Ribeirão Preto, SP, Brazil, 2014. (n=324)
Demographic and clinical characteristics n %
Sex
Female 154 47.5
Male 170 52.5
Age range
Under 60 years 169 52.2
60 years or older 155 47.8
Exit condition
Discharge 214 66
Death 110 34
Type of hospitalization
Clinical 179 55.2
Surgical 145 44.8
Among the causes of hospitalization, sepsis was observed in 43.8% (n=142) of the patients, fol-lowed by patients hospitalized in the immediate postoperative period for ventilatory support and intensive nursing care, representing 20.7% % (n=67). Patients hospitalized for hemodynamic monitoring were also included, corresponding to 20.7% (n=67), as in cases of arrhythmias and outpatient proce-dures, while patients hospitalized for pulmonary respiratory failure accounted for 8.6% (n=28) and patients after cardiopulmonary arrest 6.2% (n = 20).
The mean NAS for the first 24 hours of hospi -talization was 79.3, standard deviation 16.7, median 80.55 points (34.8-134.2). For the surviving patients, it was 76.5 and, for non-survivors, 84.6 points.
In order to measure the predictive capacity of the selected variables NAS and APACHE II in
rela-tion to patient mortality, in figure 1, the ROC curve
of the indices used in the sample of ICU patients studied is displayed.
For the NAS, the area above the curve was
0.626, with a 95% confidence interval (CI) from 0.570
Figure 1 – Receiver Operator Characteristic Curve (ROC Curve) – Nursing Activities Score (NAS) and Acute Physiology and Chronic Health Evaluation (APACHE II) of Intensive Care Unit. Ribeirão Preto, SP, Brazil, 2015
The variables that were associated with patient mortality in the univariate analysis are presented in
table 2. This analysis identified that the variables
that were associated with mortality were: length of hospital stay prior to the intensive care unit, diag-nosis of sepsis, NAS and APACHE II.
Table 2 – Univariate analysis of independent variables related to dependent variable (mortality). Ribeirão Preto, SP, Brazil, 2015
Variable p value
Sex 0.52
Age 0.45
Type of patient 0.052
Length of hospitalization at intensive care unit 0.63 Length of hospitalization prior to intensive care unit
0.0001
Sepsis diagnosis >0.0001
Nursing Activities Score 0.0002
Acute Physiology and Chronic Health Evalua-tion II
>0.0001
In view of these results, the variables with p
inferior to 0.20 were chosen and the final model was
developed, which is presented in table 3.
It can be observed that only the sepsis diagno-sis and APACHE II were associated with mortality. Despite the association of the nursing workload measured by means of the NAS in the univariate
analysis, this was not confirmed in the multivariate analysis. In addition, a small gain was verified in
the variables, based on which it can be concluded
that a confounding variable influences this result.
Table 3 – Multivariate analysis of independent variables related to dependent variable (mortality). Ribeirão Preto, SP, Brazil, 2015.
Variable Odds Ratio
95% confi -dence interval
Type of patient 0.92 0.52–1.6
Length of hospitalization at intensive care unit
1.01 0.99–1.03
Sepsis diagnosis 2.74 1.6–4.8
Nursing Activities Score 1.01 1.0–1.02
Acute Physiology and Chronic Health Evaluation II
1.08 1.1–1.2
For this patient group analyzed, the hypoth-esis that the high nursing workload serves as a
mortality predictor was rejected.
DISCUSSION
For the NAS, the mean score found was higher than that of other investigated units, where the means ranged from 62.2% to 71.3 points.2,6,8,12 A high NAS can be associated with a high volume of therapeutic procedures, as patients considered to be severe and unstable require a greater load of monitoring and invasive treatments, consequently demanding a greater nursing workload.13
Regarding the severity index, the median APACHE II found was 24 and the mean was 23, and the mean risk of death of these patients was 43% (standard deviation 38) and median 33% (maxi-mum 96 and mini(maxi-mum 1.24%). A study developed at a Brazilian ICU was aimed at describing the epidemiological data and main outcomes of admit-ted patients and at evaluating variables associaadmit-ted with mortality, revealing an average APACHE II of 31.6. Another aspect that deserves to be highlighted from the results of this same study was the higher APACHE II in patients who required invasive mechanical ventilation, equal to 34, and in patients with more than two weeks of ICU hospitalization, with an APACHE II of 34.4.14
which may have influenced this result.15
Another investigation at a clinical emergency and trauma ICU showed a moderate correlation of 0.45 between workload and patient severity. The authors point out the sample of only 32 patients as a considerable limitation though, a factor that weak-ens the correlation between NAS and APACHE.16
In an exploratory, prospective study, conduct-ed with 200 intensive care unit patients, an associa-tion was shown between NAS and mortality, with
an odds ratio of 2.65 (Confidence Interval 1.11-6.34).
The author mentions that he did not consider some important confounding variables though, such as the reason for hospitalization,13 which in this study was the main factor associated with mortality.
Evaluating the ROC curve found for the scores studied, it is observed that the APACHE has better
sensitivity and specificity when compared to the
NAS. In this perspective, the composition of the evaluated indices deserves a differential analysis, as the APACHE is composed of clinical patient variables and the NAS of nursing interventions. As a result of this structure, the strength of the APACHE is greater, positively predicting mortality in ICU patients.
In the multivariate analysis, it can be
identi-fied that the NAS was not a predictive variable of
mortality, which can be explained by the fact that the degree of disease of a patient does not
neces-sarily reflect the need for care. The clinical severity indices reflect the patient’s condition, and not the
dependency on the length of nursing care.17
Patients at high risk of death are not always those who require a high level of nursing activity and the patient’s life expectancy can be strongly re-lated to the amount of nursing activity. In addition, clinical severity scores do not necessarily encompass the complexity of nursing activities, which means that aspects of nursing work not directly related to the care for an individual patient are not taken into account.18
A study that aimed to identify the nursing workload through the NAS and to verify its relation-ship with clinical and demographic variables of the patients revealed a weak correlation between work-load (NAS) and severity index / risk of mortality through SAPS II (R=0.26), similar to the correlation shown here.
Research correlating severity and workload in different subgroups of patients showed a moderate correlation only in the subgroup of neurological patients compared to those in the clinical-surgical subgroup. The author emphasizes that this
correla-tion is due to the profile of the neurological patient,
admitted to the unit in the postoperative period of elective surgeries though, which implies a short stay
in the ICU and a higher workload during the first
24 hours of hospitalization.6
There are few studies in the literature that have been able to demonstrate that more severe patients demanded longer nursing care, translated by higher NAS scores. In this sense, a survey conducted in the ICU of two public and two private hospitals indi-cates that the one-point increase in the NAS score in the past 24 hours at the ICU increased the patients’ chance of death by 5 to 8%. These indices were applied at the moment of the patient’s discharge, differently from the previously cited studies, which may explain this association.19
The average length of stay in the ICU found
indicates a severe patient profile, which requires an
appropriate critical care environment. In a prospec-tive study conducted in the ICU of four hospitals,
however, it was identified that each day of hospi -talization in the ICU increased the patients’ chance of death by 3%.
Evidence indicates that hospitalization time was not associated with mortality, a fact that can be explained if we consider that, in the univariate analysis, this variable was associated with mortal-ity, losing its effect when adding variables such as APACHE II, which may be a confounding variable when considering that patients with a higher sever-ity score may have a longer hospitalization time.19
Sepsis was the main variable associated with
mortality, similar to the findings in another study
developed at a general ICU, in which it was revealed that patients with sepsis/septic shock presented the highest predicted and observed hospital mortality rate.20
These research results reflect the reality of a
single general intensive care unit, which limits the
generalization of the findings, although the repre -sentativeness of the sample needs to be considered, which permitted robust statistical analyses.
CONCLUSION
Different study variables, such as the patients’ age, cause of hospitalization, length of
hospitaliza-tion and mean NAS during the first 24 hours of
REFERENCES
1. Altafin JA, Grion CM, Tanita MT, Festti J, Cardoso LT,
Veiga CF, et al. Nursing Activities Score and workload in the intensive care unit of a university hospital. Rev
Bras Ter Intensiva [Internet]. 2014 [cited 2017 Jan 30];
26(3):292-8. Available from: https://www.ncbi.nlm. nih.gov/pmc/articles/PMC4188466/pdf/rbti-26-03-0292.pdf
2. Panunto MR, Guirardello EB. Nursing workload in an intensive care unit of a teaching hospital. Acta Paul. Enferm [Internet]. 2012 [cited 2017 Jan 30]; 25(1):96-101. Available from: http://www.scielo.br/pdf/ ape/v25n1/v25n1a17.pdf
3. Nunes BK, Toma E. Assessment of a neonatal unit nursing staff: Application of the Nursing Activities Score. Rev Latino-am Enfermagem [Internet].
2013 [cited 2017 Jan 24]; 21(1):348-55. Available
from: http://www.scielo.br/pdf/rlae/v21n1/ pt_v21n1a09.pdf
4. Queijo AF, Padilha KG. Nursing Activities Score
(NAS): cross-cultural adaptation and validation to Portuguese language. Rev Esc Enferm USP [Internet].
2009 [cited 2017 Jan 24]; 43(Esp):1018-25. Available
from: http://www.scielo.br/pdf/reeusp/v43nspe/ a04v43ns.pdf
5. Keegan MT, Soares M. What every intensivist should know about prognostic scoring systems and
risk-adjusted mortality. Rev Bras Ter Intensiva [Internet]. 2016 [cited 2017 Jan 30]; 28(3):264-69. Available from: http://www.scielo.br/pdf/rbti/v28n3/0103-507X-rbti-28-03-0264.pdf
6. Siqueira EMP, Ribeiro MD, Souza RCS, Machado FS, Diccini S. Correlation between work load of nursing and severity of critical general, neurological and cardiac patients. Esc Anna Nery [Internet]. 2015
[cited 2017 Jan 24]; 19(2)233-38. Available from:
http://www.scielo.br/pdf/ean/v19n2/1414-8145-ean-19-02-0233.pdf
7. Kiekkas P, Brokalaki H, Manolis E, Samios A, Skartsani C, Baltopoulos G. Patient severity as an indicator of nursing workload in the intensive care
unit. Nurs Crit Care [Internet]. 2007 [cited 2017 Jan
29]; 12(1):34-41. Available from: http://onlinelibrary.
wiley.com/doi/10.1111/j.1478-5153.2006.00193.x/
epdf
8. Gonçalves LA, Padilha KG. Factors associated with nursing workload in adult intensive care units. Rev Esc Enferm USP [Internet]. 2007 [cited 2017 Jan 29]; 41(4):645-52. Available from: http://www.scielo.br/ pdf/reeusp/v41n4/14.pdf
9. Coelho FUA, Queijo AF, Andolhe R, Gonçalves LA, Padilha KG. Nursing workload in a cardiac intensive care unit and associated clinical factors. Texto Contexto Enferm [Internet]. 2011 Oct/Dec [cited 2017
Jan 24]; 20(4):735-41. Available from: http://www. scielo.br/pdf/tce/v20n4/12.pdf
10. Salluh JI, Soares M. ICU severity of illness scores:
APACHE, SAPS and MPM. Curr Opin Crit Care
[Internet]. 2014 [cited 2017 Jan 24]; 20(5):557-65.
Available from: https://www.ncbi.nlm.nih.gov/ pubmed/25137401
11. Delong ER, Delong DM, Clarke-Pearson DL. Comparing the areas under two or more correlated receiver operating characteristic curves: a nonparametric. Biometrics [Internet]. 1988 [cited 2017
Jan 24]; 44:837-45. Available from: https://www.jstor.
org/stable/pdf/2531595.pdf
12. Nogueira LS, Padilha KG, Silva DV, Lança EFC, Oliveira EM, Sousa RMC. Pattern of nursing interventions performed on trauma victims according to the Nursing Activities Score. Rev Esc Enferm USP
[Internet]. 2015 [cited 2017 Jan 24]; 49(Esp):29-35.
Available from: http://www.scielo.br/pdf/reeusp/ v49nspe/1980-220X-reeusp-49-spe-0029.pdf
13. Padilha KG, Sousa RMC, Queijo AF, Mendes
AM, Miranda DR. Nursing Activities Score in the intensive care unit: analysis of the related factors. Intensive Crit Care Nurs [Internet]. 2008 [cited 2017
Jan 25]; (24):197-204. Available from: http://www. intensivecriticalcarenursing.com/article/S0964-3397(07)00103-6/pdf
14. Guia CM, Biondi RS, Sotero S, Lima AA, Almeida
KJQ, Amorim FF. Perfil epidemiológico e preditores
de mortalidade de uma unidade de terapia intensiva geral de hospital público do Distrito Federal. Com
Ciênc Saúde. [Internet]. 2015 [cited 2017 Jan 24];
26(1/2):9-19. Available from: http://pesquisa. bvsalud.org/bvsms/resource/pt/mis-37657
15. Nogueira LS, Santos MR, Mataloun SE, Moock M. Nursing Activities Score: comparison among the Index APACHE II and the mortality in patients admitted in intensive care unit. Rev Bras Ter Intensiva [Internet].
2007 [cited 2017 Jan 24]; 19(3):327-30. Available from: http://www.scielo.br/pdf/rbti/v19n3/v19n3a10. pdf
16. Goulart LL, Aoki RN, Vegian CFL, Guirardello EB. Nursing workload in a trauma intensive care unit.
Rev Eletr Enf [Internet]. 2014 [cited 2017 Jan 25];
16(2):346-51. Available from: https://www.fen.ufg. br/fen_revista/v16/n2/pdf/v16n2a10.pdf
17. Griffiths P, Ball J, Drennan J, Dall’Ora C, Jones
J, Maruotti A, et al. Nurse staffing and patient
outcomes: strengths and limitations of the evidence to inform policy and practice. A review and discussion paper based on evidence reviewed for the National
Institute for Health and Care Excellence Safe Staffing guideline development. Int J Nurs Stud [Internet]. 2016 [cited 2017 Jan 24]; 63:213-25. Available from: http://www.sciencedirect.com/science/article/pii/ S0020748916300049
18. Guo P, Chiew Y, Shaw G, Shao L, Green R, Clark A, et al. Clinical Activity Monitoring System (CATS): an automatic system to quantify bedside clinical activities in the intensive care unit. Intensive Crit
37:52-61. Available from: http://www.sciencedirect.com/ science/article/pii/S0964339716300222
19. Silva MCM, Sousa RMC, Padilha KG. Factors associated with death and readmission into the Intensive Care Unit. Rev Latino-Am Enfermagem
[Internet]. 2011 [cited 2017 Jan 24 2016]; 19(4): [09
telas]. Available from: http://www.scielo.br/pdf/ rlae/v19n4/pt_09
20. Godinjak A, Iglica A, Rama A, Tančica I, Jusufović S, Ajanović A, et al. Predictive value of SAPS II and
APACHE II scoring systems for patient outcome in a medical intensive care unit. Acta Médica Acadêmica
[Internet]. 2016 [cited 2017 Jan 24]; 45(2):97-103.
Available from: http://ama.ba/index.php/ama/ article/view/279/pdf
Correspondence: Ana Maria Laus Universidade de São Paulo.
Escola de Enfermagem de Ribeirão Preto
Departamento de Enfermagem Geral e Especializada. Av. Bandeirantes, 3900
14040-902 - Monte Alegre, Ribeirão Preto, SP, Brasil E-mail: analaus@eerp.usp.br