The Influences of Strategic Information Systems on the
Relationship between Innovation and Organizational
Performance
Adilson Carlos Yoshikuni 1,† 1 FGV-EAESP, São Paulo, SP, Brazil
José Eduardo R. Favaretto 2,Ω
2 FGV-EAESP, São Paulo, SP, Brazil
Alberto Luiz Albertin 3,¥ 3 FGV-EAESP, São Paulo, SP, Brazil
Fernando de Souza Meirelles 4,* 4 FGV-EAESP, São Paulo, SP, Brazil
1. INTRODUCTION
The integration of information technology/information systems (IT/IS) into business strategy has been studied extensively by aca-demics and professionals for decades (MARABELLI; GALLIERS, 2017; MERALI; PAPADOPOULOS; NADKARNI, 2012; MIKALEF; PATELI, 2017; PEPPARD; GALLIERS; THOROGOOD, 2014; TEUBNER, 2013; WARD, 2012).
Seminal scientific research regarding strategic information sys -tems (SIS) grounds studies in this theoretical context (CHAN, 2002; CHAN; HUFF, 1992; KING, 1978), with a focus on clarifying the contribution of SIS to business strategy process and content (CHEN, D.Q. et al., 2010; NEWKIRK; LEDERER, 2006; PHILIP, 2007). The academic literature reiterates that SIS and the appropriate and
time-ly use of IT/IS effectivetime-ly support the phases of strategic planning in
order to maintain or gain competitive advantage and organizational
This work licensed under a Creative Commons Attribution 4.0 International License.
Corresponding author:
†FGV-EAESP, São Paulo, SP, Brazil
E-mail: [email protected]
ΩFGV-EAESP, São Paulo, SP, Brazil
E-mail: [email protected]
¥FGV-EAESP, São Paulo, SP, Brazil
E-mail: [email protected]
*FGV-EAESP, São Paulo, SP, Brazil
E-mail: [email protected]
Received: 08/22/2017. Revised: 09/22/2017. Accepted: 11/30/2017. Published Online: 06/26/2018.
DOI: http://dx.doi.org/10.15728/bbr.2018.15.5.3
ABSTRACT
This study aims to identify the influences of strategic information systems (SIS) on the relationship of innovation (exploration/exploitation), ambidexterity and organizational performance (OP). We used the statistical technique of Partial least squares path modeling (PLS-PM) with a sample of 256 Brazilian companies from different sectors. The data revealed that exploitative innovation was positively associated with OP. As a result of the study, it was confirmed that a strong SIS presence increases the influences of innovation (exploration and exploitation) and ambidexterity on OP.
Ambidexterity was positively associated with OP and presented higher path coefficients compared to the relationships between exploratory and exploitative innovation and OP. This relationship shows that ambidextrous organizations have higher OP. The study also confirmed that 96% of ambidextrous organizations have a strong SIS presence. This study may have implications for the management practices of organizations that use SIS in their strategic planning stages by enabling innovation focused on improving OP.
Keywords: Strategic Information Systems, Exploration and exploitation in innovation, Organizational performance, Ambidexterity.
BBR
15,5
445
performance (JOHNSON; LEDERER, 2013; LEIDNER; LO; PRESTON, 2011; SEGARS, A.H.; GROVER; TENG, 1998).
IT studies add that the creation of value and benefits through the effective use of IS
(ALBERTIN; ALBERTIN, 2012; MELVILLE; KRAEMER; GURBAXANI, 2004) occurs by developing skills (PAVLOU; EL SAWY, 2006; YOSHIKUNI; ALBERTIN, 2017) that help organizations become agile and sensitive to changes and facilitate competitive strate-gies involving explorative and exploitative innovation (LEIDNER; LO; PRESTON, 2011; MARABELLI; GALLIERS, 2017).
Thus, in this article we find that SIS facilitates business strategy process and content and has the potential to increase positive effects in the relationships among exploratory and
exploitative innovation activities, ambidexterity and organizational performance.
2. THEORETICAL REVIEW
2.1. Exploratory innovation, exploitative innovation and ambi
-dexterity
Developing the ability to integrate the vision, the product/service portfolio, the business processes and the implementation of strategies that meet the constant needs of the market is a challenge perpetually faced by organizations. In this regard, an organization develops the ability to create and absorb key technologies in order to promote competitive strategies through the driving action of innovation (MINTZBERG; AHLSTRAND; LAMPEL, 2009).
Innovation can be classified as exploratory and exploitative (GUPTA; SMITH;
SHALLEY, 2006; JANSEN et al., 2006; SCANDELARI; CUNHA, 2013). Seminal resear-ch regarding innovation with this approaresear-ch emerged with Marresear-ch (1991) and later in studies concerning organizational learning, strategy and entrepreneurship (JANSEN et al., 2006).
The term exploration in the context of the strategic role relates to the investigation of new ideas and solutions, encompassing the organizational actions of search, discovery, experimentation and risk-taking (HO; LU, 2015; MARCH, 1991). With this focus, it in-volves experimenting with new ideas, paradigms, technologies, strategies and knowledge, with the aim of discovering alternatives that will surpass or at least meet the needs of the market (BENNER; TUSHMAN, 2003; LEWIN; VOLBERDA, 1999; SCANDELARI; CUNHA, 2013). According to Jansen et al. (2006), exploratory innovation is based on developing strategies that will meet new demands for products and services, in a frequent cycle of reinventing the portfolio, accepting challenges to serve new markets, and deve-loping new distribution channels and new units and production lines in order to achieve competitive advantage. Companies that position themselves with exploratory innovation practices develop the ability to frequently map the overall external environment with the aim of identifying factors that enable them to launch new products and services, in order to
differentiate themselves from competitors and establish themselves as a leading company
(MINTZBERG; AHLSTRAND; LAMPEL, 2009; PORTER, 1986). Companies that prac-tice exploratory innovation thus require human, technological, and organizational capital resources (KAPLAN; NORTON, 2008) with the ability to operate in competitive environ-ments. Exploratory innovation strategies are associated with uncertainty and greater risks of
failure in implementing the strategy, but they offer superior performance gains (BENNER;
TUSHMAN, 2003; KAPLAN; NORTON, 2008; MINTZBERG; AHLSTRAND; LAMPEL, 2009; PORTER, 1986; SCANDELARI; CUNHA, 2013).
BBR
15,5
446
to Jansen et al. (2006), exploitative innovation is based on improving existing products and services, with frequent and minor adjustments to the portfolio, in order to maintain and/ or expand their current customer and market share. Organizations that position themselves with exploitative innovation practices develop the ability to frequently promote actions
that increase productive efficiency and effectiveness by rationalizing the use of resour -ces and making incremental innovations to existing products and servi-ces (MINTZBERG; AHLSTRAND; LAMPEL, 2009; PORTER, 1986). Exploitative innovation strategies are associated with risk aversion and a focus on the continuous improvement of existing abi-lities, competencies and technologies, in order to streamline business processes (LEWIN; VOLBERDA, 1999), legitimizing the standardization and automation of the routine, with a strong appeal to the productive strategy in order to generate gains from economies of scale (GUPTA; SMITH; SHALLEY, 2006).
The term “ambidextrous organization” is described by the seminal academic literatu-re (DUNCAN, 1976; TUSHMAN; O’REILLY, 1996) as an organization that is seeking a ‘balance’ between exploratory and exploitative innovation. Ambidexterity is the orga-nizational ability to implement both incremental (exploitative) and radical (explorative) changes to enable the organization to be successful over long periods of time. Other studies,
in addition to performing empirical tests on the influence of organizational performance
and organizational ambidexterity in the context of technological innovation (HE; WONG, 2004; LEIDNER; LO; PRESTON, 2011; POPADIUK; BIDO, 2016), have examined
am-bidexterity from different conceptual perspectives, which indicated that ambidextrous or -ganizations are capable of simultaneously exploiting competencies that already exist (ex-ploitation) and exploring new opportunities (exploration) (BENNER; TUSHMAN, 2003; LAVIE; STETTNER; TUSHMAN, 2010; RAISCH et al., 2009).
2.2. Organizational performance
When measuring organizational performance, the indicators tend to measure success
along one of its two tracks: financial or non-financial results (ALBERTIN; ALBERTIN, 2012;
JÄÄSKELÄINEN; LUUKKANEN, 2017; MITHAS; RAMASUBBU; SAMBAMURTHY, 2011; MOSTAGHEL et al., 2015; REEFKE; TROCCHI, 2013; SEN; BINGOL; VAYWAY, 2017). Financial measurements represent the long-term value of the organization’s per-formance (ATKINSON et al., 2011; KIM et al., 2011) and are the result of organizational
effectiveness in strategy implementation, productivity, and revenue growth (KAPLAN;
NORTON, 2008; OUAKOUAK; OUEDRAOGO, 2013; YOSHIKUNI; ALBERTIN, 2017).
According to Kaplan and Norton (2008), in order to achieve long-term value for sha-reholders, we need to understand customer performance and environmental conditions (MITHAS; RAMASUBBU; SAMBAMURTHY, 2011; YOSHIKUNI; ALBERTIN, 2014). Customer performance is measured by customer satisfaction with product and service qua-lity, customer relationships and retention, and brand image (KAPLAN; NORTON, 2008; LEÓNSORIANO; MUÑOZTORRES; CHALMETAROSALEÑ, 2010; MOSTAGHEL et al., 2015). The organization therefore, develops competencies to perform the activities in the business value chain (PARK; LEE; CHAE, 2017; PERKINS; GREY; REMMERS, 2014; REEFKE; TROCCHI, 2013) in order to deliver the attributes requested by customers and promote satisfaction (KAPLAN; NORTON, 2008), in addition to retain those
custo-mers (SILA, 2007). Measuring the different perspectives of organizational performance is thus essential to understanding the causes of a company’s financial result and their perfor
-mance in terms of non-financial indicators (ALBERTIN; ALBERTIN, 2012; KAPLAN;
BBR
15,5
447
2.3. Strategic Information Systems (SIS)
Over the last several decades, research regarding IT/IS value creation for businesses has been intensifying (MARABELLI; GALLIERS, 2017; MELVILLE; KRAEMER;
GURBAXANI, 2004; MERALI; PAPADOPOULOS; NADKARNI, 2012). An effective
use of IT/IS in the business strategy was highlighted as one of the most important factors for CIOs and CEOs (JOHNSON; LEDERER, 2013; PHILIP, 2007). Studies have shown that SIS supports business strategy process and content, improving competitive advantage and organizational performance, even in highly competitive environments (CHEN, Y. et al., 2014; MERALI; PAPADOPOULOS; NADKARNI, 2012; TEUBNER, 2013). SIS is
defined as a portfolio of IT/IS applications that collect, process, analyze and make data/
information available for decision making (O’BRIEN; MARAKAS, 2007; SABHERWAL; CHAN, 2001), and it exists within business strategy process and content in order to achieve business objectives.
Several studies have found that SIS supports the strategic planning process (NEWKIRK; LEDERER, 2006; SINGH; WATSON; WATSON, 2002; YOSHIKUNI; JERONIMO, 2013) and strategy content by facilitating strategic awareness through the dissemination of strategic objectives/goals to the entire local organization (CHEN, D.Q. et al., 2010; SEGARS, A.H.; GROVER; TENG, 1998); in the analysis of the company’s overall environment, by making it possible to map opportunities and threats in the external environment (DAMERON; LÊ; LEBARON, 2015; NEWKIRK; LEDERER, 2006; XUE, L.; RAY; SAMBAMURTHY, 2012); in the strategy design, by aligning internal—technological, human, and organiza-tional resources and opportunities and mitigating threats (ARVIDSSON; HOLMSTRÖM; LYYTINEN, 2014; LEIDNER; LO; PRESTON, 2011; SINGH; WATSON; WATSON, 2002); in the formulation, by selecting strategies to develop new business processes ena-bled by the IT/IS architecture (JOHNSON; LEDERER, 2013; LEIDNER; LO; PRESTON, 2011; MARABELLI; GALLIERS, 2017; MERALI; PAPADOPOULOS; NADKARNI, 2012; SHOLLO; GALLIERS, 2016); and in the implementation and monitoring of the bu-siness strategy, by supporting the change process, and the execution and control of action plans (KAPLAN; NORTON, 2008; ROUHANI et al., 2016; SHOLLO; GALLIERS, 2016; SINGH; WATSON; WATSON, 2002).
In short, SIS incorporates the strategic planning process and facilitates the cooperation, analysis and participation of employees, enabling them to think about, analyze, deploy and follow strategic planning through the IT/IS portfolios.
3.
RESEARCH MODEL, DEVELOPMENT OF HYPOTHESES
AND CONTROL VARIABLES
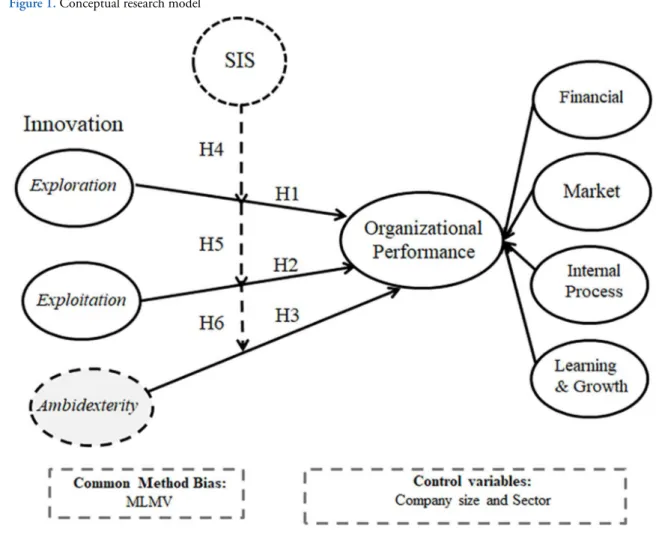
Based on the existing literature, we are able to identify relationships among SIS, explo-ratory and exploitative innovation, ambidexterity and organizational performance, which served as the foundation for developing the study’s conceptual model (Figure 1) and also raised the respective hypotheses to be tested.
3.1. Innovation and organizational performance
According to Porter (1986), companies develop specific abilities and competencies to
formulate technological strategies for incremental innovations (exploitation), through cost leadership, which seek greater intensity in order to optimize processes and improve existing
products; or radical innovations (exploration), through differentiation, with the ability to
identify, choose and explore knowledge and technologies—external and internal—in order
BBR
15,5
448
The different approaches to innovation strategy (MINTZBERG; AHLSTRAND;
LAMPEL, 2009) emphasize actions focused on accurately understanding the external en-vironment (exploration) in order to develop new products and services, and developing
internal expertise in business processes in order to achieve gains in operational efficiency and effectiveness (exploitation).
Assuming that innovation strategies are developed in order to increase the company’s
economic and financial sustainability through revenue and productivity growth (KAPLAN;
NORTON, 2008; MINTZBERG; AHLSTRAND; LAMPEL, 2009; PORTER, 1986; SCANDELARI; CUNHA, 2013; YOSHIKUNI; JERONIMO, 2013) and that organizatio-nal performance is related to the company’s ability to use interorganizatio-nal resources in business processes (YOSHIKUNI; ALBERTIN, 2017), as well as based on previous studies in stable
economies, which found that innovation influences organizational performance (FANG;
LEVINTHAL, 2009; HE; WONG, 2004; JANSEN et al., 2006; SCANDELARI; CUNHA, 2013; UOTILA et al., 2009), we propose the following hypotheses:
H1: Exploratory innovation is positively associated with organizational performance H2: Exploitative innovation is positively associated with organizational performance.
An implicit premise in the studies by March (1991) is that organizations with supe-rior performance seek to implement both exploratory and exploitative innovation activi-ties. Studies that analyzed organizational ambidexterity (DUNCAN, 1976; TUSHMAN;
O’REILLY, 1996) also confirmed that the best performing organizations are ambidextrous.
BBR
15,5
449
We also identify evidence of a generally positive relationship between organizational ambidexterity and organizational performance in several empirical studies (GIBSON; BIRKINSHAW, 2004; HE; WONG, 2004; LUBATKIN et al., 2006).
Recent studies suggest that organizations should seek ambidexterity in order to in-crease competitive advantage and performance (LEIDNER; LO; PRESTON, 2011; SCANDELARI; CUNHA, 2013). Thus, we propose the following hypothesis:
H3: Ambidexterity is positively associated with organizational performance.
3.2. Moderating SIS in the relationship between innovation and
organizational performance
According to Chen et al. (2010) and Segars et al. (1998), SIS facilitates the ability to successfully execute business strategy process and content. The authors argue that business
strategy success involves the company’s ability to develop effective cooperative work from
employees, enabling them to think about, analyze and execute the strategy supported by IT/ IS. When SIS is incorporated into the strategic planning process, it facilitates strategic aware-ness, promoting top-down and bottom-up communication/integration/cooperation (CHEN, D.Q. et al., 2010), without any local or global borders, in order for everyone to understand the strategic priorities (KARPOVSKY; GALLIERS, 2015; O’BRIEN; MARAKAS, 2007), thus achieving organizational commitment through teamwork (SEGARS, ALBERT H.; GROVER, 1998).
Pavlou and El Sawy (2010) found that the effective use of SIS enables a real-time per -ception of a company’s existing resources, enabling them to adapt to transformations in the external environment. SIS enables an organization to map the external factors of the overall environment (DAMERON; LÊ; LEBARON, 2015; DAVENPORT; HARRIS; MORISON, 2010; JARZABKOWSKI; KAPLAN, 2015; NEWKIRK; LEDERER, 2006) and develop innovation strategies that capture opportunities (KAPLAN; NORTON, 2008; PORTER, 1986).
SIS supports the design stage of business strategy, allowing a company to reconfi -gure its existing operational capabilities to better respond to environmental changes (ARVIDSSON; HOLMSTRÖM; LYYTINEN, 2014; LEIDNER; LO; PRESTON, 2011; SEGARS, ALBERT H.; GROVER, 1998; SINGH; WATSON; WATSON, 2002), and
faci-litates the ability to spontaneously reconfigure existing resources during the construction
of new operational capabilities and address urgent, unpredictable and new environmental situations (PAVLOU; EL SAWY, 2006, 2010).
SIS facilitates flexibility and agility during the formulation stage of strategic planning,
enabling decision-making on strategies related to aggressiveness, analysis, proactivity, risk or risk aversion, defensiveness and innovation (CHAN; HUFF, 1992).
Thus, SIS facilitates competencies that are essential to an organization effectively de -veloping creativity strategies and/or productivity (control) strategies as a product of the
strategic planning process (CHEN, D.Q. et al., 2010). By definition, it is reasonable to
conclude that when an exploratory innovation strategy is supported by SIS, it focuses on the company’s creativity through the creation of new products and services and new ap-proaches using IT/IS resources, whereas an exploitative innovation strategy focuses on
BBR
15,5
450
DEVECE; LLOPIS-ALBERT, 2015); thereby, influencing competitive advantage and orga -nizational performance (CHEN, D.Q. et al., 2010). Therefore, we can formulate the
hypo-thesis that a strong or weak SIS presence influences (MARTINEZ-SIMARRO; DEVECE;
LLOPIS-ALBERT, 2015) the relationship between innovation strategies and organizational performance.
H4: A strong or weak SIS presence moderates the relationship between exploratory
in-novation and organizational performance.
H5: A strong or weak SIS presence moderates the relationship between exploitative
innovation and organizational performance.
An important study by Chen et al. (2010) contributed to the academic literature regarding SIS by identifying typologies. This study was expanded by Leidner, Lo and Preston (2011), who included an analysis of ambidexterity and provided empirical evidence of the positive relationship between SIS and organizational performance; this same study also found that ambidextrous organizations are considered to have the highest performance. Other studies
related to SIS involving ambidexterity identified the organizational challenge of simulta -neously ‘balancing’ explorative and exploitative activities, with a focus on organizational learning and innovation (MARABELLI; GALLIERS, 2017; MERALI; PAPADOPOULOS; NADKARNI, 2012). Therefore, we can formulate the following hypothesis:
H6: A strong or weak SIS presence moderates the relationship between ambidexterity
and organizational performance.
3.3.Control variables
Control variables (CV) are critical to management research because they simplify the in-terpretation of the results of statistical analyses (CARLSON; WU, 2012). Given that
orga-nizations have significant expenses and investments related to IT/IS use and management, a
study performed annually by Fundação Getulio Vargas found that the services sector spent 11% of its net income in 2017, whereas the industrial sector spent 4.5% (MEIRELLES,
2018). Thus, this study uses control variables in an attempt to investigate the influences
of an organization’s characteristics (MELVILLE; KRAEMER; GURBAXANI, 2004)—its sector and size, based on the number of employees—on the relationship between innova-tion and organizainnova-tional performance.
4. METHODOLOGY
4.1. Scale
To evaluate innovation (exploration/exploitation), we decided to use measurements and items at the level of the organizational unit, taken from Jansen, Van Den Bosch and Volberda (2006). We measured SIS using the scale by Singh (2002) and Newkirk and Lederer (2006)
and specialists in the field validated it through content analysis (MORGADO et al., 2018), and the reliability, validity and parsimony of the items were confirmed, as recommended by
Wieland, Durach, Kembro and Treiblmaier (2017). We used the scale to measure organiza-tional performance (KAPLAN; NORTON, 2008), proposed by Yoshikuni et al. (2014), for
the dimensions of financial performance, market, internal process, and learning and growth.
For the innovation and SIS items, we need to perform translations and consult with subject
specialists, who made semantic modifications in order to make it comprehensible without
BBR
15,5
451
which made it possible to measure them adequately according to the recommendations of Hair, Hult, Ringle and Sarsdest (2013).
Specialists in the field of strategy (researchers and professors) and IS, who had more
than 10 years of experience, evaluated the research questionnaire. The evaluation of the instrument was positive and showed that the questionnaire represented the perception of the variables used in the scales.
We evaluated all the items using a 7-point Likert scale, ranging from 1 (strongly disa-gree) to 7 (strongly adisa-gree). The full scale with the constructs, assertions (variables/indica-tors), and their factor loadings is available in Appendix I of this study as supplementary material.
4.2. Data collection
We selected a sample from the directory provided by the Center for Applied Information Technology (Centro de Tecnologia de Informação Aplicada – GVcia) at the São Paulo School of Business Administration (Escola de Administração de Empresas de São Paulo – EAESP), Fundação Getulio Vargas (FGV). We chose the respondents based on their posi-tion, experience and professional knowledge (KIM et al., 2011), and they provided reliable information about the characteristics of the group or organization; they included senior business managers with appropriate knowledge of IT/IS and strategic business processes.
We administered the study via email through the distribution of 1353 invitations to or-ganizations, of which 256 (19%) responded to the questionnaire using a form available on the Internet. The sample size met the requirements for partial least squares path modeling (PLS-PM) (HENSELER; RINGLE; SINKOVICS, 2009; URBACH; AHLEMANN, 2010). Of those who responded to the questionnaire on behalf of their respective organizations, 39% were presidents, directors or superintendents, 36% were managers or coordinators, and 25% were supervisors with decision-making power.
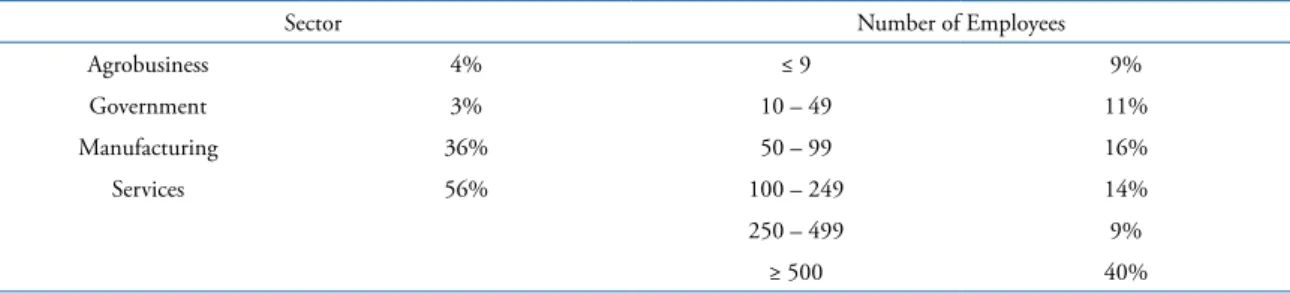
Table 1 describes the composition of the companies included in the sample in terms of the sector in which they operate and the number of employees.
As observed from the data presented in Table 1, 93% of the sample was composed of companies in the services and manufacturing sectors, and 40% of the sample was compo-sed of organizations with more than 500 employees.
4.3. Analysis
After evaluating the descriptive statistics of the demographic variables, the scale was
modified using confirmatory factor analysis (convergent validity, discriminant validity and
reliability).
We estimated the analytical structural model using PLS-PM by analyzing common is-sues involving the simultaneous analysis of multiple variables, for example, with asymme-tric variable distribution or limited data (RINGLE; SARSTEDT; STRAUB, 2012), using the SmartPLS 2.0 M3 software package for all analyses (RINGLE; WENDE; WILL, 2005).
Sector Number of Employees
Agrobusiness 4% ≤ 9 9%
Government 3% 10 – 49 11%
Manufacturing 36% 50 – 99 16%
Services 56% 100 – 249 14%
250 – 499 9%
≥ 500 40%
BBR
15,5
452
5. RESULTS
5.1. Measurement model
We defined the dimensions a priori based on the theoretical reference and were maintai
-ned for confirmatory factor analysis.
After eliminating two items that had a factor loading less than or equal to 0.5 in addi-tion to high cross-loadings (lack of discriminant validity), the convergent validity of all the constructs was considered adequate, with items greater than 0.707, and all the cons-tructs presented an average variance extracted greater than 0.5 (HENSELER; RINGLE;
SINKOVICS, 2009; RINGLE; BIDO; DA SILVA, 2014). We find the values on the dia
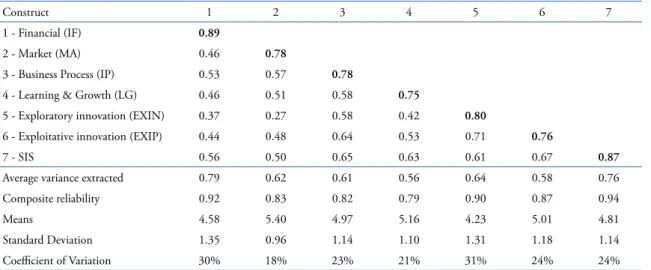
-gonal (square root of average variance extracted) to be greater than the values outside the diagonal (correlations), and thus, there is discriminant validity (HAIR et al., 2013). The reliability is also adequate, with composite reliability values greater than 0.7, as can be observed from Table 2 (HAIR et al., 2013; ROUHANI et al., 2016).
From Table 2, we can observe that the organizational performance (OP) constructs (1,
2, 3 and 4) are correlated (0.46 to 0.58), which confirms the possibility of using them as
indicators for a second-order construct. The second-order OP variable produced an average variance extracted of 0.642 and a composite reliability estimate of 0.93. In a comparison of the Fornell-Larcker criterion with the square root of average variance extracted values of the OP variable (0.801), the criterion was revealed to be satisfactory.
5.2. Structural Model
The operationalization of the model was complex because it involved evaluating the
moderating effect of SIS and the control variables, in addition to including a latent variable
to eliminate common method variance (i.e., the measured latent marker variable, hereafter the MLMV method). We apply the MLMV approach by Chinn W.W. et al., (2013) to
con-trol common method variance. Specifically, four items were designed to have the lowest
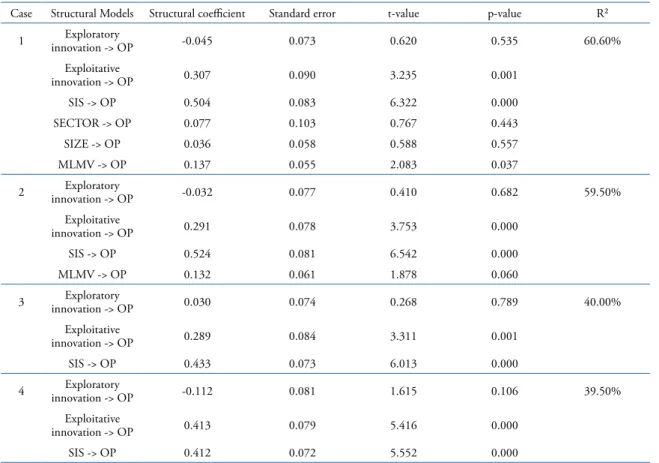
possible logical correlation with the other constructs under investigation (see Chart 1). Therefore, we analyze the model in more than one case (Table 3), and we discuss those results in the following sections.
In case 1, the relationship between exploitative innovation and OP was 0.307 (p<0.001), and in case 2, without the latent variable (MLMV), it was 0.291 (p-value < 0.001); we con-clude that the common method variance was minimal (0.02), and the result of case 2 will
Construct 1 2 3 4 5 6 7
1 - Financial (IF) 0.89
2 - Market (MA) 0.46 0.78
3 - Business Process (IP) 0.53 0.57 0.78
4 - Learning & Growth (LG) 0.46 0.51 0.58 0.75
5 - Exploratory innovation (EXIN) 0.37 0.27 0.58 0.42 0.80
6 - Exploitative innovation (EXIP) 0.44 0.48 0.64 0.53 0.71 0.76
7 - SIS 0.56 0.50 0.65 0.63 0.61 0.67 0.87
Average variance extracted 0.79 0.62 0.61 0.56 0.64 0.58 0.76
Composite reliability 0.92 0.83 0.82 0.79 0.90 0.87 0.94
Means 4.58 5.40 4.97 5.16 4.23 5.01 4.81
Standard Deviation 1.35 0.96 1.14 1.10 1.31 1.18 1.14
Coefficient of Variation 30% 18% 23% 21% 31% 24% 24%
BBR
15,5
453
be used to discuss hypotheses H1 and H2. Therefore, hypothesis H1, which presents the
relationship between explorative innovation and OP, did not present statistical significance, with a p-value > 0.05. Hypothesis H2 was supported and presented the influence of exploi -tative innovation on OP (0.291; p-value < 0.001).
To verify hypothesis H3, we classify ambidextrous organizations as those with a va-lue higher than the average for the explorative and exploitative innovation variables, in a total of 103 cases; we create the ambidexterity (interactive term) variable by cross-multi-plying all the standardized items of the explorative and exploitative innovation variables (CHIN, WYNNE W; MARCOLIN; NEWSTED, 2003; LEIDNER; LO; PRESTON, 2011).
Hypothesis H3 is supported, as the influence of the relationship between ambidextrous or
-ganizations and OP is statistically positive and significant on performance (0.377; p-value
< 0,001).
SIS presented an influence on the dependent variable (case 2; 0.524; p-value < 0.001),
indicating moderation of the variable in the relationship between innovation and OP (CARLSON; WU, 2012). Thus, to test hypotheses H4 and H5, we create heterogeneous
databases to evaluate the differences in structural coefficients between groups (HAIR et MLMV_1: It is easy to reach my goals.
MLMV_2: I have never given up on the dream of having my own business. MLMV_3: I have a positive attitude towards others.
MLMV_4: I always imagine my future home.
Chart 1. Formative indicators used for the MLMV analysis
Case Structural Models Structural coefficient Standard error t-value p-value R²
1 Exploratory
innovation -> OP -0.045 0.073 0.620 0.535 60.60%
Exploitative
innovation -> OP 0.307 0.090 3.235 0.001
SIS -> OP 0.504 0.083 6.322 0.000
SECTOR -> OP 0.077 0.103 0.767 0.443
SIZE -> OP 0.036 0.058 0.588 0.557
MLMV -> OP 0.137 0.055 2.083 0.037
2 Exploratory
innovation -> OP -0.032 0.077 0.410 0.682 59.50%
Exploitative
innovation -> OP 0.291 0.078 3.753 0.000
SIS -> OP 0.524 0.081 6.542 0.000
MLMV -> OP 0.132 0.061 1.878 0.060
3 Exploratory
innovation -> OP 0.030 0.074 0.268 0.789 40.00%
Exploitative
innovation -> OP 0.289 0.084 3.311 0.001
SIS -> OP 0.433 0.073 6.013 0.000
4 Exploratory
innovation -> OP -0.112 0.081 1.615 0.106 39.50%
Exploitative
innovation -> OP 0.413 0.079 5.416 0.000
SIS -> OP 0.412 0.072 5.552 0.000
Table 3. Standardized regression coefficients of the structural models
Caption: We measure the sector by using two formative indicators (dummy) to represent the following categories: agribusi-ness, government, manufacturing and services.
BBR
15,5
454
al., 2013) in the relationship between innovation and OP. The groups classified in case 3
(“weak SIS presence”) have averages less than or equal to 4 points (100 cases), and those in case 4 (“strong SIS presence”) had averages greater than 4 points (156 cases).
The relationship between explorative innovation and OP in both cases 3 and 4 does not
present statistical significance (p-value > 0.05), and thus hypothesis H4 is not supported.
However, the relationship between exploitative innovation and OP presented statistical
sig-nificance in both cases 3 and 4 (0.289; 0.413; p-values < 0.001), confirming hypothesis H5. Comparing the path effects between the SIS groups, we observe a significant variation of
0.125 (30%).
To evaluate hypothesis H6, we separate the database into two groups. The first is the
group of ambidextrous companies with a strong SIS presence (99 cases), which presents
positive and significant effects on performance (0.359; p-value < 0.001; R2 = 12.6%). Given the insufficient size of the second group, ambidextrous companies with weak SIS (only 4 cases), we are not able to verify the relationship’s effects or statistical significance,
and therefore, the hypothesis is partially supported.
Using the data, we are able to perform additional analyses regarding the influence of SIS
on the relationship between innovation and OP. First, independent groups of companies are
classified as having a strong presence of exploratory (46 cases) and exploitative (210 cases)
innovation activities, moderated by a strong or weak SIS presence. Next, the relationship between exploitative innovation and OP is analyzed for groups with strong (158 cases) and
weak (52 cases) SIS, and the path effects are positive and statically significant (strong SIS; 0.557; p-value < 0.001; R2 = 31.1%; and weak SIS; 0.339; p-value < 0.05; R2 = 11.5%), presenting a difference of 0.22 (39%) between path coefficients. Then, we perform the same
analysis for the relationship between explorative innovation and OP for groups with strong
(37 cases) and weak (9 cases) SIS. For the strong SIS group, the effect on the relationship between explorative innovation and performance is positive and statistically significant (0.453; p-value < 0.001; R2 = 20.5%); however, as there are only 4 cases for the weak SIS
group, it is impossible to statistically test the relationship.
The sector and number of employee CV presented no statistically significant effect (p --value > 0.05) on the OP construct, and they were extracted from the model in order to
remove their effect on the relationships of interest to this study (CARLSON; WU, 2012). As indicated by the values of R2 listed in Table 3, the determination coefficients indicate that the relationship between innovation and OP has a large effect (HAIR et al., 2013).
6. DISCUSSION
The testing of hypothesis H1 (exploratory innovation -> OP) did not present statistical
significance; this result differs from those of other studies on innovation
(MARTINEZ-SIMARRO; DEVECE; LLOPIS-ALBERT, 2015; UOTILA et al., 2009). However, in a
specific analysis of the group of 37 companies with a strong presence of exploratory inno -vation activities and a strong SIS presence, the relationship between exploratory inno-vation
and corporate performance had a positive and statistically significant effect. This analysis
allows us identifying—in a group restricted to the 14% of companies with a strong SIS
pre-sence—the influence of the relationship between exploratory innovation activities and OP,
in line with other studies regarding SIS (LEIDNER; LO; PRESTON, 2011; XUE, LING; RAY; SAMBAMURTHY, 2012).
The testing of hypothesis H2 (exploitative innovation -> OP) provides support to
con-firm that innovation has a more substantial influence on an organization’s performance
BBR
15,5
455
exploitative activities and a strong SIS presence have a 39% higher influence on OP than
companies with a weak SIS presence. We believe that incorporating SIS into the strategic planning process facilitates the content of exploitative innovation strategies, thereby allo-wing the company to regularly implement small adaptations in its portfolio of products and services, making itself present in its local market, expanding its relationship with the
custo-mer and improving its efficiency and effectiveness in business processes. The results are in
line with studies performed at Brazilian companies by Yoshikuni and Albertin (2017), who
found that IT/IS are intensified to make productivity gains through operational efficiency and effectiveness.
The testing of hypothesis H3 (Ambidexterity -> OP) is supported (0.377; p-value < 0.001) and shows that 40% of the companies in the sample develop ambidextrous activities,
confirming that not all companies develop this ability (DUNCAN, 1976; LEIDNER; LO;
PRESTON, 2011).
Hypothesis H4, which tested a strong or weak SIS presence in the relationship between exploratory innovation and OP, is not supported in the complete sample. However, in a group of companies (37 cases) with a strong SIS presence and a strong presence of
explo-ratory innovation, we find a positive and statistically significant association with OP. This relationship identifies that the stronger the SIS presence, the greater the contribution of
exploratory innovation to OP.
Hypothesis H5, which tested a strong or weak SIS presence in the relationship between exploitative innovation and OP, is supported. A strong SIS presence shows a 30% higher
contribution to the path coefficient for the relationship between exploitative innovation and
OP, when compared to a weak SIS presence. For a group of companies (158 cases) with a strong SIS presence and a strong presence of exploitative innovation activities, there is
a 40% higher contribution to the path coefficient for the relationship between exploitative innovation and OP, compared to a weak SIS presence. This relationship signifies that the
stronger the SIS presence, the greater the contribution of exploitative innovation to OP. Hypothesis H6 is partially supported, as the group of companies with a weak SIS
presen-ce is insufficient for the statistical test (4 cases). However, the study shows that a strong SIS presence has a positive and statistically significant contribution to the relationship between
ambidexterity and OP. This relationship means that a strong SIS presence is one of the de-termining factors for organizational ambidexterity.
7. CONCLUSION
The study made it possible to identify different impacts of a strong or weak SIS presence
on the relationships among the variables of innovation (exploitation and exploration), am-bidexterity and organizational performance. In the research method, we use the PLS-PM statistical approach with the SmartPLS software, which appears to be an appropriate tool for analysis in the study.
The study’s main theoretical contribution is that a strong SIS presence increases the
in-fluences of innovation (exploitation and exploration) and ambidexterity on organizational
performance.
BBR
15,5
456
This article also makes practical contributions, demonstrating that organizations should
carefully examine how SIS can benefit their phases of strategic planning by enabling inno -vation focused on improving organizational performance.
This study is limited by the method used to collect the data. The sample is not probabi-listic, and the results obtained for a given population cannot be generalized.
8. REFERENCES
ALBERTIN, Luiz Alberto; ALBERTIN, Rosa Maria de Moura. Dimensões do uso de tecnologia da informa-ção: um instrumento de diagnóstico e análise. Revista de Administração Pública, v. 46, n. 1, p. 125–51, 2012.
ARVIDSSON, V.; HOLMSTRÖM, J.; LYYTINEN, K. Information systems use as strategy practice: A multi--dimensional view of strategic information system implementation and use. Journal of Strategic Informa-tion Systems, v. 23, n. 1, p. 45–61, 2014. Disponível em: <http://dx.doi.org/10.1016/j.jsis.2014.01.004>. ATKINSON, A.A. et al. Management Accounting: Information for Decision-making and Strategy Execution.
6th ed. ed. Upper Saddle River: Prentice Hall, 2011.
BENNER, M. J.; TUSHMAN, M. L. Exploitation, Exploration, and Process Management: The Productivity Dilemma Revisited. Academy of Management Review, v. 28, n. 2, p. 238–256, 2003.
CARLSON, Kevin D.; WU, Jinpei. The illusion of statistical control: control variable practice in management research. Organizational Research Methods, v. 15, n. 3, p. 413–435, 2012.
CHAN, Y.E; HUFF, S L. Strategy: an information systems research perspective. The Journal of Strategic In-formation Systems, v. 1, n. 4, p. 191–204, 1992. Disponível em: <http://www.sciencedirect.com/science/ article/pii/096386879290035U>.
CHAN, Y E. Why haven’t we mastered alignment? The importance of the informal organization structure. University of Minnesota MIS Quarterly Executive, v. 1, n. 2, 2002.
CHAN, Y E; HUFF, S. Strategy: an information systems research perspective. The Journal of Strategic Infor-mation Systems, 1992.
CHEN, D.Q. et al. Information Systems Strategy: Reconceptualization, Measurement, and Implications. MIS Quarterly, v. 34, n. 2, p. 233–259, 2010.
CHEN, Y. et al. IT capability and organizational performance: the roles of business process agility and en-vironmental factors. European Journal of Information Systems, Ubuntu 9?is 9 opponent l, v. 23, n. 3, p. 326–342, 2014. Disponível em: <http://www.palgrave-journals.com/doifinder/10.1057/ejis.2013.4>. CHIN, W.W. et al. Controlling for common method variance in PLS analysis: the measured latent marker
variable approach. In: ABDI, H., CHIN, W.W., VINZI, V.E., RUSSOLILLO, G. AND TRINCHERA, L. (Org.). . New Perspectives in Partial Least Squares and Related Methods. New York: Springer, 2013. p. 231–239.
CHIN, Wynne W; MARCOLIN, Barbara L; NEWSTED, Peter R. A Partial Least Squares Latent Variable Modeling Approach for Measuring Interaction Effects: Results from A Partial Least Squares Latent Varia-ble Modeling Approach for Measuring Interaction Effects: Results from a Monte Carlo Simulation Study and an Ele. Information Systems Research, v. 14, n. 2, p. 189–217, 2003.
DAMERON, S.; LÊ, J.K.; LEBARON, C. Materializing Strategy and Strategizing Materials: Why Matter Matters. British Journal of Management, v. 26, n. S1, p. S1–S12, 2015.
DAVENPORT, T.; HARRIS, J.G.; MORISON, R. Analytics at Work: Smarter Decisions, Better Results. [S.l: s.n.], 2010.
DUNCAN, R. B. The ambidextrous organization: Designing dual structures for innovation. In: KILMANN, R. H.; PONDY, L. R.; SLEVIN, D. P. (Org.). The management of organization design: Strategies and im-plementation. [S.l.]: North Holland, 1976.
FANG, Christina; LEVINTHAL, Daniel. Near-Term Liability of Exploitation: Exploration and Exploitation in Multistage Problems. Organization Science, v. 20, n. 3, p. 538–551, 2009.
GIBSON, C. B.; BIRKINSHAW, J. The Antecedents, Consequences, and Mediating Role of Organizational Ambidexterity. Academy of Management Journal, v. 47, n. 2, p. 209–226, 2004.
GUPTA, A K; SMITH, K G; SHALLEY, C E. The interplay between exploration and exploitation. Academy of management journal, v. 49, n. 4, p. 693–706, 2006.
HAIR, J.F. et al. A Primer on Partial Least Squares Structural Equation Modeling (PLS-SEM). Thousand Oaks: Sage, 2013.
BBR
15,5
457
HENSELER, J.; RINGLE, C.M.; SINKOVICS, R.R. The use of partial least squares path modeling in inter-national marketing. Advances in Interinter-national Marketing, v. 20, p. 277–319, 2009.
HO, H.; LU, R. Performance implications of marketing exploitation and exploration: Moderating role of su-pplier collaboration. Journal of Business Research, v. 68, n. 5, p. 1026–1034, 2015.
JÄÄSKELÄINEN, A.; LUUKKANEN, N. The use of performance measurement information in the work of middle managers. International Journal of Productivity and Performance Management, v. 66, n. 4, p. 479–499, 2017.
JANSEN, J.J.P. et al. Exploratory Innovation, Exploitative Innovation, and Performance: Effects of Organiza-tional Antecedents and Environmental Moderators. Management Science, v. 52, n. 11, p. 1661–1674, nov. 2006. Disponível em: <http://pubsonline.informs.org/doi/abs/10.1287/mnsc.1060.0576>.
JARZABKOWSKI, P.; KAPLAN, S. Strategy tools-in-use: a framework for understanding “technologies of rationality” in practice. Strategic Management Journal, v. 36, 2015.
JOHNSON, A.M.; LEDERER, A.L. IS Strategy and IS Contribution: CEO and CIO Perspectives. Informa-tion Systems Management, v. 30, n. 4, p. 306–318, 2013.
KAPLAN, R.S.; NORTON, D.P. The Execution Premium: Linking Strategy to Operations for Competitive Advantage. Boston: Harvard Business School Press, 2008.
KARPOVSKY, A.; GALLIERS, R.D. Aligning in practice: From current cases to a new agenda. Journal of Information Technology, v. 30, n. 2, p. 136–160, 2015.
KIM, Gimun et al. IT Capabilities, Process-Oriented Dynamic Capabilities, and Firm Financial Performance. Journal of Association for Information Systems, v. 12, n. 7, p. 487–517, 2011.
KING, William R. Strategic Planning for Management Information Systems. MIS Quarterly, v. 2, n. 1, p. 27–37, 1978.
LAVIE, D.; STETTNER, U.; TUSHMAN, M. L. Exploration and Exploitation Within and Across Organiza-tions. The Academy of Management Annals, v. 4, n. 1, p. 109–155, 2010.
LEIDNER, D.E.; LO, J.; PRESTON, D S. An empirical investigation of the relationship of IS strategy with firm performance. Journal of Strategic Information Systems, v. 20, n. 4, p. 419–437, 2011.
LEÓN‐SORIANO, R.; MUÑOZ‐TORRES, J.M.; CHALMETA‐ROSALEÑ, R. Methodology for sustainabi-lity strategic planning and management. Industrial Management & Data Systems, v. 110, n. 2, p. 249–268, 2010.
LEWIN, Arie Y.; VOLBERDA, Henk W. Prolegomena on Coevolution: A Framework for Research on Stra-tegy and New Organizational Forms. Organization Science, v. 10, n. 5, p. 519–534, out. 1999. Disponível em: <http://pubsonline.informs.org/doi/abs/10.1287/orsc.10.5.519>. Acesso em: 26 fev. 2017.
LUBATKIN, M. H. et al. Ambidexterity and Performance in Small-to Medium-Sized Firms: The Pivotal Role of Top Management Team Behavioral Integration. Journal of Management, v. 32, n. 5, p. 646–672, 2006. MARABELLI, M.; GALLIERS, R.D. A reflection on information systems strategizing: the role of power and
everyday practices. Information Systems Journal, v. 27, n. 3, p. 347–366, 2017.
MARCH, J.G. Exploration and exploitation in organizational learning. Organization Science, v. 2, n. 1, p. 71–87, 1991.
MARTINEZ-SIMARRO, David; DEVECE, Carlos; LLOPIS-ALBERT, Carlos. How information systems strategy moderates the relationship between business strategy and performance. Journal of Business Re-search, v. 68, n. 7, p. 1592–1594, 2015.
MEIRELLES, Fernando Souza. Administração de recursos de informática: tecnologia de informação nas empresas – panorama e indicadores (28a. edição). . Sao Paulo: Fundação Getulio Vargas, Escola de Admi-nistração de Empresas de São Paulo, Centro de Tecnologia de Informação Aplicada. FGV-EAESP-CIA. , 2017
MELVILLE, N.; KRAEMER, K.; GURBAXANI, V. Review: Information Technology and Organizational Performance: An Integrative Model of IT Business Value. MIS Quarterly, v. 28, n. 2, p. 283–322, 2004. MERALI, Y.; PAPADOPOULOS, T.; NADKARNI, T. Systems Information systems strategy : Past, present,
future ? Journal of Strategic Information Systems, v. 21, n. 2, p. 125–153, 2012.
MIKALEF, P.; PATELI, A. Information technology-enabled dynamic capabilities and their indirect effect on competitive performance: Findings from PLS-SEM and fsQCA. Journal of Business Research, v. 70, p. 1–16, 2017.
MINTZBERG, H.; AHLSTRAND, B.W.; LAMPEL, J. Strategy safari: The complete guide through the wilds of strategic management. 2. ed. Harlow:UK: Financial Times Prentice Hall, 2009.
BBR
15,5
458
MORGADO, F.F.R. et al. Scale development: ten main limitations and recommendations to improve future research practices. Psicologia: Reflexão e Crítica, v. 30, n. 1, p. 3, 2018. Disponível em: <http://prc.sprin-geropen.com/articles/10.1186/s41155-016-0057-1>.
MOSTAGHEL, R et al. Strategic use of enterprise systems among service firms: Antecedents and consequen-ces. Journal of Business Research, p. 1544–1549, 2015.
NEWKIRK, H.E.; LEDERER, A.L. The effectiveness of strategic information systems planning under envi-ronmental uncertainty. Information & Management, v. 43, n. 4, p. 481–501, 2006.
O’BRIEN, J.A.; MARAKAS, G.M. Management Information Systems. Irwin: McGraw-Hill, 2007.
OUAKOUAK, Mohamed Laid; OUEDRAOGO, Noufou. The mediating role of employee strategic alig-nment in the relationship between rational strategic planning and firm performance: A European study. Canadian Journal of Administrative Sciences, v. 30, n. 3, p. 143–158, 2013.
PARK, S.; LEE, H.; CHAE, S.W. Rethinking balanced scorecard (BSC) measures: formative versus reflective measurement models. International Journal of Productivity and Performance Management, v. 66, n. 1, p. 92–110, 2017.
PAVLOU, P. A.; EL SAWY, O. A. From IT Leveraging Competence to Competitive Advantage in Turbulent Environments: The Case of New Product Development. Information Systems Research, v. 17, n. 3, p. 198–227, 2006.
PAVLOU, P. A.; EL SAWY, O. A. The “third hand”: IT-enabled competitive advantage in turbulence through improvisational capabilities. Information Systems Research, v. 21, n. 3, p. 443–471, 2010.
PEPPARD, J.; GALLIERS, R.D.; THOROGOOD, A. Information systems strategy as practice: Micro strate-gy and strategizing for IS. Journal of Strategic Information Systems, v. 23, n. 1, p. 1–10, 2014.
PERKINS, M.; GREY, A.; REMMERS, H. What do we really mean by “ Balanced Scorecard ” ? International Journal of Productivity and Performance Management, v. 63, n. 2, p. 158–169, 2014.
PHILIP, George. IS Strategic Planning for Operational Efficiency. Information Systems Management, v. 24, n. 3, p. 247–264, 2007.
POPADIUK, S. et al. Measuring Knowledge Exploitation and Exploration: An Empirical Application in a Technological Development Center in Brazil. Revista Espacios, v. 31, n. 3, p. 36, 2010.
POPADIUK, S.; BIDO, D. S. Exploration , Exploitation , and Organizational Coordination Mechanisms. RAC - Revista de Administração Contemporânea, v. 20, n. 2, p. 238–260, abr. 2016. Disponível em: <http://www.scielo.br/scielo.php?script=sci_arttext&pid=S1415-65552016000200238&lng=en&nrm=is o&tlng=en>. Acesso em: 13 fev. 2017.
PORTER, Michael E. Estratégia Competitiva: Técnicas para Análise de indústrias e da Concorrência. 7. ed. Rio de Janeiro: Editora Campus, 1986.
RAISCH, S. et al. Organizational Ambidexterity: Balancing Exploitation and Exploration for Sustained Per-formance. Organization Science, v. 20, n. 4, p. 685–695, 2009.
REEFKE, H.; TROCCHI, M. Balanced scorecard for sustainable supply chains : design and development guidelines. International Journal of Productivity and Performance Management, v. 62, n. 8, p. 805–826, 2013.
RINGLE, C.M.; BIDO, D.; DA SILVA, D. Structural equation modeling with the SmartPLS. Brazilian Jour-nal of Marketing, v. 13, n. 2, p. 53–76, 2014.
RINGLE, C.M.; SARSTEDT, M.; STRAUB, D.W. Editor´s Comments: A Critical Look at the Use of PLS--SEM. MIS Quarterly, v. 36, n. 1, p. iii–xiv, 2012.
RINGLE, C.M.; WENDE, S.; WILL, A. SmartPLS 2.0.M3. . Hamburg: SmartPLS. Disponível em: <http:// www.smartpls.de>. , 2005
ROUHANI, S. et al. The impact model of business intelligence on decision support and organizational bene-fits. Journal of Enterprise Information Management, v. 29, n. 1, p. 19–50, 2016.
SABHERWAL, Rajiv; CHAN, Yolande E. Alignment between Business and IS Strategies: A Study of Pros-pectors, Analyzers, and Defenders. Information Systems Research, 2001.
SCANDELARI, Vrn; CUNHA, Jc. Ambidestralidade e desempenho socioambiental de empresas do setor eletroeletrônico. Revista de Administração de Empresas, v. 53, n. 2, p. 183–198, 2013.
SEGARS, A.H.; GROVER, V.; TENG, J.T.C. Strategic information systems planning: Planning system di-mensons, internal coalignment, and implications for planning effectiveness. Decision Sciences, v. 29, n. 2, p. 303, 1998.
SEGARS, Albert H.; GROVER, Varun. Strategic Information Systems Planning Success: An Investigation of the Construct and Its Measurement. MIS Quarterly, v. 22, n. 2, p. 139–163, 1998.
BBR
15,5
459
SHOLLO, A.; GALLIERS, R.D. Towards an understanding of the role of business intelligence systems in organisational knowing. Information Systems Journal, v. 26, n. 4, p. 339–367, 2016.
SILA, Ismail. Examining the effects of contextual factors on TQM and performance through the lens of orga-nizational theories: An empirical study. Journal of Operations Management, v. 25, n. 1, p. 83–109, 2007. SINGH, Sanjay K.; WATSON, Hugh J.; WATSON, Richard T. EIS support for the strategic management
process. Decision Support Systems, v. 33, n. 1, p. 71–85, 2002.
TEUBNER, R. A. Theory, Practice, and Challenges for Future Research. Business & Information Systems Engineerin, v. 5, n. 4, p. 243–257, 2013.
TUSHMAN, M. L.; O’REILLY, C. A. Ambidextrous Organizations: Managing Evolutionary and Revolutio-nary Change. California Management Review, v. 38, n. 4, p. 8–29, 1996.
UOTILA, J. et al. Exploration, explitation, and financial performance: Analysis of S&P 500 corporations. Strategic Management Journal, v. 30, p. 221–231, 2009.
URBACH, N.; AHLEMANN, F. Structural equation modeling in Information Systems research using partial least squares. Journal of Information Technology Theory and Application, v. 11, n. 2, p. 5–40, 2010. WARD, J.M. Journal of Strategic Information Systems Information systems strategy : Quo vadis ? Journal of
Strategic Information Systems, v. 21, n. 2, p. 165–171, 2012.
WIELAND, A. et al. Statistical and judgmental criteria for scale purification. Supply Chain Management: An International Journal, v. 22, n. 4, p. 321–328, 2017. Disponível em: <http://www.emeraldinsight.com/ doi/10.1108/SCM-07-2016-0230>.
XUE, L.; RAY, G.; SAMBAMURTHY, V. Efficiency or Innovation: How Do Industry Environments Mode-rate the Effects of Firms’ It Asset Portfolios? [S.l: s.n.], 2012. v. 36.
XUE, Ling; RAY, Gautam; SAMBAMURTHY, Vallabh. Efficiency or Innovation: How Do Industry Environ-ments Moderate the Effects of Firms’ IT Asset Portfolios? MIS Quarterly, v. 36, n. 2, p. 509–528, 2012. YOSHIKUNI, A.C. et al. Strategy as a mediator of the relationship between use of is and business
performan-ce. REBRAE-Revista Brasileira de Estratégia, v. 7, n. maio/ago, p. 223–241, 2014.
YOSHIKUNI, A.C.; ALBERTIN, A. L. Model Analysis of the Relationship Between Strategic Organization Knowledge and the Use of Information Systems in Firm Performance in Brazil. Chinese Business Review, v. 13, n. 5, p. 301–319, 2014.
YOSHIKUNI, A.C.; ALBERTIN, L. A. IT-Enabled Dynamic Capability on Performance: an Empirical Study of. Rae, v. 57, n. maio-jun, p. 215–231, 2017.