How really reliable is Real World
Data? An implementation study in
diabetes and cardiovascular risk.
Universidade do Algarve
Gonçalo Piriquito de Almeida
Mestrado Integrado em Engenharia Eletrónica e
Telecomunicações
How really reliable is Real World
Data? An implementation study in
diabetes and cardiovascular risk.
Universidade do Algarve
Gonçalo Piriquito de Almeida
Mestrado Integrado em Engenharia Eletrónica e
Telecomunicações
Trabalho efetuado sob a orientação de:
Profa. Doutora Maria da Graça Cristo dos Santos Lopes Ruano
Prof. Doutor Rogério José Tavares Ribeiro
Declaração de autoria de trabalho
Declaro ser o autor deste trabalho, que é original e inédito. Autores e trabalhos consultados estão devidamente citados no texto e constam da listagem de referên-cias incluída.
(Gonçalo Piriquito de Almeida)
Copyright c
A Universidade do Algarve tem o direito, perpétuo e sem limites geográficos, de arquivar e publicitar este trabalho através de exemplares impressos reproduzidos em papel ou forma digital, ou por qualquer outro meio conhecido ou que venha a ser inventado, de o divulgar através de repositórios científicos e de admitir a sua cópia e distribuição com objetivos educacionais ou de investigação, não comerciais, desde que seja dado crédito ao autor e editor.
Acknowledgements
This study was possible due to the sponsorship of LINK - Linking Excellence in Biomedical Knowledge and Computational Intelligence Research for personalized management of CVD (cardiovascular disease) within PHC (personalized Health Care), with project identification: 692023 H2020, (2016-2019).
Also, a great appreciation for Associação Protetora de Diabéticos de Portugal (APDP) for providing access to their entire database, since without it this study would also been impossible.
Acknowledgements
First, I would like to show my deepest appreciation and gratitude to Profa.
Doutora Maria da Graça Ruano, not only for being and excellent teacher over the course of my entire degree, but a great advisor and friend, teaching me more than what I ever expected.
I would also like to express my gratitude to Prof. Doutor Rogério Ribeiro for taking with open arms in APDP and guiding me through my entire work in the clinic.
Also my deep appreciation for Engineers Frederico Palma and Luís Flores and the entire IT Department of APDP for helping me with technical issues, guiding me through their system and making me feel at home and in a friendly environment. This chapter of my life was not all about study, but also about friendship, comradeship and all kinds of life experiences. And for that I would like to thank all my colleagues and friends for taking this great journey alongside me.
The backbone of a good education and character is a good family, and for that I am grateful for all my family members that helped become who I am today. I am also grateful for my girlfriend, Rita Primor, who has shown me unconditional love and compassion, and empowered my with the strength needed to finish this major task.
Last, but certainly most important, I would like to thank my parents, José Almeida and Maria Piriquito Dores, for being my biggest role models, showing the importance of fighting and working for what we want to achieve, showing me the meaning of honesty, compassion and unconditional love. I am eternally grateful for the education that was given to me and the values that I will carry for the rest of my life. Without my parents, and all their efforts to provide me with all the great opportunities in life, none of this would be possible.
Resumo
Estamos a começar a viver numa era onde existe acesso a enormes volumes de dados provenientes de qualquer parte do mundo. Com tão fácil acesso a várias fontes de dados, autónomas e heterogéneas, é possível criar ferramentas e processos capazes de sumariar, correlacionar, e tratar grandes quantidades de dados, mesmo em tempo real. Isto no fundo reflete o conceito básico de exploração de dados reais, ou mineração de dados reais, traduzido da expressão inglesa que identifica esta ação: data mining, ou simplesmente MD (de Mineração de Dados) daqui em diante.O objetivo fundamental de MD é a exploração de grandes volumes de dados reais e extração de qualquer informação ou conhecimentos que sejam úteis em aplicações futuras.
O bom funcionamento de uma MD está dependente de um conjunto de dados que estejam devidamente bem acondicionados e tratados, capazes de serem interli-gados mesmo que seja através de bases de dados diferentes e autónomas. Sem a garantia que os dados estejam livres de erros, valores duplicados ou corrompidos, o resultados obtidos através do uso de MD podem perder fidelidade e propagar erros de elevada magnitude.
Na área da medicina em geral, inúmeros estudos e ferramentas têm sido elabo-rados com o intuito de assistir os médicos e clínicos em todas as suas tarefas (consultas, prescrições, diagnósticos) e fazer com que estas sejam cada vez mais rápidas e eficazes. Ao longo do tempo, a forma de estudo e criação de novas ferra-mentas para as várias áreas da medicina tem sido através de Testes Controlados e Aleatórios (TCA) ou também através de Estudos Comparativos de Eficiência (ECE), sendo que ambos são considerados o padrão no que toca à criação de novos estudos e ferramentas.
TCAs funcionam, tal como o nome indica, através de estudos realizados em pequenas populações de teste, escolhidos com determinadas características aleatórias, sob as quais são então produzidos testes em cenários totalmente artificiais e contro-lados. Devido à natureza dos TCAs, os resultados obtidos podem não possuir eficácia e resolução suficiente derivado do uso de um população muito pequena e
do uso de ambientes artificiais e controlados que podem não refletir na totalidade todos os pormenores da condição clínica que esteja a ser estudada, perdendo-se assim informação valiosa o que faz com que não haja sensibilidade a variações naturais e inerentes ao estudo em questão.
ECEs apresentam uma funcionalidade mais teórica que o tipo de estudo anterior, que se baseia mais em testes práticos. ECEs, como o nome indica, são estudo que efetuam comparações entre dois tipos de ferramentas, estudos, medicamentos, ou qualquer outro factor ligada à medicina. Dada a sua natureza mais teórica, os ECEs podem ser considerados mais fiáveis que os TCAs, mas para obter resul-tados igualmente complexos e específicos, tornam-se numa ferramenta bastante complexa e difícil de implementar. Por isso mesmo, ECEs não são ideias para casos mais específicos, pois podem criar resultados pobres em parâmetros importantes e portanto podem não refletir com exatidão as condições clinicas em questão.
Mais recentemente, MD tem vindo a ser introduzida nas áreas de medicina, e tem provado ser uma ferramenta bastante poderosa na criação e manipulação de grandes quantidades de dados. Graças ao seu estilo de funcionamento, é bastante útil na vanguarda de novos métodos e ferramentas.
Em relação a Doenças Cardiovasculares (DCV) e Diabetes Mellitus, ou simples-mente diabetes, existe bastante literatura que estuda a relação a estas duas patolo-gias, e hoje em dia é inegável que ambas afetam-se mutuamente e partilham vários factores de risco. A literatura demonstra uma grande ligação entre diabetes e hipertensão, e por sua vez, doenças relacionadas com a coronária são também afetadas pela diabetes diretamente e também indiretamente.
Vários trabalhos têm sido realizados com o intuito de utilizar MD em base de dados de várias áreas da medicina, no entanto, a comunidade na medicina em geral ainda não aceita totalmente a legitimidade dos resultados obtidos por via de MD, e estes muitas vezes ficam renegados a título de apoio a outros estudos ou como precursores da necessidade de estudos futuros consoante os resultados inesperados que são muitas vezes obtidos.
Existem já vários modelos estabelecidos para a utilização de MD em bases de dados provenientes de qualquer área da medicina, sendo os mais utilizados redes
neuronais, regressões logísticas ou árvores de decisões.
No entanto, muitos estudos preferem utilizar métodos manuais para a utilização de MD, devido à grande variância de tipos de dados que são encontrados em base de dados das áreas de medicina, pois torna-se mais eficaz o tratamento manual, do que a utilização de métodos estabelecidos que têm a necessidade de um pre-condicionamento dos dados que por vezes se torna bastante complexo e demorado. Tendo toda esta informação em conta, este estudo tem como objetivo o estudo da base de dados da Associação Protetora dos Diabéticos de Portugal (APDP) de modo a concluir o estado dos dados nela contida, para discernir se é possível a criação de novas ferramentas que auxiliem os clínicos no seu trabalho. A APDP possui uma base de dados completamente personalizada e gerida por um empresa dedicada, havendo sido criada uma Framework que gere tanto o Front Office como o Back Office (FO e BO), sendo estes respetivamente o software gráfico que os clínicos utilizam e a estrutura da base de dados interna onde a toda a informação é guardada.
Para tal, foi decidido que um estudo completamente manual seria mais indicado, ao invés de aplicar métodos já estabelecidos na industria, devido à natureza errática dos conjuntos de dados. Foi decidido também que não seria benéfico a utilização da Framework utilizada pela APDP devido a esta não conter as ferra-mentas diretas necessárias a este estudo e assim apenas adicionava mais complex-idade ao estudo sem acréscimo de benefícios. Por isso, foi utilizada apenas a linguagem SQL, sendo que a base de dados foi criada com o modelo de PostgreSQL, e deste modo todo o estudo foi feito através da manipulação e visualização puramente lógica e manual através de comandos SQL. Este processo demonstrou-se deveras exaustivo e complicado devido ao modo como a base de dados se encontra estrutu-rada, sendo que não apresenta um ambiente muito amigável no que toca à criação deste tipo de estudos.
Assim sendo, o primeiro passo foi o estudo aprofundado da estrutura e hierar-quia das tabelas que a base de dados contém, de modo a descobrir onde a infor-mação necessária a este estudo se encontra. Deste modo foi possível caracterizar todas as tabelas que contém dados relevantes ao estudo, e como estas importam
e exportam valores de uma para a outra.
Assim que a estrutura e hierarquia foram estabelecidas, foi então possível começar a retirar valores para prosseguir com o estudo. Mas antes, é necessário a definição de uma população fixa e representativa do estudo em questão. Dada a natureza deste tipo de estudos, os dados a considerar devem ser sempre o mais recente e atualizados possível para uma melhor representação do estado atual da população de diabéticos de Portugal. Tendo em conta que a APDP não possui uma regra de definição para considerar um paciente como ativo ou inativo na sua clinica, foi necessária a criação de uma regra para filtrar os pacientes deste modo. Foi considerado que para um paciente ser considerado ativo este deveria ter tido pelo menos uma consulta nos últimos três anos e não ter falecido entretanto. Foram então considerados 20,222 pacientes ativos e foi assim criada a população de teste que este estudo considerou.
A partir daí foi então possível começar a MD da base de dados de acordo com os dados que foram achados e a população definida. Foi definido que as tabelas que têm informação importante para este estudo foram as tabelas de Consultas, Fichas de Paciente e Exames Cardiovasculares.
A partir de comandos exaustivos de SQL, foram calculados os números e as suas distribuições de cada tipo de tabelas, e assim foram criados histogramas da distribuição do número de consultas por paciente da população, assim como número de fichas de paciente e número de exames realizados. Com estes valores um estudo estatístico da população foi feito para indicar as tendências dos diabéticos em termos clínicos. Depois, a correlação entre o número de consultas e o número de entradas de fichas de pacientes foi escrutinada, de modo a ter uma noção da percentagem e qualidade de preenchimento das fichas após uma consulta. O número de entradas de fichas de pacientes é sempre, em média, inferior ao número de consultas que um dado paciente possui, o que seria de esperar, pois deve-se ter em atenção que algumas consultas podem ser só de rotina e não adicionam qualquer informação nova ao estado do paciente. Foi concluído que a relação entre o número de consultas e o entradas de fichas de pacientes é linear.
complicações relevantes a este estudo, como é o caso de hipertensão, doenças da coronária, acidentes vasculares e cerebrais (AVC) ou enfartes do miocárdio.
Cerca de 78% da população apresenta hipertensão, 68% doenças da coronária, 10% AVC e 5% enfarte do miocárdio, valores estes que vão de encontro aos valores obtidos por vários estudos nacionais e internacionais, o que prova que a base de dados possui informação valiosa e que vale a pena a criação de estudos que a utilizem.
De seguida, foram considerados os exames de cardiologia. Existem vários tipos de exames praticados na clínica mas, tal como seria de esperar, o Eletrocardio-grama (ECG) é, de longe, o mais utilizado. Um número total dos vários tipos de exames e a sua consequente distribuição foram calculados relativos à população em questão.
Após todos os dados serem extraídos, tratados e escrutinados, chegou-se à conclusão que a base de dados possui muita informação que pode vir a ser de extrema importância para estudos futuros que auxiliem o desenvolvimento da medicina, neste caso em relação a indivíduos diabéticos. No entanto, a base de dados apresenta um nível de qualidade e consistência de dados não muito saudável para a prática de ditos estudos. Isto deve-se a vários fatores, sendo eles os mais importantes o facto de haver dados antigos (desde 1999) e que já começam se a demonstrar quase obsoletos, a existência de erros humanos devido à inserção de informação por parte dos clínicos e não de formas mais autónomas, e alguma falta de funcionalidades que previnem a inserção de dados vazios, corruptos, duplicados ou enganosos de qualquer forma.
Como tal, pode-se concluir que a base de dados tem imenso potencial, mas não antes sofrendo um correto condicionamento dos seus dados para se que seja possível no futuro a implementação de estudos diretos que tenham como base MD. Palavras Chave: Base de Dados, Mineração de Dados, Diabetes Mellitus, Patologias Cardiovasculares, Epidemiologia
Abstract
Real-world data (RWD) is, more and more often, being used in many medical areas, and data mining is becoming an important feature of any given study. The medical practice has been dominated by tools derived from controlled trials and focused studies, but now with the availability of RWD and information worldwide, new and better sets of tools are being created.
With this in mind, a study was created to verify if the internal database of a private clinic is suitable for data-mining with the main objective of creating more efficient tools capable of being helpful for the clinicians in the near future.
Working with a database that possesses records as late as 1999 poses many challenges. Besides requiring a constant update to include the new digital areas and recent clinical parameters, it is also necessary to evaluate the existence and impact of human errors and if other improvements are required to avoid lack or mistaken results on future database queries. After the establishment of relevant datasets and tables, a standardization of the data is required.
A systematic analysis of the database management was undertaken regarding data mining. The present study focused only on the database structure and content related with cardiovascular diseases of diabetic patients. For this goal, a thorough and exhaustive mining and understanding of the data had to be made manually using only pure logic and SQL queries to capture all the information needed.
Resultant analysis shows epidemiological results consistent with previous studies and concludes about the need of improvements of the database’s Front and Back offices. These improvements will facilitate future studies relating cardiovascular and diabetes pathologies. Besides the existence of a huge amount of valuable clinical information, usage of the database’s data for general data-mining becomes a difficult task due to its unfriendly querying structure.
Keywords: Database, Data Mining, Diabetes Mellitus, Cardiovascular Patholo-gies, Epidemiology
Contents
Declaração de autoria de trabalho i
Acknowledgements ii
Resumo iv
Abstract ix
List of Figures xiv
List of Tables xv
1 Introduction 1
2 What to look for 5
3 Structure of the existing database 8
3.1 Identification of relevant datasets and population . . . 9
3.2 Analyzing the identified datasets . . . 15
3.2.1 Patient’s appointment records . . . 15
3.2.2 Patient’s medical records . . . 17
3.2.3 Patient’s cardiology exams records . . . 22
3.2.3.1 Electrocardiogram (ECG) and its elements . . . 25
3.3 Correlation between the three main different datasets . . . 29
4 Mining of the database content 33 4.1 Correlation between the Front and Back offices in the determined datasets . . . 34
4.2 Manual assessment of the situation of the datasets . . . 38
4.3 Standardization and conditioning of the datasets . . . 40
5 Analysis of the results 41 5.1 Treatment of the Medical Records tables . . . 41
5.1.1 Treatment of the correlation between Medical Records and Appointments . . . 44 5.2 Treatment of the Cardiology Exams tables . . . 57
6 Conclusions 59
6.1 Concluding remarks . . . 59 6.2 Future research . . . 61
List of Figures
1 Diagram representing the hierarchy of the tables considered for this
study in their original SQL names . . . 10
2 Diagram representing the only subtable that “car_ecg" has, which is “car_ecg_elementos" . . . 11
3 Histogram of ages within the population . . . 14
4 Histogram of the number of Cardiology appointment entries per patient . . . 16
5 Zoom of the histogram represented in figure 4 with only the first 100 pairs of values contained in figure 4. . . 17
6 Current state of positively filled (y), negatively filled (n) or unful-filled (Null) fields of the Cardiology table . . . 20
7 Current state of positively filled (y), negatively filled (n) or unfilled (Null) fields of the Complications table . . . 21
8 Histogram of the number of Cardiology Exam entries per patient . . 23
9 Number of entries in each type of exam, per patient and per type of exam . . . 24
10 Percentage of patients with at least one exam . . . 25
11 Histogram of the number of ECG per patient . . . 26
12 Histogram of the number of ECG-Elements per patient . . . 28
13 Distribution of percentages of patients with medical record entries relative to 1 appointment . . . 30
14 Distribution of percentages of patients with medical record entries relative to 2 appointments . . . 30
15 Distribution of percentages of patients with medical record entries relative to 3 appointments . . . 31
16 Distribution of percentages of patients with medical record entries relative to 4 appointments . . . 31
17 Distribution of percentages of patients with medical record entries relative to 5 appointments . . . 32
18 Cardiology tab in the graphic interface of appointments . . . 35 19 Complications tab in the graphic interface of appointments . . . 36 20 Acute Complications tab in the graphic interface of appointments . 36 21 Percentage of patients for each type of table, inside the population . 37 22 ECG Exam tab in the Cardiology Exams graphic interface . . . 38 23 Illustrative diagram of how the Medical Record tables and
respec-tive subtables have their data stored and connected . . . 39 24 State of health of the Cardiology table fields disregarding empty
entries . . . 42 25 State of health of the Complications table fields disregarding empty
entries . . . 43 26 Curve Fitting of the percentage of patients with medical record
entries relative to 1 appointment . . . 45 27 Curve Fitting of the percentage of patients with medical record
entries relative to 2 appointments . . . 46 28 Curve Fitting of the percentage of patients with medical record
entries relative to 3 appointments . . . 47 29 Curve Fitting of the percentage of patients with medical record
entries relative to 4 appointments . . . 48 30 Curve Fitting of the percentage of patients with medical record
entries relative to 5 appointments . . . 49 31 Curve Fitting of the average number of medical records versus the
number of appointments, up to 20, with Exponential Fitting . . . . 50 32 Curve Fitting of the average number of medical records versus the
number of appointments, up to 20, with Polynomial (Linear) Fitting 51 33 Theoretical and approximated illustration of an Exponential Fit
and Polynomial (Linear) Fit for the relation of the average number of medical records versus the number of appointments . . . 52 34 Curve Fitting of the average number of medical records versus the
35 Curve Fitting of the average number of medical records versus the number of appointments, up to 50, with Polynomial (Linear) Fitting 54 36 Curve Fitting of the average number of medical records versus the
number of appointments, up to 250, with Exponential Fitting . . . 55 37 Curve Fitting of the average number of medical records versus the
number of appointments, up to 250, with Polynomial (Linear) Fitting 56 38 List of entries with only the Observations field filled . . . 58 39 List of entries with no Observations but with the remainder fields
List of Tables
1 Explanation of the names and meanings of the tables chosen for
this study . . . 12
2 Cardiology table and its respective types of data . . . 18
3 Complications table and its respective types of data . . . 19
4 Acute Complications table and its respective types of data . . . 19
5 Number of entries on Tables associated to the most recent appoint-ment (from a total of 20222) . . . 40
1
Introduction
We are starting to live in an era in which we have access to enormous volumes of data from all around the world, with 2.5 quintillion bytes of new data being created every day. With access to multiple, heterogeneous and autonomous sources, it is possible to create processes that summarize and cross-reference big quantities of data, even in real-time. That is called Big Data processing, or Big Data Mining (BDM) or just data mining. The fundamental goal of BDM is to explore the large volumes of data and extract useful information or knowledge for future actions [1]. The main research of the future will likely be data driven and even made in a completely autonomous way with the assistance of the ever-growing computational intelligence [2].
In a more general setting, data mining depends on a conditioned sample of data that is correlated with multiple sources of information, needing highly efficient database merging operations in order to function properly. Without accurate identification of duplicated information, frequency distributions and various other aggregations, false or misleading statistics may be produced leading to untrust-worthy results. Errors due to data entry mistakes, faulty sensor readings or malicious activities provide scores of erroneous data sets that increase errors in each subsequent generation of data [3].
In medical fields, many studies, tests and tools have been created in order to assist clinicians in their actions (prescriptions, diagnostics, decision-making and interventions). The most used form of data creation and processing has been, for many years, Randomized Controlled Trials (RCT) and Comparative Effectiveness Research (CER) and both have become the standard for medical related studies [4]. RCTs work by setting trials in controlled environments, with randomized small populations with controlled parameters. Given this method of data acqui-sition, the results may lack accuracy because of such a small population used in an unnatural controlled environment, resulting in information that cannot reflect accurately the medical conditions that are being studied. CERs could be consid-ered slightly more reliable in that regard, but to achieve the best results possible,
it becomes a rather troublesome type of tool [5]. Therefore, these type of studies are not ideal for case-specific diagnostics because they can produce data lacking (or sometimes having excess) parameters, which cannot reflect what happens with the medical condition at hands [6].
In recent years, Real-World Data (RWD) has shown great efficiency in the creation of statistical data, proving to be a very powerful tool in many areas, with general medicine being one of them. RWD is useful in several phases of product development, since it helps reflecting priorities to ensure a well-rounded clinical development that includes not only RCTs but also a more pragmatic research in real clinical practice. Recent studies show that RWD is becoming crucial to decision-making when used in conjunction with clinical trials, with key medical stakeholders pushing more for the use of these types of study. Therefore, medical studies seem to have progressively more room to adopt Non-Interventional Studies (NIS) as the key method in gathering this type of evidence. As NIS generally take place in a heterogeneous population and are conducted over a long period, they are considered naturalistic, whether prospective or retrospective, and allow for an unbiased view of real-world outcomes [6].
Even when RWD is used for the creation of predictive models or other tools, most of the times these are simplified, in terms of data and used variables, and therefore cannot compete fairly with RCT derived studies. That happens due to the fact that computing a vast amount of complex and time variable data is proven to be a very difficult task, and more often than not is discarded or heavily simplified [7]
There is a vast literature that studies the relationship between Diabetes Mellitus and Cardiovascular Diseases (CVD) and it is commonly known that both condi-tions share critical parameters that increase the risk, such as age, gender, obesity, food habits, and others [8]. Diabetes has been reported to be a precursor of cardiovascular morbidity and mortality in general. The relative impact is greater for intermittent claudication (IC) and congestive heart failure (CHF), but coronary heart disease (CHD) is frequently asymptomatic and therefore misdiagnosed [9]. Also, diabetes affects tremendously the patient’s probability of having
hyperten-sion, which could be considered the other main precursor for more complex and mortal CVDs [10].
For each of the cardiovascular diseases (CVDs), morbidity and mortality are higher for a diabetic person than for a non-diabetic person. After adjustment for other associated risk factors, the relative impact of diabetes on CHD, IC, or stroke incidence is the same for women as for men, but for CVD death and CHF it is greater for women. Although, in a more general view, we can assume that CVD mortality is the same across both genders with diabetes mellitus [11, 12].
A few studies have been carried out with the implementation of data mining techniques in medical databases, even focusing of diabetic populations [13]. Most of these studies have the same ultimate goal of helping the diagnose of diabetes and/or CVDs, assisting the clinicians in doing so and at the same time helping patients gaining access to early diagnoses and respective treatment, since these tools could prevent the usage of various and extensive tests and practices that ultimately bear greater costs for the patient in question [14].
Most of said studies implement relatively simple data visualization, correlation analysis since these types of data mining are still in its infancy. But still, some studies already went slightly further and implemented neural network analysis in order to assist in the treatment and classification of data and resulting conclusions [15]. Other studies chose to create this concept in data gathered from other studies instead of full-fledged databases, proving also the importance of gathering all the results made so far with the help of RCTs or CERs and turn them into new and improved tools for the respective medical areas [16].
Despite some data mining models already being established, many studies still choose to approach data mining in a more manual way, meaning that a personalized human assessment is made in order to perform the necessary tasks of data mining [17]. Regardless, logistic regressions, artificial neural networks or decision tree models are already widely used in data mining [18, 19]. Other studies even make use of physical equipment that records patient’s data, instead of gathering said data through a established database, allowing the free manipu-lation of variables and parameters that are considered [20].
It is already known that these studies create new sets of data and conclu-sions that otherwise could not be achieved. Still, they are not widely accepted in the medical community, and for now are considered more of a tools to instigate new further research, since some of the conclusions that these studies make are controversial comparing to the established clinical meta [13, 21].
In light of BDM and RWD, a study will be made, concerning CVD in diabetic patients, with the use of data provided by the private database of a clinic for diabetics, in Lisbon, Portugal, called Associação Protetora dos Diabéticos de Portugal (APDP). Records of appointments and cardiology exams will be considered in order to create a model that studies the general population of APDP in regards to cardiovascular conditions, to further help the clinicians in the area of cardiology, when treating diabetic patients.
This report is organized as follows. Section 2 explains what to look for in the database and which topics and parameters to consider in order to achieve the main goal of this study. Section 3 describes the study of the current state and structure of APDP’s internal database and the identification of relevant datasets. In Section 4, the undertaken manual assessment and respective mining of the datasets is explained. Section 5 is comprised with the analysis of all the data addressed in the previous sections in order to obtain concluding results. And in Section 6 the results obtained will be scrutinized to enable the assessment of mining finally the database in terms of what it takes to provide the kind of data needed for the future creation of an improved tool aiming to help the clinicians battle CVDs in diabetic patients.
2
What to look for
Before we dive into the database itself, first, a basic understanding of the matter at hands is required. As the title suggests, the main focus of this study is CVDs in a diabetic population, so the main focus is to detect data relevant to Cardiology and focus on parameters that are suited for this type of study. Other peripheral vascular conditions will be disregarded in order to focus more on the conditions closely related to the heart (Cardiology).
People with diabetes often have distinct physical and metabolic profiles. Diabetic individuals are considerably heavier than their non-diabetic counterparts, and weight differences between the groups persist even within old aged patients. Apart from elevated Body Mass Index (BMI), diabetic individuals tend to have an android fat distribution pattern, with accumulation of fat in the abdomen [22]. It has been postulated that abdominal visceral fat is involved in glucose dysregulation and plays a much greater role in the development of diabetes than subcutaneous fat. In epidemiological studies, however, it is not possible to distinguish these two fat compartments by using conventional abdominal girth measures such as waist circumferences. In addition to overall and abdominal obesity, people with diabetes exhibit a pattern of dyslipidemia characterized by elevated triglycerides, low or high levels of high-density lipoprotein (HDL) cholesterol and small, dense low-density lipoprotein (LDL) particles [23].
Diabetes mellitus and CVDs share several important characteristics. The occurrence of both conditions increases with age, both being associated with an adverse lipid profile, obesity, and a sedentary lifestyle. The risk of both patholo-gies can be reduced by lifestyle modifications of common risk factors [22]. This is currently being studied via cohort trials, where diabetic patients are accom-panied in weight loss and physical exercise regimes, and reduction in diabetes, hypertension and lipid-lowering medicines was even achieved [24]
Appearing prior to frank diabetes, this set of physical and metabolic charac-teristics (sometimes accompanied by hypertension, hyperuricemia, and abnor-malities in hemostatic factors) has been termed the metabolic syndrome, although
these features persist following diagnosis of diabetes. A recent study showed an association between the metabolic syndrome and ischemic heart disease, further highlighting the importance of this set of metabolic disorders on CVD risk [25]. Also it was found that the rate of coronary related deaths is similar in diabetic patients with no history of myocardial infarction and in non-diabetic patients with previous myocardial infarction [26].
Diabetes is associated with an unfavorable distribution of CVD risk factors among people with existing diabetes, and unfavorable CVD risk factors are also present prior to diagnosis of diabetes. Prospective epidemiological studies of individuals at risk for CVD yield consistent temporal relationships between diabetes and both incident CVD and mortality [27].
The importance of diabetes mellitus, both type 1 and type 2, in the epidemi-ology of CVDs should not be undermined. About one third of acute myocar-dial infarction patients have diabetes mellitus, the prevalence of which is steadily increasing. Statistics show that the decrease in cardiac mortality in patients with diabetes mellitus is lagging behind that of the general population. Early diagnosis of diabetes is crucial. Even in healthy individuals, hyperinsulinemia induced hypoglycemia can prolong the QTc interval and decrease T-wave area and amplitude in Electrocardiogram (ECG) results [25].
Many people with diabetes often manifest a diabetic cardiomyopathy. This is characterized by diastolic dysfunction, with associated prolongation of diastolic relaxation and cytosolic calcium removal. The diabetic heart is characterized by myocardial fibrosis, in these cases. Other factors that coexist with diabetes, such as hypertension and dyslipidemia, seem to accelerate the development of diabetic cardiomyopathy. The presence of CHD and ischemia are also likely to accelerate the development of severe diabetic cardiomyopathy [28].
Genetic variants in previously identified candidate genes may be associated with QT interval duration in individuals with diabetes. It was found, by Europe and Diabetes study and Insulin-Dependent Diabetes Mellitus Complications Study (EURODIAB IDDM), that QT dispersion is the most important independent predictor of total mortality and also an independent predictor of cardiac and
cerebrovascular mortality. The EURODIAB IDDM investigated 3250 type 1 diabetes patients with an average diabetes duration of 30 years; the prevalence of left ventricular hypertrophy was found to be 3 times greater than that reported in the general population of similar age. During follow-up, regression or persistent absence of left ventricular hypertrophy on the ECG during antihypertensive treat-ment was associated with a lower rate of new-onset diabetes mellitus [25].
On fetal ECG, ST depression was significantly more prevalent in fetuses of diabetic mothers. Also, a study following children and adolescents aged 7 to 20 years with poor glycemic control, with signal-averaged ECG, found a prolonged filtered QRS duration and a significantly low root mean square voltage, demon-strating subclinical cardiac impairment [25].
Given all these studies and information regarding diabetes mellitus and CVDs, we can predict how relevant and important data could be extracted from the database. Patient information such as age, gender, weight, type of diabetes and how long have been diagnosed are very important. For that, data should be retrieved from the appointments made over time in the clinic. Also, the appoint-ments information should help in establishing if there are any suspicions, diagnos-tics or treatments when it comes to CVDs.
Another important area is the results from ECG exams, since it is the most common type of exam in the cardiology area. Multiple studies show that the ECG is a powerful tool for an early diagnose of most cardiac impairments related to diabetes. Other types of exam (such as coronary exams, effort trials or simple arterial pressure) should also be very helpful since they focus on relevant areas for this study. Statistical studies, like the number of ECGs a patient has and how far apart they are, are expected to provide future profiles and prevention tools.
3
Structure of the existing database
The first step in order to utilize the database in the future, is to understand on what it is comprised of. APDP has a vast and rich background, being created in 1926. Since then, it has evolved to the be one of the best clinics for diabetics in terms of assistance, investigation and education. Their proprietary internal database possesses records all the way from 1999 to the present day. Although being a well composed and vast database, the fact that it possesses records as old as from 1999 could bring some concerns about its reliability, especially considering that new exams, styles of appointments and prescriptions that have been imple-mented in the medical practice since 1999, with new fields of data being created after some patient records already being established. This issue could bring, in the future, more instability when it comes to standardization of the database for future developments.
Another preliminary setback in this study will be the human factor. Most of the times, we are dependent on a clinician or technician when it comes to stored param-eters in the database, wether it is via paper or digitally. And, as it happens in many other areas, whenever data is inputed by humans, a variety of erros may occur due to misinterpretation of available information, misfiled or corrupted digital records or even accidentally erased datasets. This normally happens because of a vast number of people working with a database at the same time or in shifts where information can be lost from person to person, or different individual may gain different filling habits over time. And seeing that companies are not yet prepared to offer a thorough instruction on better methods for filling their database, this issue still represents a major setback in the creation of uniform data that could used in BDM operations.
Furthermore, according to the specific medical field (cardiology, ophthalmology, neurology, etc.) the external machines inputing data to the database differ consid-erably. For example, the ECG machine is capable of transmitting directly the gathered information to the database, including the produced graphs. However, if multiple ECG machines, differently aged or with different models exist, the
protocols are different requiring different database entries. Another problem may arise when the medical instruments do not input data directly to the database, requiring human intervention for that. In this latter case, it is unpredictable if the inexistance of expected data is attributed to human mistake or to instrumental omission, or even to the fact that it has been considered irrelevant.
3.1
Identification of relevant datasets and population
With a database so vast, with over a million appointment entries, relevant datasets must be established and a fix population must be defined.
Considering that this kind of study has no solid precedents and is pioneer in its own way, there is no documentation, guidelines or programs that specify how to proceed, and to help matters worse each medical data is created and treated differently. With this in mind, the database will have to be thoroughly analyzed by hand to be able to understand how each table relates to other tables, were is the information that is needed and how the data is stored in the database.
In this particular case, an external company created and manages the database of the clinic in question. To do so they created a personalized Java Framework that manages both the Front Office and the Back Office, being these two the software and all of its features that the clinic personal uses and the raw database itself. For this study, it is not worth it to dive into the Framework, so all data had to be managed by hand using pure logic to connect all of the SQL tables that were necessary and using SQL queries to fetch values. The database in question was created using PostgreSQL, a certain type of SQL language/environment. Although the SQL language is quite simple and the golden standard for databases, the main struggle is to completely understand the hierarchy of each table, how values are imported and exported from one table to another and what every field means with their original SQL name, given by the company that manages it.
First, data regarding general appointments, medical records and other general information was discovered. Then, an effort was made to find all the relevant data to Cardiology in general. At this point, it was possible to connect each
table in terms of imported and/or exported values from table to table. With that information we can actually determine the hierarchy of the tables and how relevant information flows through the entire database.
Figure 1: Diagram representing the hierarchy of the tables considered for this study in their original SQL names
Figure 1 shows the hierarchy of the tables that will be considered for this study in their original SQL name, created by the company responsible for the database of the clinic in question. Also, it was noticed that “car_ecg" had another subtable that stored even more data regarding Electrocardiogram (ECG) Exams, so the
next figure shows the relationship and hierarchy of these tables in question:
Figure 2: Diagram representing the only subtable that “car_ecg" has, which is “car_ecg_elementos"
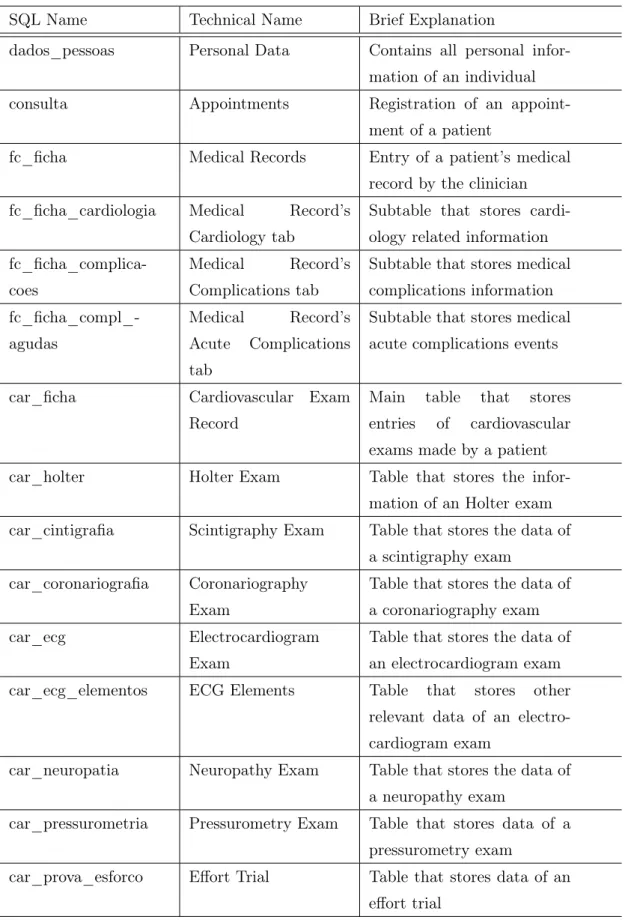
For an easier understanding of which technical name relates to which given name, and for the purpose of the future of this work, a table was created that relates the original names of the tables to their supposed technical names with a brief explanation for a proper comprehension of the entire data at hand.
Table 1: Explanation of the names and meanings of the tables chosen for this study
SQL Name Technical Name Brief Explanation
dados_pessoas Personal Data Contains all personal infor-mation of an individual
consulta Appointments Registration of an
appoint-ment of a patient
fc_ficha Medical Records Entry of a patient’s medical
record by the clinician fc_ficha_cardiologia Medical Record’s
Cardiology tab
Subtable that stores cardi-ology related information
fc_ficha_complica-coes
Medical Record’s Complications tab
Subtable that stores medical complications information fc_ficha_compl_-agudas Medical Record’s Acute Complications tab
Subtable that stores medical acute complications events
car_ficha Cardiovascular Exam
Record
Main table that stores entries of cardiovascular exams made by a patient
car_holter Holter Exam Table that stores the
infor-mation of an Holter exam car_cintigrafia Scintigraphy Exam Table that stores the data of
a scintigraphy exam car_coronariografia Coronariography
Exam
Table that stores the data of a coronariography exam
car_ecg Electrocardiogram
Exam
Table that stores the data of an electrocardiogram exam
car_ecg_elementos ECG Elements Table that stores other
relevant data of an electro-cardiogram exam
car_neuropatia Neuropathy Exam Table that stores the data of a neuropathy exam
car_pressurometria Pressurometry Exam Table that stores data of a pressurometry exam
car_prova_esforco Effort Trial Table that stores data of an effort trial
As we can see in figure 1, the main SQL table that is created for every individual is called “dados_pessoas" or personal data. This table stores all the information of a patient, like age, address, full name, id number, contacts, etc.. Then, the three tables relevant for this study, appointments, patient medical records and cardio-vascular exams, with the raw SQL names of “consultas", “fc_ficha" and “car_-ficha", respectively derive from the main table “dados_pessoas". And in turn, “fc_ficha" and “car_ficha" have sub-tables, with the relevant ones listed in the figure. Initially, data will be treated separately between these three main sources and afterwards all the information will be conjoined into a set of conclusions.
Only the Personal Data table shows personal information regarding a certain patient. All other tables only refer to an integer identification number that then relates to a certain Personal Data entry where the name and age, for example, can be found, being this the reason why in figure 1 we see ultimately every table leads to the Personal Data table. Consequently, every subtable has an integer identification number that relates to the respective parent table. For example: a Complication table entry has an ID that relates to the correct Medical Record table entry that in turn has a patient’s ID that relates to a Personal Data table entry where the patient’s personal information is stored.
After that, a specific population had to be established, since it is virtually impossible to consider all records of the database, not just because it would be immensely complicated to process such an amount of data, but also because many patients and their respectful data is corrupted or obsolete, especially considering that the database has records as old as from the year 1999. Because of such old information in the database, it is very likely that some patients have changed their health status since their last contact, and some data can be obsolete for the present day. Considering that this study is aiming for the creation of a new predictive tool for the near future, it was considered for the sake of present project that the dataset reflects the current situation of a main diabetic population. Therefore, all the data to be used must be considered recent and active. The best way to solve this issue is to assume a sub-sample of the whole population composed of only active patients, that can reflect, statistically speaking, the entire population
of diabetic patients in APDP, that in turn, is considered representative of the Portuguese diabetic population.
Since there is no system or documented set of rules that consider a patient active or not, for the purpose of this study it was considered that in order for a patient to be active, his last appointment record must have been made in the last three years, and the patient must be still alive.
For this set of rules, a population of 20,222 patients was created with ages ranging from 4 to 103 years old, with a sample mean of 63.4, median value of 50, sample mode (most frequent age) of 69 and a standard deviation of 32.7, as may be seen in figure 3, where the histogram of ages among the studied population is represented.
Figure 3: Histogram of ages within the population
In the next subsections, the database will be studied and relevant tables contained inside of appointments and cardiology exams will be considered for further analysis.
3.2
Analyzing the identified datasets
Now that we have established a fixed population and also what kind of datasets to look for, we can dive into the three main datasets represented in figure 1, which are Appointments, Medical Records and Cardiovascular Exams.
3.2.1 Patient’s appointment records
When it comes to the information present in the SQL database that derives from patient appointments, there are a few details to be considered. Due to its nature, appointments tend to reflect better the current state of a patient, since for a medical record or an exam to be produced, there should be a prior appointment during which the clinician gathers enough information to require said examination or to fill an accurate medical record.
The appointments table possesses many fields, most of them being obsolete for this study, with the most important fields being date, appointment status and speciality ID. The last field corresponds to an integer that relates to a certain speciality, with the integer 2 being Cardiology, 0 being Diabetology, 10 Nursery, and so on.
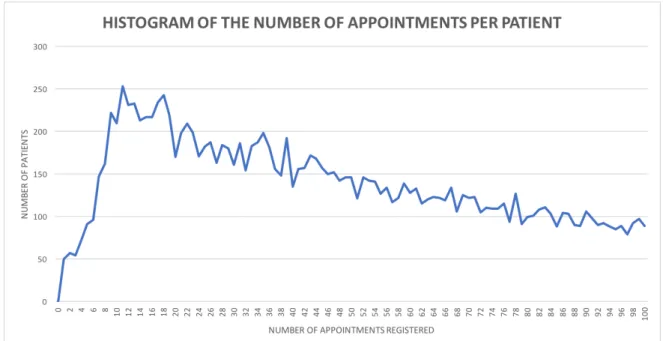
Related to this population, there are 1,646,613 appointments. But considering the basis of this study, only the appointments with the speciality Cardiology are selected, with a total of 64,834 entries regarding Cardiology. Figure 4 shows an histogram of the number of Cardiology appointments per number of patients encountered among these 64,834 entries.
Figure 4: Histogram of the number of Cardiology appointment entries per patient
It is noticed, in figure 4, that as the number of Cardiology appointments per patient increases, the number of patients decreases exponentially, with the most common number of Cardiology appointments being 11, with 253 patients having that amount of appointments. Fortunately, the number of patients with zero appointments is actually zero, which means that all patients possess at least one appointment, which confirms that there are no major data error in this table. A zoomed graph of the histogram (see figure 5) is made with the first 100 pairs of number of appointments versus the number of patients, to have a better under-standing of the distribution of the number of Cardiology appointments per patient:
Figure 5: Zoom of the histogram represented in figure 4 with only the first 100 pairs of values contained in figure 4.
3.2.2 Patient’s medical records
Quite often, and considered normal practice in most scenarios, to complement the appointments, medical records are created. A medical record is an instance where data regarding a certain patient is collected from appointments and regis-tered.
There are 707,726 patient’s medical record entries in the population, which comparing to the total number of overall appointments is less than half. This evidence shows that not every appointment corresponds to the creation (or update) of a medical record. Even though it is understandable that not every clinical speciality needs a medical record. Still the huge diference between the number of appointments and medical records is alarming.
The SQL tables, related to patient’s medical records, containing the informa-tion concerned with this study are:
• Cardiology table; • Complications table;
• Acute Complications table;
• Appointments table (Observations field).
Each of these tables is studied in terms of its content and usability, to determine which type of data is usable and how to proceed and analyze it afterwards. It was noticed that the observations field of the patient’s medical records table were stored in a different SQL table, containing only the medical record ID and the respective text field. Table 2 lists the existing types of data, for each SQL table listed above, excluding the Observations (for simplicity).
Table 2: Cardiology table and its respective types of data
Field Type of Data Myocardial infarction Yes/No Surgery Yes/No Angioplasty Yes/No CVA/TIA Yes/No Coronary Yes/No Cardiac insufficiency Yes/No Arterial hypertension Yes/No Carotid stenosis Yes/No Observations Text field
To be noticed that in table 2 there is a field denominated CVA/TIA. That stands for Cerebrovascular Attack, more commonly known as stroke, and Transient Ischemic Attack.
Now that the functionality of the SQL tables is known, we can procede to analyse the values, listed in tables 2, 3 and 4.
Table 3: Complications table and its respective types of data
Field Type of Data Ophthalmologic Yes/No Cardiologic Yes/No Podological Yes/No Nephrological Yes/No Neurological Yes/No Peripheral vascular disease Yes/No Others Text field
Table 4: Acute Complications table and its respective types of data
Field Type of Data
Cause 0 - Hyperglycemia 1 - Hipoglycemia 2 - Other 3 - Ketosis Year Integer Text Text field
Figures 6 and 7 show the current state in which each field of the Cardiology and Complications tables are filled. The names of each field are in their original Portuguese SQL column name, but in the same order as in tables 2 and 3. A positive value (y) means that the clinician considers the patient to have that particular pathology, and a negative value (n) means that clinically the patient did not present those symptoms, and an empty value (Null) means that there was not enough information for the clinician to fully consider if the patients indeed has that particular pathology or not, or, it might represent absence of database annotation.
Figure 6: Current state of positively filled (y), negatively filled (n) or unfulfilled (Null) fields of the Cardiology table
Figure 7: Current state of positively filled (y), negatively filled (n) or unfilled (Null) fields of the Complications table
It was noticed that the Acute Complications table has a different behavior from the others. Other tables register entries of some sort, inputed, created or overseen by a clinician or technician, whereas the Acute Complication table serves as a log for medical events in the patient’s life, like an event of hyperglycemia for example, as seen in table 4 with the different options of medical events being hyperglycemia, hypoglycemia, ketosis or other.
3.2.3 Patient’s cardiology exams records
Another section of the database that is highly important for this study is the Cardiology Exams tables. In this area, there is a general sheet that relates to an appointment made for a Cardiology exam. This works in the same manner as studied in the previous section, where we discussed the general appointments table and how the other tables are related to it. In the case of cardiology exams records, the following tables are connected to the main Cardiology Exam table:
• Scintigraphy table; • Coronariography table;
• Electrocardiogram (ECG) table; • Echocardiogram table;
• Holter table; • Neuropathy table; • Pressurometry table; • Effort Trial table; • Reports table.
As we can assert from this list, each table that derives from the main Cardiology exam table is related to a specific type of exam. Therefore, it is possible for each patient to have at least one or none exams. This functionality is similar to the previous Appointments table, where a patient can have multiple instances of the same event.
In our population of 20,222 patients, there are 21,698 entries in Cardiology Exams Table, which closely represents the number of cardiology exams made by the population. 12,911 Patients have at least one Cardiology Exam Table entry, meaning that 63.8% of our population has at least one Cardiology Exam, as can
be observed in figure 8. This is a very important value, for it can describe the percentage of the diabetic population that was already been checked for CVDs.
Figure 8: Histogram of the number of Cardiology Exam entries per patient
Following this line of thought, a deeper study of the number of ECGs could give us an overall assessment of the situation of each patient, considering that this type of exam is the most commonly used and, most of the times, the first tool used when there are CVD suspicions. Given the number of ECGs, their time span and the patient’s age it would be possible to create a simple health profile that would study the possibilities of CVDs in our population.
So the next step was to study each type of exam related to the Cardiology main table. This time, the parameters of each exam are far too many and complex to list in this document, requiring a deep study and understanding of how they are captured and documented. For now, a statistical study of the exam will suffice for the main purpose of this document.
As expected, the total number of entries does not specify the exact number of patients that have a certain type of exam made. This is due to the fact that a
patient can have multiple instances of each exam. Therefore, a preliminary search filtering by patient and by exam is necessary to gain a broad notion of the number of exams per patients, as we can visually prove in figure 9.
Figure 9: Number of entries in each type of exam, per patient and per type of exam
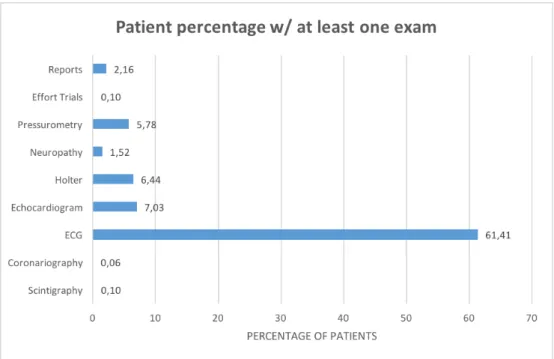
If we analyze separately the percentage of patients with one or more exams, we can see in figure 10, the majority of exams are ECGs, confirming that this type of exam is the most commonly used, and probably the first one when there is suspicion of CVDs in a certain patient. Apart from the ECG, the other exams show low results, indicating that they are more expensive and/or complex, or more specific to a certain type of cardiovascular condition. These numbers can further help the creation of generic profiles in terms of different types of cardiovascular conditions, in future developments of this study.
Figure 10: Percentage of patients with at least one exam
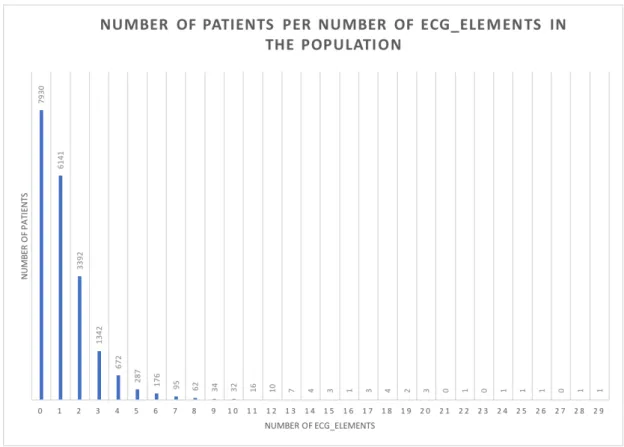
3.2.3.1 Electrocardiogram (ECG) and its elements
Since the ECG is, by far, the most popular type of exam, a more in depth study is required. This type of exam has a particularity that no other has, which consists of having an auxiliar table called ECG-Elements. This table serves as a field of the ECG exam, listing possible diagnostics taken from the ECG. In figure 22 (section 4) all the fields of the ECG can be seen, with a list of possible, numbered, diagnostics on the right side of the interface. That list is stored in the ECG-Elements table, with a single ECG being able to have multiple entries in ECG-Elements.
In a way, it can be said that the number of ECG-Elements possessed by an ECG entry is the number of medical conclusions derived from that ECG. Because of this, even if an ECG entry is completely empty it can still have valuable information because of its ECG-Elements entry or entries. Therefore, empty entries cannot be removed for they may have related and relevant information elsewhere.
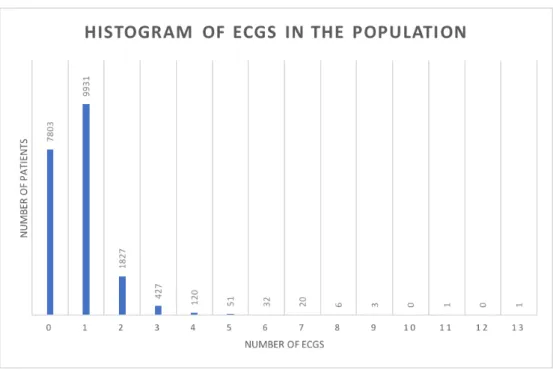
Figure 11: Histogram of the number of ECG per patient
As mentioned earlier, a completely manual assessment was made to gather all the information that could be relevant regarding ECG in our population. SQL queries were made to find the number of ECG and ECG-Elements entries per patient in our population, and from there all kinds of relevant percentages can be calculated. Figure 11 shows the resulting histogram of the number of patients versus the number of ECG entries.
Of the 16,032 ECG entries, 783 are completely empty, but it could still mean that they have entries in ECG-Elements. Only 127 ECG entries show zero entries in ECG-Elements, and even those cannot be discarded without a complete study on whether they show any type of information elsewhere or not. This is due to the fact that the information inputed in these tables is erratic and non-linear, possibly due to different ECG machines, different technicians or even lack of values or information. Since these causes cannot be strictly determined without a thorough evaluation of the technician’s methods and practices, the data cannot be treated and standardized. Still, a basic statistical study can be achieved, and this study only focuses on that in terms of ECGs, or general cardiology exams.
• ECG ID;
• Cardiology sheet ID; • Rhythm; • HVE; • EM; • Anterior ischemia; • Inferior ischemia; • Lateral ischemia; • BCRE; • Observations; • Normal; • Machine’s XML.
The parameter "Machine’s XML" is the field where the graph and other infor-mations created by the ECG machine are exported to. It is known that more than one type of machine is used in ECG exams, with a model being able to export XML files to the database and others not having that functionality. Because of this, it is considered normal that some entries have a XML file and others do not. The ECG table show some inconsistencies in the filling of its parameters. Some entries only have Rhythm, HVE, EM, BCRE and other parameters filled with no XML files, other entries only have XML files with no other parameters filled.
As stated, this study will not take into consideration the parameters listed above, given that the condition of these values is erratic and confusing without the respective clarification by the personal responsible for the filling of these param-eters. In section 5.2 this study shows why this is the case in ECG entries with figures 38 and 39 showing that the same set of parameters can be filled in different
ways. Therefore, now follows only a brief statistical assessment of the resulting values.
Amongst the population, the maximum number of ECG, of a certain patient, is 13. 38.7% of the patients have no ECGs whatsoever, 49.1% of the patients just have one ECG, 9.0% with two ECGs and the percentage of patients with three or more ECGs being almost irrelevant. These values were obtained via the histogram presented in figure 11.
A manual cross-reference of ECG and ECG-Elements was made. 60.5% of the patients presenting at least one registration of ECG present between 1 and 10 entries of ECG-Elements, and the as the number of ECG-Elements increases, the percentage of patients reduces exponentially, as seen in figure 12. This helps to prove that not every parameter is filled in every ECG entry, proving the existence of different filling methods among the entire ECG dataset of the population in question.
Figure 12: Histogram of the number of ECG-Elements per patient
conclu-sions that are present in the population, but a future histogram of these values is required for a more thorough analysis.
3.3
Correlation between the three main different datasets
Having established the three different main tables from where useful data can be retrieved, a brief look on how they are correlated and how well the data is merged between all three is necessary. It is obvious that appointments, medical records and cardiovascular exams are related, even dependable, to each other.
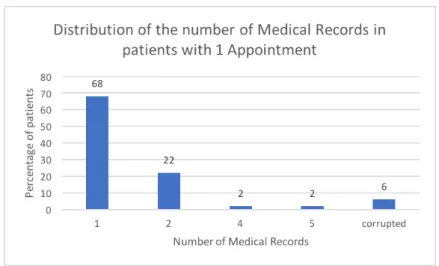
First, a correlation of the number of appointments and medical records per patient should be tested, since it is already known that there are less than half of medical record entries than of appointments. To have a preliminary under-standing of how both numbers correlate, in a given patient, a test was made to find the distribution of the number of medical record per patient, given the number of appointments. Since the values are so vast, only up to 5 appointments per patient are shown graphically, assuming that the values should representa-tive of how the number of medical records are distributed with correlation to the number of appointments.
For that, the percentage of patients with a certain amount of medical record, given 1 to 5 appointments are displayed, from figure 13 to 17. To be noted that patients with zero medical record entries were not considered for this brief analysis, since there are no patients with zero appointments.
Figure 13: Distribution of percentages of patients with medical record entries relative to 1 appointment
Figure 14: Distribution of percentages of patients with medical record entries relative to 2 appointments
Figure 15: Distribution of percentages of patients with medical record entries relative to 3 appointments
Figure 16: Distribution of percentages of patients with medical record entries relative to 4 appointments
Figure 17: Distribution of percentages of patients with medical record entries relative to 5 appointments
From figures 13 to 17 we can confirm that the distribution of medical record entries per patient tends to be equal or lower than the number of appointments, and as the number of appointments increases, the majority of percentages does not follow the same linear trend, meaning that despite the increase of the number of appointment entries per patient, the number of medical record entries tends to stay much lower, which is also backed up by the fact that there are much less medical record entries than appointment entries.
The Cardiovascular Exams table show a more distant relation to the previous two tables, mainly because it is used by a different section of the clinic, devoted only to Cardiology instead of General Medicine like the case of the previous main tables. For that reason, the Cardiovascular Exams table is treated by different technicians, separately from the functioning of the other two main tables. Never-theless, the three tables obviously share a close relation, since the need for a cardiology exam starts in a given appointment, because considering the result of said appointment, the clinician may order the execution of a certain cardiovascular exam. But, there was no field, that was found by this study, that would relate directly an exam to a medical record entry. An understanding of which appoint-ment leads to a cardiology exam may be achieved by studying the observations fields, but given the nature of those fields and the magnitude of the population, it was deemed unnecessary for this study and recommended for other future studies
4
Mining of the database content
Now that some of the content of the database was shown, and given the name of this section, a full explanation will be made of how all of the information was gathered from the clinic in question for this study. As stated before, the Front and Back offices are managed by a Java Framework specifically created for this clinic. Given the time span of the master’s thesis development, and the overall complexity of the clinic database, the Framework was deemed unusable, so the values had to be dealt in a entirely manual manner. This means that the database had to be accessed directly by SQL queries. The platform of the database in question is made in PostgreSQL, so every query had to be made in the programming language of SQL conditioned for a PostgreSQL database, with the added benefits of having available a few personalized functions created by the entity that manages the database.
Although it is known that some mining tools are available and usable for these kinds of studies, none were considered since this study represents such a preliminary step in data mining in Portugal. An American study carried out data mining in a diabetic data warehouse, applying data mining techniques such as Classification and Regression Trees, and some very important conclusions and outbreaks derived from that data mining and data treatment, which proves, yet again, that data mining is a very powerful tool in any medical area [29].
First, in order to understand the basic functioning of the database, a tour of the system was made, with a thorough explanation of the main datasets and how they work, by the database system engineers. After the introduction to the system, a comprehensive and exhaustive manual review of the entire database was made, with the help of basic SQL queries to cross-reference any data that could be deemed useful for the study. All the data discussed so far was discovered with this type of research.
Afterwards, more complex SQL queries were made to correlate the data and find all the statistical values in this study, like the histogram of ages, for example, where SQL queries had to be made to find the number of patients in the population
born in each year. Also, to correlate the appointments and medical records of patients, more complex SQL queries had to be made, in order to store all the statistical information needed, not just from those tables, but from all the datasets that were useful for this study.
The Front office was also manually scrutinized to understand how the clinician or technician uses the software and inputs all the data. For that, the software was installed in a personal computer, and then it was simulated the usage and addition of data. To record how these work and look, simple screenshots were taken while it was used.
It is worth stating that these manual actions were very challenging, especially considering that adding to the already complex structures of dealing with program-ming languages and digital data, an exhaustive and thorough manual assessment of the entire information used for this study had to be made, with very few guidelines of how to proceed, since there are very few studies similar to this one, especially made in Portugal.
4.1
Correlation between the Front and Back offices in the
determined datasets
Having identified the fields of each table and every consequent subtable, the next step is to acknowledge how each table is treated and filled by the clini-cian. For that, we must understand the relationship between the Front Office and Back Office, Front Office corresponds to the software used by the clinician, being provided by a graphic interface. The Back Office corresponds to the internal database where the values are stored and the framework used to manipulate the entire system.
As seen in figures 18, 19 and 20, the interface used by the clinicians is composed of a set of tabs for each table of a medical record, with four of them being Cardi-ology, Complications, Acute Complications and Observations. For each graph-ical tab (seen in figures 18, 19 and 20), a SQL table is created where the data concerning the topic is stored, hence the need to study each table individually and
its values. Since not every patient has, for example, cardiology related issues, the Cardiology tab will not be used in this case, and therefore it would be empty. For this reason, a SQL table entry is only created when data is added to the respective tab. So, continuing the example, if the clinician does not add any information to the Cardiology tab, there is no Cardiology table entry in the database for that patient. Therefore, it is possible for a patient to have an medical record table entry, but no Cardiology table entry, and/or any other table.
Figure 19: Complications tab in the graphic interface of appointments
Figure 20: Acute Complications tab in the graphic interface of appointments