Study carried out Hospital Israelita Albert Einstein – HIAE, São Paulo (SP), Brazil. 1 Hospital Israelita Albert Einstein – HIAE, São Paulo (SP), Brazil.
2 Transplantation Center, Secretaria de Saúde do Estado de São Paulo, São Paulo (SP), Brazil.
Corresponding author: Paolo Salvalaggio – Avenida Albert Einstein, 627/701 – Consultório 400H – 4º andar – Morumbi – Zip code: 05651-901 – São Paulo (SP), Brazil – Phone: (55 11) 99665-6620 – E-mail: [email protected]
Received on: Feb 11, 2012 – Accepted on: Jun 26, 2012. Conflict of interest: none.
Part of this work was presented at the 2011 American Transplant Congress in Philadelphia, USA; in the 2011 International Liver Transplant Society Meeting in Valencia, Spain, as well as in the 2011 Brazilian Transplant Meeting in Belém (PA), Brazil.
The interpretation and reporting of these data are the sole responsibility of the authors and should in no way be seen as representing official policy of or interpretation by the São Paulo State Government. RESUMO
Objetivo: Este estudo foi desenhado para avaliar os resultados da nova política de alocação em relação à mortalidade na lista de espera.
Métodos: O banco de dados de transplante hepático do Estado de São Paulo foi revisado de forma retrospectiva, de julho de 2003 até julho de 2009. Os pacientes foram divididos naqueles transplantados antes (Grupo Pré-MELD) e depois (Grupo Pós-MELD) da implementação do sistema MELD (Model for End-stage Liver Disease). Foram incluídos apenas os candidatos adultos para transplante de fígado. O desfecho primário foi a mortalidade na lista de espera. Resultados: A taxa não ajustada de óbitos na lista de espera diminuiu significativamente após a implementação do sistema MELD (de 91,2 para 33,5/1.000 pacientes por ano; p<0,0001). A análise multivariada mostrou uma queda significativa no risco de morte na lista de espera para pacientes após o MELD (HR de 0,34; p<0,0001). Atualmente, 48% dos pacientes são transplantados no primeiro ano na lista (versus 23% na era pré-MELD; p<0,0001). A sobrevida dos pacientes e do enxerto não mudou com a implementação do MELD. Conclusão: Houve redução no tempo de espera e na mortalidade na lista após implementação do sistema MELD em São Paulo. Os pacientes na lista no período pós-MELD apresentaram uma redução significativa no risco de mortalidade na lista de espera. Não houve mudanças nos resultados após o transplante. O MELD pode ser utilizado com sucesso para alocação para transplante fígado em países em desenvolvimento.
Descritores: Transplante de fígado; Índice de gravidade de doença; Transplante de fígado; Listas de espera/mortalidade; Países em desenvolvimento; Brasil
ABSTRACT
Objective: The MELD system has not yet been tested as an allocation tool for liver transplantation in the developing countries. In 2006, MELD (Model for End-stage Liver Disease) was launched as a new liver allocation system in São Paulo, Brazil. This study was designed to assess the results of the new allocation policy on waiting list mortality. Methods: The State of São Paulo liver transplant database was retrospectively reviewed from July 2003 through July 2009. Patients were divided into those who were transplanted before (Pre-MELD Group) and those who were transplanted after (post-MELD Group) the implementation of the MELD system. Only adult liver transplant candidates were included. Waiting list mortality was the primary endpoint. Results: The unadjusted death rate in waiting list decreased significantly after the implementation of the MELD system (from 91.2 to 33.5/1,000 patients per year; p<0.0001). Multivariate analysis showed a significant drop in risk of waiting list death for post-MELD patients (HR 0.34; p<0.0001). Currently, 48% of patients are transplanted within 1-year of listing (versus 23% in the pre-MELD era; p<0.0001). Patient and graft survival did not change with MELD implementation. Conclusion: There was a reduction in waiting time and list mortality after implementation of the MELD system in São Paulo. Patients listed in the post-MELD era had a significant reduction in risk for the waiting list mortality. There were no changes in post-transplant outcomes. MELD can be successfully utilized for liver transplant allocation in developing countries.
Keywords: Liver transplantation; Severity of illness index; Liver transplantation; Waiting lists/mortality; Developing countries; Brazil
The MELD system and liver transplant waiting-list
mortality in developing countries:
lessons learned from São Paulo, Brazil
O sistema MELD e a mortalidade em lista de espera para transplante de fígado
em países em desenvolvimento: lições aprendidas em São Paulo
INTRODUCTION
Brazil is the largest country in Latin American, with a population surpassing 190 million, and its economy currently ranks among the top ten in the world(1,2). The State of São Paulo has more than 40 million habitants and accounts for one third of the country Gross
Domestic Product (GDP)(1).
In 1997, the Brazilian government launched the Transplant National System (SNT, acronym in Portuguese), which divided the country into different regions and set allocation rules. Initially, allocation was patient-based and priority was given by time on the waiting list(3). Single center reports found an initial mortality on the waiting list for liver transplantation ranging between 20 to 38%(4,5).
When faced with high mortality of liver transplant candidates on the list, Americans adopted the MELD (Model for End-stage Liver Disease) system to proper allocate grafts for transplantation. This change of liver allocation policy was linked to decreased time to transplant and reduction in waiting list mortality, with
no concomitant changes in post-transplant outcomes(6).
Some European groups also adopted the MELD system for liver allocation, such as the North Italian Transplant, in 2003; the Eurotransplant, in 2006; the Etablissement Français des Greffes, and the Swiss Transplant, in 2007. A recent European report described similar positive waiting list findings with the
utilization of the MELD system(7).
Despite significant advances in the Brazilian transplant arena, concerns regarding post-transplant outcomes were evident prior to MELD implementation. Local specialists were divided among those who were
worried about high mortality on the waiting list versus
those who did not believe that the healthcare system would support the perioperative care of the sickest patients(4,8-11).
To better understand the local landscape, it is important to first appreciate that a national public healthcare system provides free access to unrestricted services for the entire transplant population. Public healthcare is also the only coverage for a large segment of the population (approximately 130 million habitants). Second, there is an enormous regional
variation in GDP per capita, with multiple areas
experiencing high poverty level and substandard quality of living. Third, the donor pool is extremely limited (ranging from 6.3 donors per million, in 2005,
to 8.7 donors per million, in 2009)(12). Finally, there
are substantial inequities in access to and quality of
healthcare services, with a quarter of the country not
having a liver transplant center in close proximity(8).
Therefore, a liver transplant allocation system driven by MELD score had not yet been attempted under those circumstances. After an intense and long debate, the Brazilian liver allocation was modified. Allocation is now patient based and priority was shifted to a MELD/Pediatric End-Stage Liver Disease (PELD) based system on July 16, 2006. A landmark publication has highlighted the successful implementation of the
PELD system(9). However, the overall impact of the
MELD allocation in the waiting list mortality and in post-transplant outcomes of the adult population has not been yet fully exploited and could be potentially different than early reports from other developed countries(7,13,14).
OBJECTIVE
To evaluate the impact of the MELD system on the
waiting list mortality in the State of São Paulo, Brazil.
METHODS
Protocol, design, data sources, inclusion criteria and
groups
A retrospective cohort study was initially conducted including data from all liver transplant candidates wait-listed from July 15, 2003 through July 16, 2009 in the State of São Paulo. Data were drawn from the liver transplant database of research files from the State Health Secretariat of São Paulo. There is no national database for liver transplant in Brazil.
In the present study, inclusion was restricted to
adult patients (≥18 years) who were candidates for
a liver transplantation. Patients with liver-kidney transplants were included while all other multiple organ transplants were excluded.
Candidates were then divided into a Pre-MELD Group for those listed from July 15, 2003 to July 15, 2006 and into a Post-MELD Group, for those listed from July 16, 2006 to July 16, 2009. For the analysis of post-transplant outcomes, the recipients were divided into the same groups based on the date of transplant (instead of date of listing).
MELD and donor risk index
The biological MELD at time of the transplant (or the last score available) was calculated as previously
described(15). Donor risk index (DRI) was computed
according to the formula defined by Feng et al.(16).
Donation after cardiac death (DCD) is not present in this series. Race of donors is not reported in the
database since there is much variety in the country(8).
To calculate the DRI, DCD scores were set to zero and input race scores to 0.15 (the average between minimum and maximum allowed scores).
Clinical outcomes and covariate definitions
The main endpoint was death or removal on the waiting list. Post-transplantation survival was a secondary endpoint. Laboratory data and MELD score were not collected in the pre-MELD era. For those who receive a transplant after implementation of the MELD system, the MELD score at transplantation was used as a marker of liver disease severity.
Covariates included gender, age, race, ethnicity, blood type, cause of liver failure (viral hepatitis, HCC, and other causes), region, retransplantation, split grafts, deceased donor recipient, kidney co-transplantation, DRI and body mass index (BMI). The definitions of allograft loss and patient death used were the same found in the Organ Procurement and Transplant Network (OPTN) registry.
Analysis of risk factors for waiting list death
Demographic data of patients and recipients and transplant information were submitted to univariate analysis to identify risk factors for waiting list death or removal from the list. For the risk factors identified with p<0.2 in the univariate analysis, a Cox analysis was performed to test whether different grades contributed to waiting list death or removal from the list.
Statistical analysis
Rates of removals for death/too sick and transplantation were calculated based on the number of patients and their length of time on the list and expressed as cases per 1,000 patient-years. Comparisons between rates for demographic, clinical, and geographic strata for the two eras were performed using the normal
approximation to the binomial distribution. A χ2
analysis was used to examine qualitative variables and t
tests to study quantitative variables. Kaplan-Meier curves were drawn depicting the post-transplant patient and
graft survival differences of patients for each group. The log-rank test was used to determine if there was a significant difference in the curves. Missing data (<5% of all variables) on the characteristics examined was categorized as “other” or “unknown” or excluded from analysis (in most circumstances), depending on the frequency of missing data for a given characteristic. No imputation technique was used. An alpha level of 0.05 was used for all significance tests. Analyses were performed using SAS v.9.2 (SAS Institute, Cary, NC).
RESULTS
Clinical characteristics of the study cohort
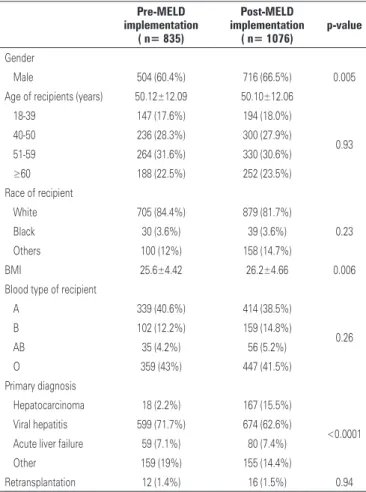
The demographics of transplant recipients are depicted on table 1. Except for a large rate of listing for HCC in the post-MELD era, there were no major differences regarding the demographics of the patients over time. Although MELD scores and laboratory tests were not recorded prior to implementation of the MELD system, in 2007, it is evident that the average MELD score has changed over time. The demographics of wait-listed transplant candidates were also assessed and the findings were similar to data presented on table 1.
Table 1. Demographics of transplant recipients performed in São Paulo, Brazil
Pre-MELD implementation
( n= 835)
Post-MELD implementation
( n= 1076)
p-value
Gender
Male 504 (60.4%) 716 (66.5%) 0.005
Age of recipients (years) 50.12±12.09 50.10±12.06
18-39 147 (17.6%) 194 (18.0%)
0.93
40-50 236 (28.3%) 300 (27.9%)
51-59 264 (31.6%) 330 (30.6%)
≥60 188 (22.5%) 252 (23.5%)
Race of recipient
White 705 (84.4%) 879 (81.7%)
0.23
Black 30 (3.6%) 39 (3.6%)
Others 100 (12%) 158 (14.7%)
BMI 25.6±4.42 26.2±4.66 0.006
Blood type of recipient
A 339 (40.6%) 414 (38.5%)
0.26
B 102 (12.2%) 159 (14.8%)
AB 35 (4.2%) 56 (5.2%)
O 359 (43%) 447 (41.5%)
Primary diagnosis
Hepatocarcinoma 18 (2.2%) 167 (15.5%)
<0.0001
Viral hepatitis 599 (71.7%) 674 (62.6%)
Acute liver failure 59 (7.1%) 80 (7.4%)
Other 159 (19%) 155 (14.4%)
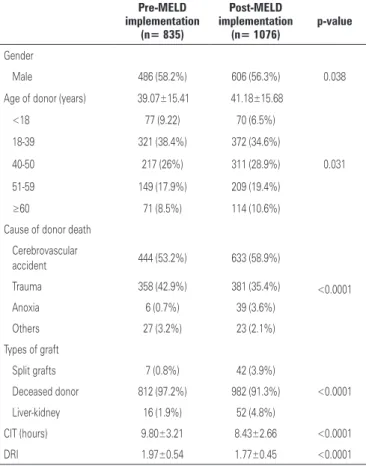
Considering the demographics of donors, there was a significant shift towards an older population that is dying of stroke. Moreover, a surge of split and liver-kidney transplants was observed, as well as a reduction in cold ischemic time in the post-MELD era.
Waiting list dynamics and number of transplants
Since time on the list was no longer a requirement to receive a graft and a policy was established to remove patients with MELD <15 from the list, a clear reduction in the number of patients added to the list after 2007 was noted (from an average of 325 per quarter in the pre-MELD era to an average of 125 per quarter in the post MELD era; p<0.05). At the same time, the number of deceased donor liver transplants has more than doubled from 50 per month in the pre-MELD era to approximately 85 per month in the post-MELD period (p=0.02). The number of split and liver-kidney transplants also followed the same trend (Table 2). Deceased donor liver transplantation grew from 60% of the donor pool, in 2005, to 88.5%, in 2009. It also became apparent that the number of
HCC patients who were transplanted increased more than 8-fold (from 2% in the pre-MELD era to 17% in the post-MELD period, p<0.0001).
As a result of implementing the MELD system and of the rise in donors, mortality in the waiting listed plunged (Table 3). This benefit was observed for all genders, races, blood types, age groups and was not related to diagnosis or waiting list time. Furthermore, we observed a reduction in time to be removed from the list was found (in the post-MELD era, 48% of patients were removed of the list in less than 1 year, Figure 1), a decrease in time to transplant (from 887 to 434 days;
Table 2. Donor demographics and transplant characteristics of liver transplants performed in São Paulo, Brazil
Pre-MELD implementation
(n= 835)
Post-MELD implementation
(n= 1076)
p-value
Gender
Male 486 (58.2%) 606 (56.3%) 0.038
Age of donor (years) 39.07±15.41 41.18±15.68
<18 77 (9.22) 70 (6.5%)
0.031
18-39 321 (38.4%) 372 (34.6%)
40-50 217 (26%) 311 (28.9%)
51-59 149 (17.9%) 209 (19.4%)
≥60 71 (8.5%) 114 (10.6%)
Cause of donor death
Cerebrovascular
accident 444 (53.2%) 633 (58.9%)
<0.0001
Trauma 358 (42.9%) 381 (35.4%)
Anoxia 6 (0.7%) 39 (3.6%)
Others 27 (3.2%) 23 (2.1%)
Types of graft
Split grafts 7 (0.8%) 42 (3.9%)
<0.0001
Deceased donor 812 (97.2%) 982 (91.3%)
Liver-kidney 16 (1.9%) 52 (4.8%)
CIT (hours) 9.80±3.21 8.43±2.66 <0.0001
DRI 1.97±0.54 1.77±0.45 <0.0001
DRI: donor risk index.
Table 3. Unadjusted death rate/1.000 patients per year in the waiting list
Pre-MELD implementation
n=3974
Post-MELD implementation
n=1936
p-value
Overall 91.20 33.51 <0.0001
Age (years)
18-39 105.76 30.15 0.0005
40-50 90.90 38.56 0.0005
51-59 90.02 37.70 <0.0001
≥60 86.64 52.38 0.0002
Gender
Female 79.84 27.52 <0.0001
Male 96.32 36.15 <0.0001
Race
White 90.27 34.75 <0.0001
Black 133.65 31.75 0.02
Others 84.79 27.90 0.0003
Primary diagnosis
Hepatocarcinoma 92.01 33.28 0.01
Viral hepatitis 90.00 43.20 <0.0001
Others 90.27 34.75 0.12
p=0.0005.
DISCUSSION
Earlier reports attested the efficiency of MELD-driven algorithms for liver transplant allocation in the United
States and Europe(6,7). Since liver transplantation
grows around the globe, it might be also important to test efficiency of a MELD-driven allocation system in developing countries. Herein, we investigated the impact of a MELD allocation system on wait-listed liver transplant candidates in Brazil.
The main finding of our study was validation of efficiency of the MELD allocation system in São Paulo, Brazil. We experienced a reduction in mortality on the waiting list, associated with a shorter time to receive a transplant after the introduction of the MELD system. Importantly, the Cox analysis pointed to switch in allocation system as the main driver of waiting list death or removal, attesting the efficiency of the MELD system. The major “motto” of the MELD system is reduction in mortality in the waiting list. This was fulfilled for the entire population, including the pediatric population and minorities(9).
For the Brazilian liver transplant community, it is extremely important to have an analysis of the MELD
Table 4. Univariate (A) and Cox analysis (B) of the likelihood of death or becoming too sick to transplant on the waiting list
A: Univariate analysis
p-value
Era: Post-MELD <0.0001
Gender: Female recipient 0.191
Age of Recipient (continuous) 0.730
Race of recipient 0.340
Height of recipient (continuous) 0.140
Weight of recipient (continuous) 0.495
Blood type of recipient 0.775
B: Cox analysis
RR (95%CI) p-value
Era: Post-MELD 0.34 (0.25-0.44) <0.0001
Gender: Female recipient 0.44
Height of recipient (continuous) 0.13
Primary diagnosis
Hepatocarcinoma 0.78 (0.51-1.19) 0.25
Hepatitis Viral Reference
Acute liver failure 1.29 (0.61-2.72) 0.51
Other 0.909 (0.64-1.3) 0.60
RR:95%CI: 95%confidence interval.
p=0.003), and a drop in the number of patients removed from the list due to death or for being too sick to transplant (from 91.2 to 33.51 deaths/1,000 patients per year in the waiting list; p<0.05).
A univariate analysis showed that listing in the pre-MELD era and having a diagnosis of HCC were significant risk factors for waiting list death. However, the multivariate analysis showed that only the listing period posed a significant risk factor for mortality on the liver transplant waiting list (Table 4).
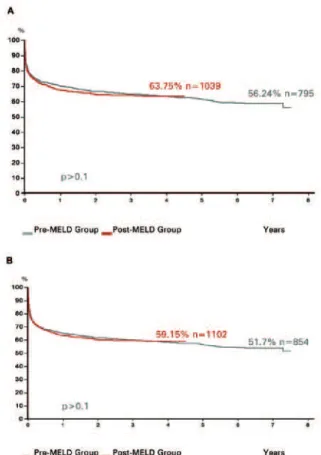
Figure 2. Patient (A) and Graft (B) survival of liver transplant recipients in São Paulo, Brazil
Post-transplant outcomes
Figure 2 depicts post-transplant outcomes during the study period. Graft and patient survival did not change after implementing the new allocation system.
In the pre-MELD period, 1-year and 3-year patient survival rates were 70.1 and 64.8%, respectively. In the post-MELD phase, 1-year and 3-year patient survival rates were 68.4 and 64.4%, respectively (Figure 2A; p>0.1).
impact and this manuscript tried to fulfill this gap. Moreover, we would like to set a model, to encourage other countries in Latin America, Africa, Middle East and Asia, which are trying to organize and regulate liver transplantation, and to select an appropriate allocation method for their particular healthcare system. As previously mentioned, poverty, lack of resources, difficult access to healthcare and technology and low donation rates are common features of other developing countries. Future reports from other regions of the globe will be important contributions for shaping transplantation and liver transplant allocation across the world.
There are other important contributions of the MELD implementation in our State that could be beneficial in the developing world. First, we have switched the registration and data report of patients listed and transplanted to an on-line system, which facilitated tremendously the communication among members of the transplant community and added significant transparency to the system. Second, the Review Board that was initially available at local level has now been expanded to a national level. The Boards are responsible not only for judging exception cases, but also for refining the rules of allocation (such as how many points to grant to HCC cases). Third, appropriate management of listed patients is now much more feasible for all transplant teams. Now there is a combination that enables listing only patients with MELD >15 with automatic removal of those with laboratory tests older than 90 days. A shorter list, associated with an expansion of the donor pool and an increase in the number of transplants contributed to
improve future outcomes(17).
A systematic advantage in the current MELD system for HCC recipients has been extensively reported in the literature. In a recent manuscript, Washburn et al. examined how much the MELD
system benefited HCC patients(18). In our study HCC
recipients were significantly assisted by the MELD system. There was a 8-fold increase in the number of transplants in HCC patients in the post-MELD era. Although all subpopulations were found to experience drop in the mortality list, our analysis was unable to specifically verify whether the benefit for HCC recipients was deleterious to non-HCC patients. Granting additional points to HCC recipients evolved over time, in Brazil. First a maximum MELD score of 29 was granted to these recipients. As the average MELD score went down, more evidence was found in the international literature about “the MELD
inflation” and HCC granting points are now capped at
24 (starting at 20)(19). Future studies should continue
to address this important point in order to be fair to the system with no increment in dropout rates of the waiting list in HCC patients(20).
Multiple studies also pointed to increased liver-kidney transplantation in the MELD era and the association of renal failure with increased resource
utilization and poor outcomes(21-24). Therefore, it was
not surprising to find a growing number of liver-kidney recipients in the post-MELD period in our study. We were pleased to also discover a substantial growth in the split-livers that were probably related to the aggressive PELD policy in place(9).
The Brazilian experience mirrors in some aspects the North American reports, with a significant reduction in waiting list mortality, without changes in
overall post-transplant survival(6,7). Nonetheless, in the
post-MELD era, it seems that severity of liver disease at transplantation (as measured by MELD score) has a direct impact on post-transplant survival (data not shown). Thus, this early analysis (not adjusted) has probably indicated some similarities with German and other transplant center reports that experienced a worsening in post-transplant outcomes according to the MELD score of recipients(25-27).
It is also paramount for the Brazilian liver transplant community to move forward by addressing critical issues that have not yet been revised, starting by a focus on quality. Post-transplant survival rates similar to those from American and European transplant centers are already achieved in few national transplant centers, but this reality is not yet widespread in the whole country. Better training of teams, efforts to better select recipients and donors, associated with major investment in hospital infrastructure can certainly make a difference. Second, transparency in published data is relevant. Previous experience in multiple medical fields proved that when data are accessible to the public and are transparent, the overall quality of medical care and
its outcomes improve(27-29). Third, it is necessary to
spread the model employed in the State of São Paulo (and in few other Brazilian States) to the entire country.
estimated statistical power. With adjustments for exceptions, changes in the population demographics and modifications in the characteristics of transplant centers, it might be important to continue to monitor efficiency of the MELD system in the future. Fourth, we could not acquire transplant center identifiers and correct the analysis for clustering. Finally, further assessment of post-transplant survival rates corrected for co-morbidities, disease severity and other factors that can change outcomes.
CONCLUSION
There was a decrease in the waiting time and in mortality list after implementing the MELD system in Brazil. Patients listed in the post-MELD era had a significant reduction in death risk in the waiting list. Despite changes in donor demographics, there were no modifications in post-transplant outcomes. MELD can be successfully utilized for liver transplant allocation in developing countries.
ACKNOWLEDGEMENT
The authors thank to Jackelyne Gense for her support with the statistical analysis.
REFERENCES
1. Instituto Brasileiro de Geografia e Estatítica. Censo 2010 [Internet]. 2010. [citado 2012 Set 23]/ Disponível em: http://www.ibge.gov.br/censo2010/ resultados_do_censo2010.php
2. World Economic Outlook Database: Nominal GDP list of countries. Washington (DC):International Monetary Fund; 2010
3. Brasil. Ministério da Saúde. Legislação sobre o Sistema Nacional de Transplantes [Internet]. [citado 2012 Set 23]/ Disponível em: http://dtr2001. saude.gov.br/transplantes/legislacao.htm#
4. Boin IF, Leonardi MI, Pinto AO, Leme RS, Udo E, Stucchi RS, et al. Liver transplant recipients mortality on the waiting list: long-term comparison to Child-Pugh classification and MELD. Transplant Proc. 2004;36(4): 920-2.
5. Chaib E, Massad E. Liver transplantation: waiting list dynamics in the state of Sao Paulo, Brazil. Transplant Proc. 2005;37(10):4329-30.
6. Freeman RB Jr, Wiesner RH, Roberts JP, McDiarmid S, Dykstra DM, Merion RM. Improving liver allocation: MELD and PELD. Am J Transplant. 2004;4 Suppl 9:114-31.
7. Dutkowski P, Oberkofler CE, Béchir M, Müllhaupt B, Geier A, Raptis DA, et al. The model for end-stage liver disease allocation system for liver transplantation saves lives, but increases morbidity and cost: a prospective outcome analysis. Liver Transpl. 2011;17(6):674-84.
8. Silva HT Jr, Felipe CR, Abbud-Filho M, Garcia V, Medina-Pestana JO. The emerging role of Brazil in clinical trial conduct for transplantation. Am J Transplant. 2011;11(7):1368-75.
9. Neto JS, Carone E, Pugliese RP, Fonseca EA, Porta G, Miura I, et al.
Modified pediatric end-stage liver disease scoring system and pediatric liver transplantation in Brazil. Liver Transpl. 2010;16(4):426-30.
10. Teixeira AC, Souza FF, Mota Gde A, Martinelli Ade L, Sankarankutty AK, Silva Ode C. Liver transplantation: expectation with MELD score for liver allocation in Brazil. Acta Cir Bras. 2006;21 Suppl 1:12-4.
11. Ferraz-Neto BH. MELD score, step forward to justice of liver graft allocation in Brazil. Arq Gastroenterol. 2007;44(3):187-8.
12. Associação Brasileira de Transplantes de Órgãos (ABTO) [Internet]. [citado 2011 Jul 21]. Disponível em: http://www.abto.org.br/abtov02/portugues/ populacao/home/home.aspx
13. Freeman RB, Wiesner RH, Edwards E, Harper A, Merion R, Wolfe R. Results of the first year of the new liver allocation plan. Liver Transpl. 2004;10(1): 7-15.
14. Freeman RB, Jr. Model for end-stage liver disease (MELD) for liver allocation: a 5-year score card. Hepatology. 2008;47(3):1052-7.
15. Wiesner R, Edwards E, Freeman R, Harper A, Kim R, Kamath P, Kremers W, Lake J, Howard T, Merion RM, Wolfe RA, Krom R; United Network for Organ Sharing Liver Disease Severity Score Committee. Model for end-stage liver disease (MELD) and allocation of donor livers. Gastroenterology. 2003; 124(1):91-6.
16. Feng S, Goodrich NP, Bragg-Gresham JL, Dykstra DM, Punch JD, DebRoy MA, et al. Characteristics associated with liver graft failure: the concept of a donor risk index. Am J Transplant. 2006;6(4):783-90.
17. Trotter JF, Osgood MJ. MELD scores of liver transplant recipients according to size of waiting list: impact of organ allocation and patient outcomes. JAMA. 2004;291(15):1871-4.
18. Washburn K, Edwards E, Harper A, Freeman R. Hepatocellular carcinoma patients are advantaged in the current liver transplant allocation system. Am J Transplant. 2010;10(7):1643-8.
19. Biggins SW, Feng S. In a MELD-based economy, how can we fight off inflation? Liver Transpl. 2007;13(1):2-4.
20. Cuchetti A, Cescon M, Bertuzzo V, Bigonzi E, Ercolani G, Morelli MC, et al. Can the dropout risk of candidates with hepatocellular carcinoma predict survival after liver transplantation? Am J Transplant. 2011; 11(8): 1696-704.
21. Buchanan P, Nino N, Lentine K, Axelrod D, Schnitzler M, Salvalaggio P. Liver transplantation cost in the MELD era: looking beyond the transplant admission. Liver Transpl. 2009;15(10):1270-7.
22. Axelrod DA, Koffron AJ, Baker T, Al-Saden P, Dixler I, McNatt G, et al. The economic impact of MELD on liver transplant centers. Am J Transplant. 2005;5(9):2297-301.
23. Locke JE, Warren DS, Singer AL, Segev DL, Simpkins CE, Maley WR, et al. Declining outcomes in simultaneous liver-kidney transplantation in the MELD era: ineffective usage of renal allografts. Transplantation. 2008;85(7): 935-42.
24. Eason JD, Gonwa TA, Davis CL, Sung RS, Gerber D, Bloom RD. Proceedings of Consensus Conference on Simultaneous Liver Kidney Transplantation (SLK). Am J Transplant. 2008;8(11):2243-51.
25. Neuberger J. The introduction of MELD-based organ allocation impacts 3-month survival after liver transplantation by influencing pretransplant patient characteristics. Transpl Int. 2009;22(10):979-81.
26. Weismüller TJ, Fikatas P, Schmidt J, Barreiros AP, Otto G, Beckebaum S, et al. Multicentric evaluation of model for end-stage liver disease-based allocation and survival after liver transplantation in Germany--limitations of the sickest first-concept. Transpl Int. 2011;24(1):91-9.
28. Hammermeister KE, Johnson R, Marshall G, Grover FL. Continuous assessment and improvement in quality of care. A model from the Department of Veterans Affairs Cardiac Surgery. Ann Surg. 1994;219(3):281-90.