GROCERY
CONSUMER
RELATIONAL
PERCEPTIONS:
VALUE
TYPOLOGIES
AND
ENVIRONMENTALLY
SUSTAINABLE
CONSUMPTION
Marta Catarina Fernandes Gonçalves
Dissertation submitted as partial requirement for the conferral of
Master in Management
Supervisor:
Professor João Menezes, ISCTE Business School, Department of Marketing, Operation and Management
Co-supervisor:
Professor Catarina Marques, ISCTE Business School, Department of Quantitative Methods to Management and Economy
i ACKNOWLEDGEMENTS
In this study I would like to thank those who helped me so much and gave me strength.
So I would say a word of gratitude to Professor João Menezes, my supervisor, for his support. I really appreciated all the information and suggestions that he provided me, they were very useful in the thesis´ development process.
I also want to thank Professor Catarina Marques, my co-supervisor, for her fundamental orientations in the analytical data and patient demonstrated during this time, a big thank you.
I am also grateful to all those who patiently answered the questionnaire, whose data was essential to the development of this study. As such, I am grateful to Professor Elizabeth Reis, who assisted me in developing the surveys, an important support for starting up the thesis.
A special thank you to my family, in particular, my parents and brother for their constant concerns and support, I love them. I am very grateful also to my grandparents for always being by my side for everything.
To Pedro, I want to give a special thank you for being always present in the ups and downs of life, with your advice and assistance, love and affection.
To friends who always motivated me, during this time. To Sofia thank you for your constant concern. A special thanks to my friend Marisa, my partner and friend, thanks for everything. And to all others, who directly or indirectly contributed to this study.
ii ABSTRACT
Understanding the concept of perceived value by the consumer has been the subject of several studies, in order to understand its impact on relational satisfaction between consumer and retailer. This understanding is relevant to the extent that relational satisfaction can be improved by retailers, in view of the value that consumers more perceived as essential in a relationship.
In this sense, this study aims to identify consumer segments in accordance with their perceived value, which are characterised according to the risk of environmentally unsustainable consumption in their relations with the stores that they regularly attend, as well as their state of satisfaction and repurchase intentions.
The segments were obtained based on a sample of 327 young adult consumers with schooling equal or greater than 12 years, living in central and southern Portugal.
The methodology adopted is focused on a cluster analysis, based on a set of perceived value variables of consumer-retailer relationship after application of a principal component analysis. In addition, measures of descriptive statistics and hypothesis testing were used in order to characterise the sample and consumer segments.
Four different consumer segments were obtained: "Prudent" (group of consumers who give importance to the functional value and less to the monetary value); "Intimate" (consumers privilege the emotional value); "Influenced" (especially the social value) and "Pragmatic" (combine the functional value and less the social).
Keywords: consumer perceived value; relational satisfaction; risk of environmentally unsustainable consumption; segmentation.
JEL Classification System: M31 - Marketing;
iii RESUMO
A compreensão do conceito de valor percebido pelo consumidor tem sido alvo de vários estudos com a finalidade de entender o seu impacto na satisfação relacional entre consumidor e retalhista. Este entendimento é relevante, na medida em que a satisfação relacional poderá ser aperfeiçoada pelos retalhistas, atendendo ao valor que os consumidores mais percebem como fundamentais num relacionamento.
Neste sentido, este estudo pretende identificar segmentos de consumidores de acordo com o seu valor percebido, sendo estes caracterizados quanto ao risco de consumo ambientalmente insustentável nas relações que mantêm com as lojas que regularmente frequentam, bem como o seu estado de satisfação e intenções de recompra.
Os segmentos foram obtidos tendo por base uma amostra de 327 consumidores jovens adultos com escolaridade igual ou superior ao 12ºano, residentes no Centro e Sul de Portugal.
A metodologia adoptada incidiu sobre uma análise de clusters, baseada num conjunto de variáveis do valor percebido da relação consumidor-retalhista após a aplicação de uma análise de componentes principais. Além disso, foram utilizadas medidas de estatística descritiva e testes de hipóteses de modo a caracterizar-se a amostra e os segmentos de consumidores.
Obtiveram-se quatro segmentos de consumidores diferenciados: “Prudentes” (consumidores que prezam o valor funcional e menos o valor monetário na relação); “Intimistas” (consumidores privilegiam o valor emocional); “Influenciados” (sobretudo o valor social) e “Pragmáticos” (aliam o valor funcional e menos o social).
Palavras-chave: risco de consumo ambientalmente insustentável; satisfação relacional; segmentação; valor percebido pelo consumidor.
Sistema de Classificação JEL: M31 - Marketing;
iv TABLE OF CONTEXTS ACKNOWLEDGEMENTS... i ABSTRACT ... ii RESUMO ... iii TABLE OF CONTEXTS ... iv LIST OF TABLES ... vi I. INTRODUÇÃO ...1
II. GROCERYCONSUMERRELATIONALPERCEPTIONS:VALUE TYPOLOGIESANDENVIRONMENTALLYSUSTAINABLECONSUMPTION ...6
1. Abstract ...6
2. Introduction ...6
2.1. Study´s purpose and research questions...7
3. Conceptual Framework ...8
3.1. Consumer perceived value ...8
3.2. B2B and B2C ... 11
3.3. Environmentally sustainable consumption... 11
4. Methodological aspects ... 13
4.1. Population... 13
4.2. Data collection ... 13
4.3. Methods of study ... 14
4.3.1. PCA and cluster analysis ... 14
v
5.1. Sample characterisation ... 15
5.1.1. Clustering Analysis ... 17
6. Discussion and conclusion ... 24
6.1. Recommendations to retailers ... 25
6.2. Limitations and future research ... 27
7. References ... 28
vi Table 1 - Socio-demographic characteristics of the sample and consumer segments. ... 16 Table 2 - Segments´ characterisation by shopping habits. ... 17 Table 3 - PCA results of the perceived value by the consumer in the relationship with
retailer……….. 18 Table 4 - Segment size……….20 Table 5 – Mean scores for segments on risk of environmentally unsustainable
consumption……….21 Table 6 – Mean scores on relational satisfaction. ... 22 Table 7 – Mean scores for segments on repurchase intentions. ... 22
1 I. INTRODUÇÃO
A presente tese encontra-se desenvolvida sob a forma de artigo. Em seguida, será apresentado um resumo acerca de como está estruturado o artigo, bem como a explicação de alguns pontos chaves.
Primeiramente é importante fazer uma breve fundamentação acerca do conteúdo do problema que conduziu à realização deste estudo. Com base na importância em temas como: consumo ambientalmente insustentável, satisfação dos consumidores e valor percebido do consumidor, surgiu o interesse em abordar estes aspectos em conjunto ao nível das lojas de grande consumo, especificamente, em lojas de mercearia. A decisão mencionada baseou-se no facto dos consumidores terem bastante necessidade em frequentar este tipo de lojas, pois as mesmas possuem uma grande variedade de produtos essenciais, nomeadamente, e em grande proporção, produtos alimentares. Esta convivência regular entre consumidor e retalhista suscita uma análise ao nível da satisfação relacional e para tal, é importante abordar também o conceito de valor percebido pelo consumidor. Neste sentido, o estudo aborda a explicação deste conceito que será a base para a categorização dos consumidores consoante o tipo de valores que, de algum modo, privilegiam na relação com o seu retalhista. A satisfação será tanto maior, quanto maior for para o consumidor, numa lógica de relação, a satisfação das suas necessidades diárias com o seu retalhista de preferência. Assim, com base na satisfação, futuras intenções de recompra existirão por parte do cliente. A caracterização dos consumidores será realizada no âmbito dos dois aspectos referidos, satisfação e intenção de recompra, e ainda quanto ao risco de consumo ambientalmente insustentável. A representação esquemática a seguir apresentada, mostra a combinação dos elementos de investigação mencionados anteriormente (Figura 1):
Valor Percebido Consumidor Retalhista Satisfação Relacional Intenção de Recompra Risco de Consumo Ambientalmente Insustentável
Figura 1 - Valor percebido pelo consumidor na relação com o retalhista, atendendo ainda ao risco de consumo ambientalmente insustentável, satisfação relacional e intenção de recompra.
2 Em suma, o objectivo deste estudo é identificar grupos de consumidores jovens com base nos valores que fundamentam a sua satisfação no relacionamento com os retalhistas. A escolha de indivíduos jovens e instruídos para o desenvolvimento do estudo, teve por base a componente ambientalmente sustentável, pois estes são consumidores que possuem uma consciência mais ambientalista, encontrando-se estes aspectos mais intrínsecos, no que respeita ao consumo e sustentabilidade. A segmentação será assim feita, de modo a separar os consumidores relativamente ao valor que mais privilegiam numa relação de compra com o seu retalhista habitual. Mais tarde, será possível saber, em cada segmento, quais as opiniões dos consumidores sobre o risco de consumo ambientalmente insustentável nessas relações. Com base neste risco percebido, no estado de satisfação relacional e intenções de recompra, será possível a caracterização de cada um dos segmentos em estudo. Em seguida, apresentam-se as questões de investigação resultantes do objectivo de estudo referido:
1. Que grupos de consumidores podem ser considerados na população alvo abordada, tendo em conta o estudo efectuado?
2. Quais as dimensões do valor percebido que caracterizam a relação entre consumidor e retalhista para os segmentos em causa?
3. O que significam esses valores percebidos pelos consumidores para a satisfação relacional e intenções de recompra?
4. Como é que o valor da relação é mediado pelos consumidores de acordo com o risco percebido?
Com a finalidade em encontrar respostas para as questões apresentadas, e respondendo ao objectivo de estudo, recorreu-se a um conjunto de métodos analíticos que trataram e transformaram os dados para que a sua análise fosse feita. É de referir ainda, que estes dados foram recolhidos através de um questionário previamente elaborado.
No tratamento dos dados foram efectuadas várias análises, tais como análises de clusters e de componentes principais. A análise de componentes principais permitiu reduzir o número de variáveis para o valor percebido. Como resultado obtiveram-se quatro dimensões de valor percebido: “Valor Monetário”; “Valor Social”; “Valor Funcional” e “Valor Emocional”. Estes valores são os que se encontram definidos na escala multi-ítem de PERVAL, que consiste numa construção multidimensional que concentra em si o conceito de valor percebido desdobrado em várias categorias. Com base nestas variáveis realizou-se uma análise de clusters que permitiu agrupar consumidores. Como resultado, e
3 a partir da aplicabilidade do Método Hierárquico Complete Linkage, obtiveram-se quatro grupos de consumidores que foram designados, a partir do(s) valor(s) que mais prezam numa relação com a loja que frequentam.
Tanto a amostra como o grupo de segmentos foram caracterizados segundo características sociodemográficas e aspectos de compra habitual. O consumo ambientalmente insustentável, satisfação relacional e intenções de recompra são características atribuídas aos quatro segmentos.
As principais conclusões retiradas a partir da execução deste estudo relacionam-se com a caracterização e diferenciação dos grupos, respondendo não só às questões de investigação, mas também concretizando o objectivo em estudo.
A primeira conclusão prende-se com as primeiras três questões de investigação. Em primeiro lugar, importa referir o nome atribuído a cada um dos quatro grupos e a respectiva justificação:
“Prudentes”: grupo diferenciado essencialmente por privilegiarem o valor funcional e menos o valor monetário na relação;
“Intimistas”: o valor emocional é predominante neste grupo no que se refere à relação com o retalhista;
“Influenciados”: o valor social é bastante tido em consideração por estes consumidores;
“Pragmáticos”: constitui-se por indivíduos que aliam o valor funcional e menos o valor social na sua relação com a loja.
Dos segmentos apresentados, o maior é o dos “Prudentes”, em contraste com o dos “Pragmáticos”, que se encontra como o menor segmento de consumidores.
Os segmentos de consumidores foram caracterizados a vários níveis, nomeadamente em termos sociodemográficos, importando realçar apenas os pontos em que estes segmentos mais se distinguem. No que se refere à média de idades, verificou-se que o segmento dos “Influenciados” é o mais velho, com indivíduos com cerca de 35 anos. Os consumidores do segmento “Pragmáticos” possuem uma média de idades de 34 anos, e os restantes 32 anos. Actualmente o segmento dos “Influenciados” encontra-se a viver numa família com crianças, enquanto o dos “Pragmáticos” está a viver sozinho ou com amigos ou numa
4 residência universitária. Os restantes segmentos possuem as mesmas características da amostra. Quanto aos rendimentos mensais do agregado familiar, o segmento dos “Pragmáticos” é o único diferente dos resultados da amostra, apresentando rendimentos inferiores, ou seja, estes indivíduos auferem apenas rendimentos até 750€.
Também a amostra foi caracterizada, representando cerca de 327 respondentes, a maioria pertencente ao sexo feminino, com uma média de idades a rondar os 32 anos. Um total de 80% de respondentes vive nas regiões da Grande Lisboa e Alentejo. Cerca de 41% dos indivíduos reside actualmente numa família sem crianças até aos 14 anos, sendo que a maioria possui mestrado e encontra-se a trabalhar por conta de outrem. Quanto aos rendimentos mensais, especificamente os pessoais, cerca de 35% dos indivíduos tem rendimentos até 750€, enquanto no caso dos rendimentos do agregado familiar, os respondentes auferem, mensalmente, rendimentos acima dos 1.500€, representando 36% da amostra.
Quanto aos hábitos de compra, verificou-se que a maioria dos consumidores, em cada segmento, decide o que vai comprar e realiza com regularidade as suas compras. Esta informação é importante, pois permite pressupor que estamos perante grupos de consumidores que se preocupam em dirigir-se à “loja do costume” com frequência, o que enaltece a relevância do estudo da satisfação relacional. Como tal, a amostra apresenta resultantes semelhantes.
Relativamente à satisfação relacional e intenções de recompra, conclui-se que o segmento de consumidores “Pragmáticos” mostrou-se como o mais satisfeito e com maior disposição em voltar a comprar na mesma loja. Os segmentos dos “Prudentes” e “Influenciados” encontram-se a um nível abaixo de satisfação e intenção de recompra, no entanto também se consideram satisfeitos com o actual relacionamento. Por último, o segmento dos “Intimistas” que se mostra como o menos satisfeito, cuja situação provável poderá ser abrandar a frequência com que se dirige à habitual loja, ou até mesmo abandonar esta relação, por não se encontrar totalmente satisfeito com a mesma.
No que concerne à quarta questão de investigação, e no que diz respeito ao consumo ambientalmente insustentável, concluiu-se que o segmento dos “Pragmáticos” e “Prudentes” são os que se preocupam mais com este assunto, sendo que os consumidores pragmáticos consideram mais que os prudentes. Esta análise é suportada pelo facto dos
5 consumidores possuírem uma preocupação crescente, no relacionamento com o retalhista, pela origem dos produtos que compram, ou seja, preferirem os que são provenientes do território nacional. Em contrapartida, o segmento dos “Intimistas” não concorda que esta preocupação seja tida em consideração ao longo do tempo, no relacionamento. O grupo dos ”Influenciados” detém uma posição mais idêntica relativamente aos consumidores prudentes, no entanto preocupam-se mais com a origem dos produtos. Além disso, eles concordam que o envolvimento da relação ao longo do tempo permite a existência de um risco de compra ambientalmente insustentável, isto é, mais propensão em comprar produtos que não necessitam.
A partir das conclusões apresentadas será possível apresentar recomendações aos retalhistas acerca das estratégias a serem adoptadas para cada tipo de consumidor. Este estudo poderá ainda suscitar o interesse dos investigadores em adequar o estudo a outros contextos onde esta relação exista.
6
II. GROCERYCONSUMERRELATIONALPERCEPTIONS:VALUE
TYPOLOGIESANDENVIRONMENTALLYSUSTAINABLECONSUMPTION
Marta Gonçalves1; João Menezes2; Catarina Marques3 1
Marta Gonçalves, [email protected];
2
João Menezes, [email protected];
3
Catarina Marques, [email protected]
1. Abstract
This study identifies groups of young Portuguese consumers, based on the value associated with purchase groceries. The dimensions of social, emotional, monetary and functional value are the constants of the PERVAL scale. Using a sample of 327 young consumers, four consumer segments of grocery stores were identified and characterised by their perceptions of value and satisfaction in relation to retailers, as well as their perception of risk associated with environmentally unsustainable consumption. Previously to the cluster analysis, we performed a principal components analysis to the value variables. The cluster analysis allows us to understand how the satisfaction can be achieved through a better understanding about how value is perceived by consumers, enabling a decision making that leads to more sustainable attitudes. Three consumer segments consider that unsustainable attitudes of retailers can have an impact on relationship satisfaction. Some suggestions are given to retailers in order to satisfy the needs of each segment according to the perceived value. Also recommendations about concept of environmentally sustainable consumption are mentioned for more consumers’ sustainable decisions.
Keywords: consumer perceived value; relational satisfaction; risk of environmentally unsustainable consumption; segmentation
2. Introduction
In Portugal, the quality of the environment has improved. Although considering the decline in economic activity, a set of structural changes contributed to a better quality of the environment (Instituto Nacional de Estatística, 2013). On example is the reduction in the use of inorganic fertilizers in agricultural areas and the increase of recycling. In addition, Portugal is the second EU country with the highest burden of environmentally related taxes in total revenues from taxes and social contributions and the third largest on the weight of environmentally related taxes in GDP (Instituto Nacional de Estatística, 2012). The use of
7 pollution taxes by government can influence business behaviour, in order to control environmental impacts (Huang and Rust, 2011).
The sustainability as a "development that meets the needs of the present without compromising the ability of future generations to meet their own needs", cited in Report of the World Commission on Environment and Development (United Nations, 1987), has influenced the practices implemented at the enterprise level. This was due to a growing concern in the recognition of the concept of sustainability and seeks to generate benefits for their consumers (Chabowski et al., 2011). Consequently, the corporate social responsibility (Varadarajan, 2010) and corporate citizenship have emerged as an excellent strategy of marketing (Maignan and Ferrell, 2001).
The utilitarian and hedonic shopping value plays a crucial role in understanding and explanation on shopping satisfaction (Irani and Hanzaee, 2011). The product variety and the physical aspect of the store are important for consumers to feel the utility value. On the other hand, the hedonic value represents the emotion expressed by the individual when shopping. Such as, personal interactions with employees, accessibility and the perceived value of the products ensure that shoppers are pleased when shopping for groceries. All this is important for retailers to improve consumers’ satisfaction and loyalty (Olsen and Skallerud, 2011).
Accordingly, the consumer perceived value is a very important concept to understand the state of the relationship between consumer and retailer. This concept is considered as a trade-off between benefits and sacrifices (e.g. Woodruff, 1997), or as the perception of psychological satisfaction of the transaction (Lichtenstein, Netemeyer and Burton, 1990), as well as the individual perception of consumption that cannot be objectively defined (Kainth and Verma, 2011). The perception of an existing risk of environmentally unsustainable consumption would influence subsequent perceived satisfaction with the benefits (Tukker et al., 2010). Efforts to change actual consumption have been mostly oriented towards more sustainable purchases (Pogutz and Micale, 2011).
2.1. Study´s purpose and research questions
This study intends to identify groups of young consumers based on the perceived value that underlie their relationship satisfaction with retailers and characterised regarding the risk of environmentally unsustainable consumption in those relationships, the state of relational satisfaction and consequently, about the consumers´ repurchase intention.
8 In other words, the study intends to examine how shoppers value-in-use evaluations and important outcomes, such as the minimization of risk and the improvement of satisfying relationships between the exchange participants (i.e. grocers and shoppers) are relevant in grocery markets. Value in these relationships can be considered as linear process that has a positive effect on behaviour and is perceived based on in-use-experiences, where the degree of customer participation, in the service process, mostly as self-service, is generally low as well as the service provision considered relatively standardized to be captured by indicators in survey approach (see Appendix). In this way, this study is conducted, due to the limited number of studies developed in this area.
Then, the research questions are presented in accordance with the study´s purpose:
1. Which groups of consumers can be considered in the addressed target population, taking into account the performed study?
2. Which are the dimensions of perceived value that characterise the relationship between the consumer and retailer of the segments concerned?
3. What are these perceived values by consumers to relational satisfaction and repurchase intentions?
4. How is the relationship value mediated by consumers, in accordance with the perceived risk?
This paper is structured as follows. The next section mentions the conceptual framework and the following section describes the empirical research. The following section contains the detailed description of the results. In the final section, the discussion and conclusion are presented.
3. Conceptual Framework 3.1. Consumer perceived value
The concept of consumer value has been crucial in understanding the buying behaviour of consumers, representing a growing concern for consumers, businesses and retailers (Kainth and Verma, 2011).
From a retail perspective, recognizing the importance of the different dimensions of value should allow retailers to develop more sophisticated positioning strategies (Sweeney and Soutar, 2001) and appropriate to each market segment, in order to accomplish an increase in
9 customer loyalty (Li and Green, 2011). For this reason, managers can achieve a competitive advantage and it is essential to the existence of a strong emotional bond between company and customer (Kainth and Verma, 2011).
The study developed by Fazlzadeh et al. (2012), which focuses on grocery stores in a retail context, noted that a majority of the competitive advantage of a retailer directly depends on the amount of information obtained from consumers. In this sense, the findings showed that the perceptions of image quality and economic value offered by the retailers only in the supermarkets had a positive and significant impact on satisfaction. On the other hand, the services and convenience offered by stores had a positive and significant impact on the satisfaction offered by the supermarket and hypermarket.
With regard to sustainable purchases, there has been an increase in consumer environmental awareness, a greater enthusiasm to pay for environmental products and appreciation of the benefits resulting from the enjoyment thereof (Huang and Rust, 2011). As consumers recognize that their purchases can have a negative impact on the environment, they decide to opt for more sustainable shopping (Gleim et al., 2013), e.g., the perceived pesticide risks can lead consumers to buy organic food (Tung et al., 2012). So, in order to support this consumption it is necessary to adopt some marketing strategies, such as: better price competitiveness with organic food and personalized attention with knowledgeable sales people, keeping the service reliability (Chakrabarti, 2010).
So, it is essential to measure the value created from the relationship perspective allowing firms to diversify their offerings to clients and standing out from the competition (Ulaga and Eggert, 2006).
The definitions found in the literature often mention that the perceived value as a trade-off between benefits and sacrifices value (Woodruff, 1997), as an interactive relativistic experience of buying and using a product, also regarding the preference (Holbrook, 1996), as well as the individual consumer perception is a subjective concept defined by its intangibility and heterogeneity (Boksberger and Melsen, 2011).
Initially, Sheth et al. (1991) considered five dimensions: functional, emotional, social, epistemic and conditional. These dimensions refer specifically to a perceived utility of a choice decision, both in terms of a purchase decision, at the product level or the level of a brand (Sweeney and Soutar, 2001). Later, Sweeney and Soutar (2001) did not consider two of
10 the dimensions mentioned above: conditional and epistemic, reducing the scale to four value dimensions: emotional, social, functional and monetary, forming the PERVAL scale. This scale was tested and based on consumer perceptions regarding the consumption of durable goods, in a buying retail situation, in order to be determined consumer values which lead to the consumer purchasing behaviour (Ercsey, 2012). In conditions where the value is much more important to the consumer, this means an opportunity for retailers to explore all value dimensions of customers, before deciding on the most appropriate market approach (Sweeney and Soutar, 2001).
The emotional value can be considered as the knowledge or experience that the consumer has to develop to maintain relationships with retailers. This is defined as the experience result of the exchange of sensory stimuli, information and emotions between companies and customers (Sweeney and Soutar, 2001).
The social value is seen as an image based on reputation and credibility. Thus, the perceived value should incorporate, as important, elements of social citizenship and corporate identity (Seifi et al., 2012).
The functional value is considered a more rational value dimension, with the perceived utility achieved from the capacity to be able to find an alternative for functional performance (Sheth et al., 1991). With regards to the organic grocery, Koller et al. (2011) considered that the perceived ecological value has shown a marked impact on the size of functional value, highlighting the importance of "green to be seen" as achieving quality, saving money and a way to feel good, relatively the relationship between customer loyalty and retail.
Finally, the monetary value that is as a sub-dimension of the functional value and what is known as "value for money" and is defined as the aggregate utility of the product, due to the decrease in their perception of the costs to long and short term (Sweeney and Soutar, 2001). As regards from Pelsmacker et al. (2005), cited by Menezes et al. (2013), although the relationship between perceived price and customer satisfaction can be considered as indirect, there is clear evidence that organic products in retail stores have very high prices, providing a barrier to the conduct of a more sustainable purchase products, in Menezes et al. (2013).
11 3.2. B2B and B2C
The field of retailing, actually brings the B2B (business-to-business) marketing and B2C (business-to-consumer) marketing together (Dant and Brown, 2008).
Relationship marketing is being taken from the B2B and B2C. The interaction is a critical dimension of relationship marketing interaction and it is a requirement for collaboration and the creation of mutual value, since the parties to communicate needs and wants lay the foundation for exchange. So, the analysis of value creation through interaction and relationships has assumed a central role (Gummesson and Mele, 2010).
Understanding the behavioural and temporal aspects of value creation and relationship formation is crucial for marketers to retain customers (Dorai and Varshney, 2012). The study conducted by Ha (2009), develops alternative configurations using cooperation, trust, communication, satisfaction and commitment variables, as a model that marketers can use to improve its business performance and consequently, B2B relationships. The study developed by Poddar et al. (2013) also observed the importance of the retailer´s performance satisfaction with vendor systems and its impact on promotional satisfaction. It is noticed that all the components of trust might affect satisfaction, but integrity and credibility do not have significant effects on relationship satisfaction. The study also concludes that vendors can increase relationship satisfaction strengthening benevolence. Furthermore, an important way to do that is by improving the systems and processes pertaining to trade promotions and increase retailers´ trust by focusing on their own benevolent behaviour (Poddar et al., 2013).
In this sense, the relationship quality is important (Lemke, 2011) and the existence of efficient communication leads on the trust in the relationship; apply to both to the business-to-business context as to the business-to-consumer context. Specifically, in the B2C context a first buying experience may be followed by repeated purchases.
3.3. Environmentally sustainable consumption
Environmentally sustainable consumption focuses on formulating equity strategies that favour
higher quality of life, efficient use of natural resources and effective satisfaction of human needs, while promoting the development of social equity (Pogutz and Micale, 2011).
Organic foods are considered environmentally safe, produced using environmental methods, not involving pesticides and chemical fertilizers in their development, as well as having
12 genetically modified organisms. Consumers perceive organic food as healthier and of better quality. Despite the costs associated with buying organic foods, consumers understand that is correct, because they pay to protect the environment. Thus, we conclude that organic food is better than inorganic food, and proof of which is the overall satisfaction of consumers (Paul and Rana, 2012).
Kim et al. (2012) showed that credibility is the most important aspect of the green consumption behavior. Therefore, a comprehensive monitoring system on the credibility and accuracy of green information is necessary. This study showed a strong positive relationship between perceived consumer effectiveness and green consumption whereas the general environmental concern did not significantly increase green consumption. Thus, the availability of green information had a significant effect on environmentally sustainable consumption.
As for ethical issues, these have led to a growing awareness about the impact of purchasing and consumption behaviour of consumers, especially where the main concern is related to social and environmental issues. The growth of ethical culture inevitably attracted the interest of companies, as they seek to meet the needs of its consumers (Carrington et al., 2010).
So, it is necessary to understand how people´s ordinary decisions and behaviours can be influenced toward greater sustainability. Moreover, environmentally conscious businesses need to better understand consumer behaviours, principally if they want to appeal to more mainstream consumers. Also social norms can act on environmentally conscious behaviour, and consideration must be made of precisely how a norm may impact an individual’s behaviour (Moncure and Burbach, 2013). A change in environmental behavior is based on strong social norms. The individuals evaluate the morality of their actions, thinking first if they are accepted or rejected by society (Carrete et al., 2012).
The example of the big behaviour changes happen in recycling, because consumers developing a positive attitude towards recycled products and expressing social responsibility through the purchase of organic products. However, consumers evaluate products according to the perception of risk associated with them, which will result or not in a buying decision. In the case of buying recycled products is expected to environmentally conscious consumers do not face this risk, reflecting a positive attitude towards this type of products (Essoussi and Linton, 2010).
13 Today, the sustainability marketing paradigm has emerged. As a result, there has been growing awareness of sustainable behaviour by people worldwide. Enjoyably, the environmental market segment is increasing, and it is essential to know the profile of the corresponding segment (Ukenna et al., 2012).
The sustainability development is seen as a development process that reconciles aspects related to economy, society and environment. In others words, the main objectives of the corporation may still be to reducing risks and create revenues for its stakeholders. Thus, the sustainability should be cross-functional, because all functions of the company are affected and contribute to an overall policy of social responsibility. In a relational perspective, the retailers should adopt this policy of sustainable development to convey a positive image, for there to be a positive review and a relational proximity with consumers. This image should consider certain aspects, such as: geographic location, customer service, advertising, personal selling, loyalty programmes and the affective implications arising from the store’s attributes (Cacho-Elizondo, 2010).
Relevant to this study are both utilitarian and hedonic components of shoppers’ value-in-use as well as how they deal with minimization of risk and the improvement of satisfying relationships between the exchange members (shoppers and sellers).
4. Methodological aspects 4.1. Population
The target population consists of Portuguese people with environmental awareness. Potential respondents are selected from the group of young consumers aged between 22 and 45 years, with educational qualification equal or higher than 12th grade. This criterion was adopted, because for these individuals the environmental issues are more intrinsic, thus they have the proper profile to analyse the sustainability of consumption.
4.2. Data collection
The data collection was done through the development and dissemination of a questionnaire by interviewers and via the internet at high school students and teachers previously chosen. Because of time and cost constraints, only the Centre and South of Portugal were considered for data collection. The questionnaire is divided into two main parts. The first part aims to understanding the socio-demographic profile of respondents. The value variables, risk of
14 unsustainable environmentally consumption and relational satisfaction are belonging to the second and final part of the questionnaire, as well as a set of environmental behaviours and practises. All of these latter variables are measured by a 6-point Likert scale where 1=totally disagree and 5=totally agreed. The questionnaire has 9 question groups over 2 pages approximately, and the time to answer was estimated in 10 minutes on average.
The quota sampling was adopted and the proportional strata were defined by region, age groups, gender and educational qualification (Instituto Nacional de Estatística, 2002). The survey took place between June and October 2013. There are a total of 327 respondents.
4.3. Methods of study
The segmentation process was conducted to identify homogeneous groups of consumers (Mahajan and Jain, 1978). We initially proceeded to the principal component analysis (PCA) to reduce the number of variables related to the perceived value by the consumer. Then, a hierarchical cluster analysis was performed in order to find groups with perceptions of similar value, with respect to the relationship with the retail/ store. The hierarchical method Complete Linkage was chosen. Parametric and Non-parametric hypothesis tests were also performed to characterise the clusters.
4.3.1. PCA and cluster analysis
In an attempt to reduce the set of 15 variables measuring the perceived value was realized a PCA. There are several criteria to decide the number of principal components (PC) to be extracted: the Kaiser criterion, the percentage of variance criterion and the scree plot criterion. The Kaiser criterion aims to retain the PC with eigenvalues higher than 1.0. The percentage of variance criterion consists of extracting the first PC which ensures an explained minimum variance of 60%. Lastly, the scree plot criterion recommends that the number of PC to extract be found at the elbow point of the graph, i.e., where the increase of explained variance by component is reduced (Hair, Black, Babin and Anderson, 2009).
However, for the PCA can be possible, the original variables have to be correlated. The KMO (Kaiser-Meyer-Olkin) statistic measures the degree of adequacy of sample data collected to make the PCA. This statistic varies between 0 and 1 and the minimum acceptable is 0.6 (Hair et al., 2009). The Bartlett test is also needed to see if the correlation matrix is different from
15 the identity matrix. To be possible to perform the PCA, the null hypothesis has to be rejected meaning that there are correlations among the original variables (Hair et al., 2009).
After the PCA solution was chosen, the Cronbach´s alpha measure was carried out for the purpose of evaluating the internal consistency of responses for each PC (Sijtsma, 2009). The values of this measure are reasonable starting from 0.60 (Hair et al., 2009).
Then, a cluster analysis was performed. This is to use a set of techniques to classify objects or cases into relatively homogeneous groups called clusters (Malhotra, 2009). In this way, we proceeded to examine through the Complete Linkage hierarchical method, the best method chosen. In the Complete Linkage, the distance between two clusters is calculated as the distance between their two furthest points (Malhotra, 2009).
Four clusters were found and described by the clustering base variables, i.e., the PC of perceived value obtained in PCA. Names were assigned to the clusters using this description and also the socio-demographic characteristics.
4.3.2. Hypothesis tests
Aiming to better characterise the clusters, the One-way ANOVA, Kruskal-Wallis and Pearson´s chi-square tests were also applied. The two first tests were used to find differences between clusters regarding the variables “Risk of environmentally unsustainable consumption”, “Relational satisfaction” and “Repurchase intentions”. The Pearson´s chi-square test was used to relate the socio demographic characteristics and consumer opinion about shopping for household with clusters.
5. Results
5.1. Sample characterisation
The sample consists of 327 respondents, where approximately 59% are female and the average age is around 32 years. A total of 43% of respondents live in regions of Greater Lisbon. About 41% of respondents live in a family without children up to 14 years and the majority have a BA/ BSc (52%) and is employed (67%). Regarding to the personal monthly income, about 35% of the individuals has incomes above 750€; similar percentage is found above the 1.500€ strata in household monthly incomes (36%). The distribution of socio-demographic characteristics is presented in Table 1.
16 Table 1 - Socio-demographic characteristics of the sample and consumer segments.
Sample % Segments Pearson chi-square (1) Prudent (2) Intimates (3) Influenced (4) Pragmatic % % % % Gender Female 59.2 60.7 55.3 57.1 66.7 1.45* Male 40.8 39.3 44.7 42.9 33.3 Age groups 22-27 years 30.6 34.4 30.7 17.9 20.8 10.08* 28-33 years 26.9 25.8 28.9 21.4 37.5 34-39 years 22.3 19.9 25.4 28.6 16.7 40-45 years 20.2 19.9 14.9 32.1 25.0 Age (mean) 32 32 32 35 34 1.91a Level of Education
12º year or technical and
commercial 25.7 25.2 25.4 32.1 25.0
1.72*
BA/ BSc 52.3 54.3 53.5 46.4 45.8
Master´s degree/ PhD 22.0 20.5 21.1 21.4 29.2
Currently lives
Alone/ With friends/ In a
university residence 26.1 25.2 27.4 14.3 37.5
5.89*,b In a family without
children up to 14 years 41.4 41.1 44.2 39.3 33.3 In a family with children 32.5 33.8 28.3 46.4 29.2
Residence (city/place) Greater Lisbon 42.9 40.6 44.5 42.9 33.3 6.37*,b Alentejo 38.1 37.8 41.8 42.9 33.3 Algarve 19.0 21.7 13.6 14.3 33.3 Employment status Student 17.7 17.2 18.4 25.0 12.5 3.56*,b Employee 67.3 68.9 66.7 57.1 62.5 Other situation 15.0 13.9 14.9 17.9 25.0 Personal income
Has no monthly income 25.6 25.3 27.7 28.6 20.8
Until 750.00€ 34.6 30.7 35.7 39.3 54.2 7.21*,b 750.00€-1000.00€ 17.3 17.3 17.0 14.3 16.7 1000.00€-1500.00€ 13.9 18.0 12.5 7.1 4.2 >1500.00€ 8.6 8.7 7.1 10.7 4.2 Household income
Has no monthly income 4.8 2.7 8.3 3.8 4.8
Until 750.00€ 20.7 22.1 17.4 19.2 33.3 6.25*,b 750.00€-1000.00€ 21.7 18.8 23.9 30.8 19.0 1000.00€-1500.00€ 16.6 18.8 14.7 7.7 19.0 >1500.00€ 36.3 37.6 35.8 38.5 23.8 a
F of One-way ANOVA statistical test. b categories aggregation checks the chi-square test assumption of no more than 20% of the cells should have less than 5 expected cases. *Significant at the 0.05 level.
17 With regard to the shopping habits, the majority of respondents decides what to buy and does most of the household shopping (66%). This analysis reveals that these consumers probably have a concern in addressing frequently the same spot of shopping, that is, to keeping the relationship satisfaction with a specific retailer (Table 2).
Table 2 - Segments´ characterisation by shopping habits.
*Significant at the 0.05 level
5.1.1. Clustering Analysis
The initial set of 15 variables about the perceived value that support the relationship between consumer and retailer was reduced to only four dimensions by a PCA. Table 3 presents the summary of PCA results. The PCA solution was assessed by oblimin rotation method and it explains 77.8% of total variance. The PC names are as follows: “Functional value”, “Social value”, “Monetary value” and “Emotional value”. Regarding the PC internal consistency, only the “Emotional value” has an alpha value lower than 0.75, however it can be considered as good (Hair et al., 2009). The KMO value of 0.878 and the Bartlett´s test guarantee that the PCA there are correlation among the 15 original variables and then there is no reason to discourage the use of PCA.
Sample (1) Prudent (%) (2) Intimates (%) (3) Influenced (%) (4) Pragmatic (%) Pearson chi-square Decides what to buy and
does most of the household shopping
65.5 68.5 59.8 53.8 83.3
7.03* Does the shopping but
does not make the decisions about what to buy
16.8 18.2 19.6 19.2 0.0
Helps the person responsible for the household shopping and decisions
18 Table 3 - PCA results of the perceived value by the consumer in the relationship with retailer.
Principal
Components Variables Loadings Variance (%)
Cronbach´s alpha
Social Value
a. Shopping at this store in a regular basis
helps me to be accepted by others. 0.880
38.7 0.935 b. Shopping at this store in a regular basis
makes a good impression on others. 0.933 c. Shopping at this store in a regular basis
gives me social approval. 0.952
d. Shopping at this store in a regular basis
gives me credibility. 0.873
Monetary Value
e. Shopping at this store in a regular basis
allows me to have acceptable prices. 0.845
22.7 0.831
f. Shopping at this store in a regular basis
offers me a good price/quality ratio. 0.858 g. I look for discounts and promotions
when I shop at this store in a regular basis. 0.839
Emotional Value
h. Shopping at this store in a regular basis
makes me feel good. -0.833
11.4 0.748 i. Stop shopping at this store in a regular
basis would give me a sense of personal loss.
-0.701
j. I feel relaxed when I shop at this store. -0.665
Functional Value
k. I value this relationship. 0.589
5.0 0.906 l. The consistency of the service provided
becomes visible throughout this relationship.
0.894
m. The reliability of the service provided becomes visible throughout this relationship.
0.911
n. This relationship allows me to have a
quality service. 0.920
o. I will keep on shopping at this store in a
regular basis. 0.670
After applying the Complete Linkage method to the consumer perceived value, the choice of the cluster number varied between two to four clusters. At the solution of four clusters, the groups are more distinctive in terms of the type of perceived value between consumer and retailer, socio-demographic characteristics and other variables. Therefore, a solution of four
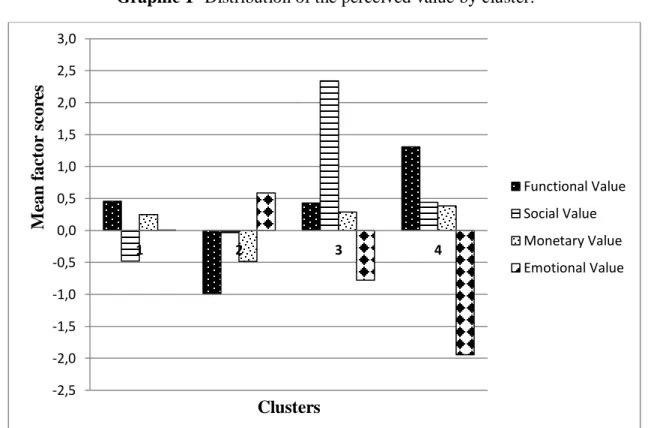
19 clusters was chosen. The name assigned for each cluster was based on all these abovementioned distinctive features. Graphic 1 shows how the value is perceived in each cluster.
Graphic 1- Distribution of the perceived value by cluster.
First segment has about 48% of consumers and is named "Prudent", because they appreciate the functional value and monetary value. These consumers opt for more rational, rather than emotive, dimension of the relationships, because they believe that quality of the relationship is essential to preserve the satisfaction with the store, where they usually do the shopping. They seek the utility derived from the perceived quality and expected performance of the service. In return, the social value is not considered at all by this group and almost nothing about the emotional value. The consumers basically do their shop, because they need and for that they look for perceived performance of service and products bought, while pondering about the monetary value which for some authors can be argued as associated to price as functional subfactor and contribute to perceived value (Sweeney and Soutar, 2001).
In the second segment are concentrated 36% of consumers. This is a group where consumers only prize the emotional value. These consumers manage their relationship with the store through the feelings, experiences and emotions. This is the segment of "Intimates" consumers.
-2,5 -2,0 -1,5 -1,0 -0,5 0,0 0,5 1,0 1,5 2,0 2,5 3,0 1 2 3 4 M ean f ac tor s cor es Clusters Functional Value Social Value Monetary Value Emotional Value
20 Third cluster has about 9% of all consumers and was named "Influenced". This designation was attributed, because these consumers truly value the social factor. They believe that shopping in a certain store give them a higher reputation or a social status. They are driven by the choices made by others (mainly the public figures or elements of their social group) such as the store or retailer where they will make their daily shopping.
Finally, the fourth and last cluster has around 8% of consumers and is named "Pragmatic". They primarily seek functional value, but also the social and monetary values. These consumers want the best, but also want to be socially acceptable. Although of less importance, they also ponder the monetary value. “Pragmatic” group considers that emotional side is dispensable to have a relational satisfaction.
Summarizing, the first segment is the biggest, in contrast to the fourth segment (Table 4). The functional value guides the relationship between consumers and retailers in “Pragmatic” and “Prudent” groups; the emotional value in “Intimates” and social value in “Influenced” consumers group. In this order, it is necessary that these values, for each consumer group, are respected for relational satisfaction to be attained.
Table 4 - Segment size. Segments Frequency % (1) Prudent 151 47.6 (2) Intimates 114 36.0 (3) Influenced 28 8.8 (4) Pragmatic 24 7.6 Total 317 100.0
Group characterisation continued in terms of socio-demographic variables, shopping habits, risk of environmentally unsustainable consumption, relational satisfaction and intentions to repurchase. Tables 1, 2, 5, 6 and 7 respectively present the distribution of these variables by cluster (in percentage or mean values. It should note that if a mean values is above 4 we can consider on average some degree of agreement with the statement).
21 Table 5 – Mean scores for segments on risk of environmentally unsustainable consumption.
Segments (1) Prudent (2) Intimates (3) Influenced (4) Pragmatic KW-Statistic
My relationship with this store through time assures
me buying local products or products that come from surrounding regions
and by doing so I help to minimize the so-called "ecological footprint", ie,
help minimizing the transport distances between production and
consumption
4.01 2.65 4.07 5.42 79.955*
The involvement in this relationship through time
can lead me to consider more the place of origin of
the products I buy (Portuguese products)
4.28 2.89 3.96 5.42 78.326*
The involvement in this relationship can lead me to
minimize my concern to ensure that products I buy were produced / achieved by sustainable methods
(no use of pesticides, Hormones, antibiotics,
etc.)
3.81 2.62 3.82 4.67 59.232*
With this relationship there is a higher probability (risk) of not worrying so much about
the products I buy – for instance if they come from
socially unfair business/unfair trade (exploitation of suppliers.
use of child labor, etc.)
3.34 2.58 3.75 5.00 50.395*
With the involvement attained in this relationship I risk purchasing products which
I do not need
2.91 2.74 4.21 4.33 36.068*
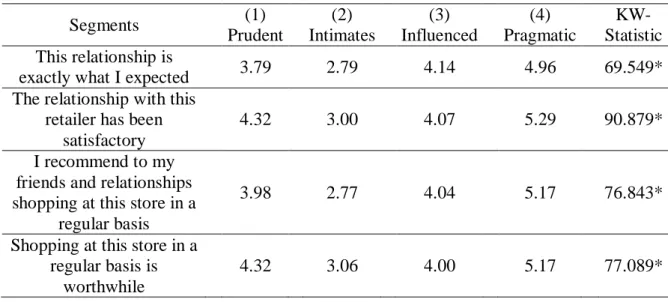
22 Table 6 – Mean scores on relational satisfaction.
Segments (1) Prudent (2) Intimates (3) Influenced (4) Pragmatic KW-Statistic This relationship is
exactly what I expected 3.79 2.79 4.14 4.96 69.549*
The relationship with this retailer has been
satisfactory
4.32 3.00 4.07 5.29 90.879*
I recommend to my friends and relationships shopping at this store in a
regular basis
3.98 2.77 4.04 5.17 76.843*
Shopping at this store in a regular basis is
worthwhile
4.32 3.06 4.00 5.17 77.089*
*Significant at the 0.01 level
Table 7 – Mean scores for segments on repurchase intentions. Segments (1) Prudent (2) Intimates (3) Influenced (4) Pragmatic KW-Statistic I intend to continue buying
at this retail store in a regular basis
4.45 3.38 4.11 5.50 69.554*
I will continue this relationship
4.39 3.08 4.00 5.38 88.430*
I would stop buying in a regular basis in this store if
a problem occurred
4.04 3.39 3.86 3.33 12.457*
In general, there are some similarities between groups, according to the sample distribution. It was found that most of the individuals are female and are employed, and which largely have the BA/BSc. A large number of consumers earn a monthly personal income up to 750€. Most of these consumers decide what to buy and do most of the household shopping. However, they also have particularities that clearly distinguish them, as described as follows.
“Prudent” segment contains consumers whose mean age is around 32 years. Around 41% of these individuals currently live in a family without children up to 14 years and live in Greater Lisbon. 38% of these consumers earn a monthly household income higher than 1500€. In terms of risk of environmentally unsustainable consumption, these consumers consider more the place of origin of the products that they buy (Portuguese products), over time in their relationships with retailers. In average, the consumers declare that this relationship has been
23 satisfactory (mean value of 4.32) and they intend to continue buying at this retail store on a regular basis (mean value of 4.45); however they somewhat agree that they stop buying on a regular basis if a problem occur (mean value of 4.04).
The socio-demographic characteristics of consumers of “Intimates” group is very similar to the first. These individuals have a mean age of 32 years, about 44% live in a family without children up to 14 years and around 45% live in Greater Lisbon. The individuals have a monthly household income higher than 1500€ (36%). In this segment, the individuals are increasingly unanimous that the origin of the products, that they buy are considered over time in relationship. The satisfaction that consumers have with its retailers is not the best, but they consider that frequently shopping at their store is worthwhile. Then, there is a lower probability, than compared to the other segments, of these consumers stop buying regularly in the store, if a problem occurred (mean value of 3.39).
The “Influenced” segment has individuals that live in Greater Lisbon and Alentejo, with a similar proportion of 43%. These individuals have an average age of 35 years. They live in a family with children (46%) and earn more than 1500€ in terms of household monthly income (39%). These consumers confess that with the involvement attained in the relationship, they run the risk to shop products which they do not need (mean value of 4.21). Usually, the influenced consumers often buy things, thinking how they are viewed by others. There is a trend and consumers follow it, resulting in purchase intentions. In this group of consumers, the relational satisfaction is good and consumers believe that is exactly what they expected. In this sense, the consumers frequently keep buying in the same store.
The “Pragmatic” group are composed by 38% of consumers that currently live alone or with friends or in a university residence. They live in Greater Lisbon or even in Alentejo or the Algarve, with the same percentage of 33%. Their mean age is 34 years. They receive the least household income, up to 750€ (33%). In terms of concerns about the environmental aspects, this segment is more apprehensive than others. They present greater agreement on actions which concern the relationship between them and the retailer. They care very much about the products origin and recognize it has impact on their satisfaction levels (mean age of 5.42). The consumers are very satisfied and strongly recommend to their friends to shop routinely in this store. As a result, they intend to proceed buying in the same retailer.
24 6. Discussion and conclusion
The perceived value of consumers conducted this study, with the aim of finding consumers market segments with different value dimensions in relational satisfaction, i.e., between consumer and retailer. Furthermore, it is also important to check how the risk of environmentally unsustainable consumption affects this relationship, still characterising the segments by their relational satisfaction and repurchase intentions.
This study identified four segments that were categorised mainly, according the perceived value in the relationship between consumer and retailer or shop. Hence, the “Prudent”, “Intimates”, “Influenced” and “Pragmatic” were the four consumer segments encountered. Consumers of the “Prudent” and “Pragmatic” segments appreciate the functional value: however the first, also appreciate the monetary value whereas the latter appreciate the social value. Individuals of the “Intimates” segment value the emotional value and those of the “Influenced” segment are conducted by the social value.
The analysis concluded that the “Prudent” and “Pragmatic” segments are identical in how they perceive the risk of environmentally unsustainable consumption, with pragmatic consumers considering more than the prudent. These consumers admit to having a growing concern in the relationship with retailers, about the place of origin of the products that they buy, i.e., they prefer the Portuguese products rather than the imported products. In contrast, the “Intimates” segment does not agree that this concern is taken into account over time in the relationship. The “Influenced” group has a more similar position with respect to the prudent consumers, however they are more concerned with the place of origin of the products. In addition, the influenced consumers agree that the involvement in the relationship through time can induce to a risk of environmentally unsustainable, i.e., the consumers have a risk of purchase products that do not need.
As a result, the “Intimates” segment is much less satisfied with their relationship than “Pragmatic” segment, and consequently these consumers have no intention to continue shopping in the same retail store, in a regular basis.
In the light of the literature, some characteristics about the consumer segments studied were founded and interpreted, as described below.
25 First, “Prudent” and “Pragmatic” segments are looking for a very functional relationship, which is in line with the consumer grocery idea as a self-service concept. Thus, these consumers want to perceive performance or utility in the service. The “Prudent” consumers want this value and monetary value, so they want a perfect balance between quality and price, i.e., they expect that perception of service provided it to be excellent to the point of being a fair payment or sacrifice (Whittaker et al., 2007). In the other hand, we have “Pragmatic segment” that also appreciate the social value, simultaneously with the functional value. In this case, the consumers want have a good experience in their shops, they make buying decisions for a variety of reasons associated with the needs, desires and trends. Thus, the social value is passed as an image based on the reputation and credibility (Seifi et al., 2012). So, these consumers want the best consumer experience, based on quality and reputation. Second, “Intimates” segment appreciates more emotional value. These consumers appreciate the trust in the relationship, which is based on quality perceived from the most basic feelings, result from the first moments of contact that occurred in each transaction between the consumer and retailer (Moliner et al., 2007).
Finally, Belk (1975) defines “Influenced” consumers by the five reasons that influence their behaviour, such as: physical environment of store atmosphere such as music, odour and illumination; social environment composed of persons in the store and their role; previous individual states, such as: mood or anxiety and the time point of the visit. These aspects are in accordance with the social value, also referred in “Pragmatic” segment.
6.1. Recommendations to retailers
Regarding the perceived value it is also important to understand which measures are necessary to be adopted by retailers, to attend the needs and characteristics of the each consumer segment. In this way, a differentiated marketing strategy will be applied to each segment, with the possibility of improving or maintaining satisfaction in the relations between consumer and shop.
The retailer can capture higher functional value by consumers, through good quality in service. Thus, when a consumer uses a service, he classifies the quality of transaction that, when combined with the satisfaction derived from key attributes (i.e. attribute satisfaction) and the perception of value, leads to a judgment in overall satisfaction on the service experience. Over time, customers tend to form an opinion on the overall quality of service
26 that the company provides (Tsiotsou and Wirtz, 2011). These aspects are paramount to “Prudent” and “Pragmatic” segments are motivated to keep buying in the same shop, as usual. Therefore, the monetary and social values also have to be analyzed, associating these segments, respectively. They are differentiating factors of each segment and also lead to relational satisfaction. For this reason, the companies must adjust the prices of their products according to their quality, and also promote deals and discounts for assiduous buyers can satisfy their consumers. The combination of strategies by retailers will allow improving the functional and monetary value in the satisfaction relationship, with the “Prudent” consumers. In the case of social value, the retailers should promote strategies respecting the corporate social responsibility. The large food retailers are recognized as having a significant impact on the environment, economy and society, and for this reason they should adopt a set of initiatives, such as: making waste management and recycling; supporting local communities and economies and charitable donations (Jones et al., 2011). These actions can improve the image conveyed by retailers, and the consumers will be more willing to shop at a place that gives them social approval, credibility and allows them to be accepted by others. In this sense, it may be interesting the store creating unusual events inviting celebrities, and consumers would be surprised (Nsairi, 2012). “Pragmatic” segment values this social value together with functional value, as previously mentioned.
“Influenced” segment attaches great importance to the social value. So, the strategies presented above will have to be taken into consideration, and with special care.
Finally, “Intimates” segment is the only segment that has the emotional value as a condition of satisfaction. For this group, the personalized treatment and interpersonal relationships that analyze the psychological benefits are important. The personalized treatment helps to reduce feelings of anxiety and create a relaxed situation. In this situation, customers know that they can take some advantage in their relations with stores. In turn, interpersonal relations are closely related to two factors, experience and personalized service, also helping to generate good feelings in the relationship with the company, becoming the most fluid and long lasting relationships, being very important perceptions affinity friendship or the feeling of familiarity, as regards the contribution in strengthening relations between companies (Fiol et al., 2011). Furthermore, the consumers´ feelings of satisfaction serve as the best judge of consumer loyalty, while feelings of happiness as the best predictor of relationship quality (Wong, 2004).
27 In the context of in-store grocery retailing, the findings of Vlachos et al. (2010) suggest that managers should localize their offerings at the community level, by posting signs that clearly indicate their stores’ locations and attachment to the neighborhood.
As to environmentally sustainable consumption, “Intimates” consumers are the only consumers that do not care much about these issues. All other segments show that the perceived risk of environmentally unsustainable consumption is central to them, especially “Pragmatic” segment. They agree that how much less this risk is perceived on relational satisfaction, with the store, more they feel satisfied. In the long run, it is necessary to create awareness campaigns in order to intervene positively in consumer attitudes; create situations of opportunity for a behavioural change to occur, and finally, to change the symbolic meanings of consumption. For this to succeed, it is important to have a balance of persuasive and dissuasive strategies, where policy makers should to pay attention to the establishment of more sustainable alternatives (Tukker et al., 2010).
6.2. Limitations and future research
It was very difficult to get a substantial number of respondents from different regions of Portugal. A large number of the sample individuals have their residences in Greater Lisbon and Alentejo. The Algarve had only a small percentage of individuals. Thus, it is noteworthy that the sample may not be representative of the type of consumers who reside in Portugal. However, this limitation did not affect the results of the study. This study may raise interest among researchers to conduct more studies, such as its implementation in clothing stores or in coffee shops, and compare results. Also this study will provide interest by addressing concepts which interest more and more retailers and consumers.