ABSTRACT: The objective of this study was to identify the factors associated with positive self-perceived health of long-lived elderly (80+) individuals. This cross-sectional study was conducted in the city of Florianópolis, Santa Catarina, Brazil, and included 239 elderly participants from the EpiFloripa Ageing Project. We used collection instruments to verify sociodemographic and economic data, self-reported health status, falls, and lifestyle. Then, we identified factors associated with positive self-perceived health using a Poisson regression adjusted for sex. We found that a positive self-reported health status was more prevalent among the long-lived elderly who were not depressed (PR = 0.49), and among those who consumed alcohol (PR = 1.99). Understanding which variables may interfere in the self-perceived health of the long-lived elderly can result in better health options for this population, mainly, new methods to prevent depression. Additionally, this information can help reduce costs associated with hospitalizations, medications and health treatments, all of which are very common among the long-lived elderly.
Keywords: Elderly people aged 80 and older. Self-assessment. Health. Comorbidity. Life style. Treatment.
Sociodemographic, behavioral, and health
factors associated with positive self-perceived
health of long-lived elderly residents in
Florianópolis, Santa Catarina, Brazil
Fatores sociodemográficos, comportamentais e de saúde associados
à autopercepção de saúde positiva de idosos longevos residentes em
Florianópolis, Santa Catarina
Rodrigo de Rosso KrugI,II, Ione Jayce Ceola SchneiderIII, Maruí Weber Corseuil GiehlIV,
Danielle Ledur AntesV, Susana Cararo ConfortinV, Giovana Zarpellon MazoVI,
André Junqueira XavierV, Eleonora d’OrsiV
IPostgraduate Program in Medical Sciences, Universidade Federal de Santa Catarina – Florianópolis (SC), Brazil. IIPostgraduate Program in Comprehensive Healthcare , Universidade de Cruz Alta – Cruz Alta (RS), Brazil. IIIDepartment of Physiotherapy, Universidade Federal de Santa Catarina – Araranguá (SC), Brazil. IVUniversidade Federal de Santa Catarina – Florianópolis (SC), Brazil.
VPostgraduate Program in Collective Health, Universidade Federal de Santa Catarina – Florianópolis (SC), Brazil.
VIPostgraduate Program in Human Movement Sciences, Universidade do Estado de Santa Catarina – Florianópolis (SC), Brazil.
Corresponding author: Rodrigo de Rosso Krug. Programa de Pós-Graduação em Ciências Médicas, Centro de Ciências da
Saúde. Rua Delfino Conti, s/n, bloco A, sala 126, Campus Universitário, Trindade, CEP: 88040-410, Florianópolis, SC, Brasil. E-mail: [email protected]
Conflict of interests: nothing to declare – Financial support: This paper is originally from the EpiFloripa Project 2009/2010, an
epidemiological study of health conditions of elderly people in Florianópolis, Santa Catarina, and was funded by the National
Council for Scientific and Technological Development (Conselho Nacional de Desenvolvimento Científico e Tecnológico — CNPq),
case number 569834/2008-2. It was developed within the Postgraduate Program in Collective Health at the Universidade Federal
INTRODUCTION
The age group of people 80 years old or older (long-lived elderly people) is increasing the most in the world. Projections from the World Health Organization1 show that this
popu-lation will surpass 379 million in 2050. In Brazil, this group is also growing. In 2010, there were around 3 million (1.1% of the total Brazilian population), with projections reaching 14 million in 2040, corresponding to an increase of 466.6%. It is estimated that approxi-mately 2.6% of these elderly Brazilians live in Santa Catarina and about 0.3% of them live in the capital city of Florianópolis2.
Long-lived elderly people have distinct characteristics, such as a higher prevalence of dis-abilities and diseases, mainly cardiovascular diseases, stroke, arthritis, dementia and depres-sion2. These characteristics give rise to concerns for the economy, health and social welfare
of society, due to the high cost of treating and preventing the diseases common to this age group. Challenges arise with regard to the implementation of public policies and improve-ments in health promotion. Furthermore, there is a need for greater opportunities for these people, so that they can maximize their participation within society1,2.
In addition, advancing age may worsen self-perceived health1. Pinquart3 explains that
this perception of poorer health among the long-lived elderly, compared to younger peo-ple, is due to the increase in the number and severity of health problems among the elderly. Moschny et al.4, when accompanying 1,937 elderly Germans (aged between 72 and 93 years
old) for 7 years, showed that people aged 80 years old and over perceived their health as worse in comparison to younger people.
Positive self-perceived health is a good indicator of one’s own health, as it predicts one’s survival5. It is related to good physical, cognitive and emotional health, as well as to a sense
of well-being and satisfaction with life6,7.
Self-perceived health is related to some important components of elderly health, such as socioeconomic aspects8, physical activity9, physical capacity5-9, morbidities5-10 and mortality9,11,12. ReSUMO: O objetivo deste estudo foi verificar os fatores associados à autopercepção de saúde positiva de idosos longevos (80+). Estudo transversal conduzido no município de Florianópolis, Santa Catarina, Brasil, com 239 idosos participantes do EpiFloripa Idoso. Foram aplicados instrumentos de coleta para verificar dados sociodemográficos e econômicos, autorrelato do estado de saúde, quedas e estilo de vida. Para identificar os fatores associados à autopercepção de saúde positiva, utilizou-se regressão de Poisson ajustada por sexo. A autopercepção de saúde positiva foi mais prevalente nos idosos longevos sem a presença de depressão (RP = 0,49) e que faziam consumo de álcool (RP = 1,99). Compreender quais variáveis podem interferir na autopercepção de saúde de idosos longevos auxilia em melhores ações de saúde para essa população, principalmente para evitar depressão, além de reduzir custos com internações, medicamentos e tratamentos de saúde, muito frequentes em idosos longevos.
However, none of these aspects are derived from studies with long-lived elderly people, thus highlighting the need for this age group to be investigated3. Furthermore, most studies on
this subject address negative self-perception of health6.
This research is justified by the differentiated population being investigated (long-lived elderly), because they perceived their health to be worse than other age groups, and also because understanding the issues involved in the positive self-perceived health of the elderly can assist in the implementation of better health policies and measures for this population. as well as be an important indicator for the general health surveillance of the elderly13.
The objective of this study was to verify the factors associated with the positive self-per-ceived health of long-lived elderly in Florianópolis, Santa Catarina.
METHODS
TYPE OF STUDY
A cross-sectional, population-based household survey conducted in the city of Florianópolis, Santa Catarina, Brazil, with a population of elderly people of both sexes, aged 80 years old and over.
POPULATION AND SAMPLE
The EpiFloripa Idoso14 study occurred in 2009 and 2010, in Florianópolis, and aimed to
study the health conditions of the elderly population (60 years and older) of both sexes, liv-ing in the urban area of the municipality.
In order to calculate the sample size, the following criteria were considered: the expected prevalence (50%), an error of 4 percentage points, a 95% confidence interval (95%CI), a design for samples by clusters (= 2), an additional 20% to account for predicted losses, and 15% for associated studies. Furthermore, the size of the elderly population of 60 years or older was considered. Finally, a minimum value of 1,599 interviews was reached. Due to the availability of funding, the sample was expanded to include 1,911 elderly people.
households. Thus, 1,911 eligible elderly people were found. The study’s response rate was 89.1%, with a final sample of 1,702 elderly people interviewed. Interviews were considered to be incomplete after four attempts of contacting the interviewee or after the interviewee chose not to respond to the questionnaire.
The study sample was representative of the population aged 60 years old or over resid-ing in Florianópolis. The age group of 80 years old or over in the study (239/1,705 elderly people or 14% of the sample) corresponded to the same percentage of elderly individuals that were 80 years old or over in the target population identified by the 2010 IBGE Census (6.784/48.423 or 14% of the target population).
INSTRUMENTS AND DATA COLLECTION
Data collection was performed using a standardized and pre-tested instrument applied in the form of face-to-face interviews using a Personal Digital Assistant (PDA), which is a small sized computer with a large computational capacity. It served as an agenda and as an elementary office computer system, and it was able to connect to a personal computer and a wireless computer network for internet access.
Female interviewers who had a high school diploma and who were properly trained carried out the interviews. The decision to have only female interviewers was made during the methodological planning of the study. It was considered that women tend to be better received by the interviewees. Furthermore, few questions used in the study could have suf-fered information bias because the interviewers were women.
Every week, data consistency and quality control was verified by applying a reduced form of the questionnaire over the phone in approximately 10% of the randomly selected interviewees.
The self-perceived health variable was verified by means of the question “In general, would you say that your health is: very good, good, fair, bad or very bad?15. These responses were
categorized as positive (“very good” and “good”) and negative (“fair”, “bad” and “very bad”). The covariates studied were:
1. sociodemographic variables: age (in years); sex (male, female); marital status (single, married/together, separated/divorced, widower); housing (alone, accompanied); caregiver (no, yes); schooling (no formal education, incomplete elementary education, elementary education, high school education, higher education); skin color (white, black/black with light skin/yellow); currently works (no, yes), which was verified by the question “Do you currently have any paid work?”; and income in minimum wages (less than 1, 1 to 3, 4 to 6, > 6, with the minimum wage in 2009 being R$ 465.00, and in 2010, R$ 510.00);
2. health variables: cognitive decline as evaluated by the Mini Mental State Examination (MMSE) validated in Brazil by Bertolucci et al.16 - MMSE is the most often used
elderly individual’s classification was given based on their level of schooling, where elderly people that probably did not have a cognitive deficit received values greater or equal to 19/20 points (elderly individuals with no formal schooling) and greater or equal to 23/24 points (elderly individuals with a formal education); and elderly people with a probable cognitive deficit had lower values than those mentioned17; spinal disease (no, yes); arthritis and/or rheumatism (no, yes);
cancer (no, yes); diabetes (no, yes); bronchitis and/or asthma (no, yes); systemic arterial hypertension (no, yes); cardiovascular diseases (no, yes); depression (no, yes); stroke (no, yes); stomach ulcer (no, yes); urinary incontinence (no, yes); and use of medications (no, yes);
3. behavioral variables: tobacco use (no, smoked and stopped, currently smokes); and alcohol use (no, moderate/high), which was evaluated by the Alcohol Use Disorders Identification Test (AUDIT)18, through the first three questions of the instrument
that refer to the quantity and frequency of regular or occasional alcohol use19.
This instrument is currently one of the most widely used measures in the world to identify groups at risk, and to track the misuse of alcohol in clinical samples and in the general population20. Elderly people who did not consume alcohol were
considered to not be drinking alcohol; moderate use was considered to be the consumption of one dose or less at any frequency; and high alcohol consumption was considered to be an intake of five doses or more, or two or more doses taken normally when drinking. Due to the small size of the sample, the categories were grouped into alcohol consumption (no, yes). Thus, the interpretation does not refer to the identification of risk group, but to alcohol consumption. Physical activity level was also evaluated by the International Physical Activity Questionnaire (IPAQ) with regard to leisure, in the long form and in a normal week21 (physically
inactive = performed less than 150 minutes per week of physical activity, and physically active = performed at least 150 minutes of weekly physical activity); and the participation in social groups (no, yes);
4. falls in the last year (no, yes).
DATA ANALYSIS
Descriptive statistics were used to analyze the characteristics of the population. Categorical data were described by relative frequency and their respective 95%CI. The normality of the continuous data (age) was tested.
SE 11.0 was used (StataCorp, 2009. Stata Statistical Software: Release 11. College Station, TX, StataCorp LP.).
ETHICAL CONSIDERATIONS
The study was approved by the Ethics Committee on Human Research of the Universidade Federal de Santa Catarina, case number 352/2008. All participants signed an informed con-sent form. The authors declare no conflicts of interest.
RESULTS
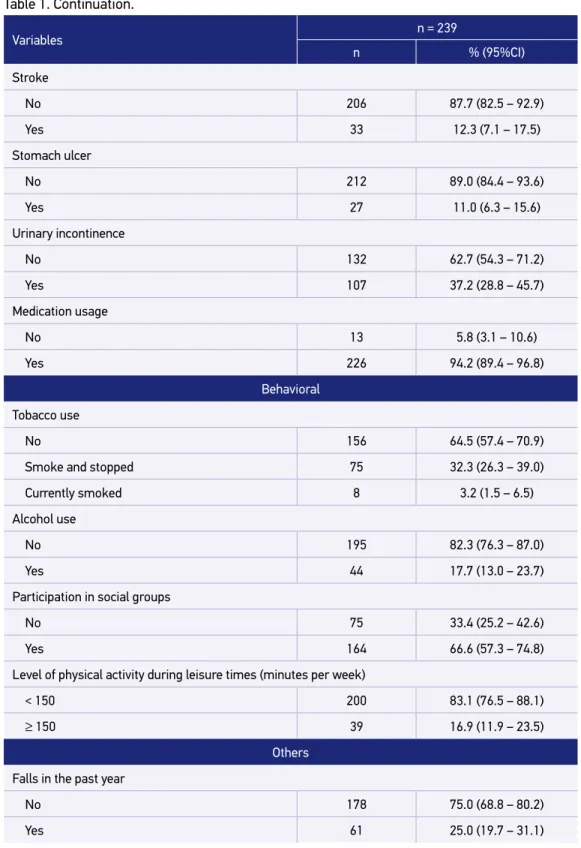
The sample of this study totaled 239 long-lived elderly individuals with a mean age of 85.06 ± 4.68 years old. The prevalence of positive self-perceived health was 41.4% (95%CI 34.6–48.5) (Table 1).
The majority of the long-lived elderly individuals were female, widowed, lived with someone else, had a low educational level (were illiterate or had not completed an ele-mentary education), were white, had no paid and/or voluntary work, and received less than three monthly minimum wages. As for health conditions, most of the individuals had no disease other than systemic arterial hypertension and took at least one medication per day. Regarding lifestyle habits, most of them never smoked and did not drink alcohol; they participated in social groups for elderly people, and were physically inactive during leisure times. Regarding falls, the majority did not have falls during the previous year (Table 1).
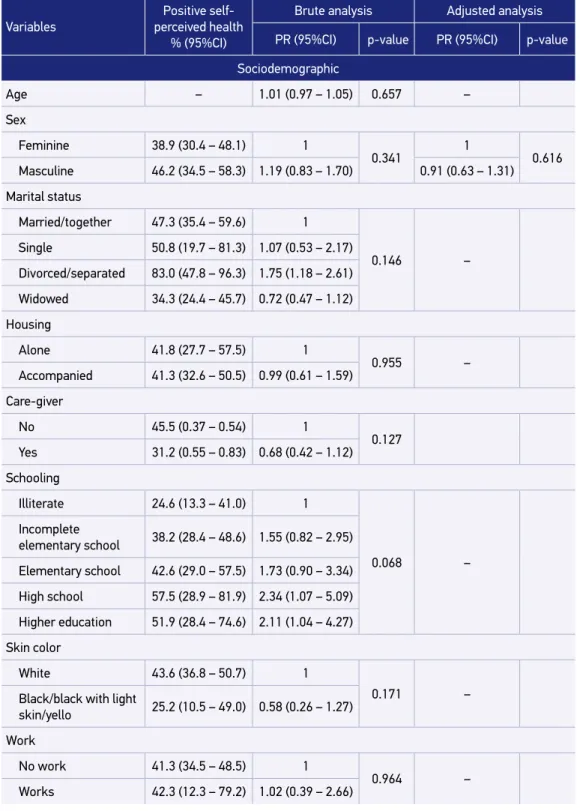
In Table 2, it was verified in the brute analysis that positive self-perceived health was asso-ciated with depression, medication use, no alcohol use, and being physically active during leisure times. However, after the adjusted analysis it was confirmed that positive self-percep-tion of health remained associated with depression, with a 51% lower prevalence in those with a diagnosis of the disease (PR = 0.49, 95%CI 0.28–0.85), and with alcohol consump-tion, where the prevalence of positive self-perceived health was practically double that of those who did not consume alcohol (PR = 1.99, 95%CI 1.54–2.56).
DISCUSSION
In the present study, the prevalence of positive self-perceived health was 41.8%. In addi-tion, it was found that positive self-perceived health was less prevalent in elderly people with no depressive symptoms, and was more prevalent in those who consumed alcohol.
It was observed that depression was inversely associated with positive self-perceived health, corroborating the findings of Arnadottir et al.9, confirming the relationship between
Variables n = 239
n % (95%CI)
Self-perceived health
Positive 100 41.4 (34.6 – 48.5)
Negative 139 58.6 (51.5 – 65.4)
Sociodemographics
Sex
Feminine 159 66.0 (58.5 – 72.7)
Masculine 80 34.0 (27.3 – 41.4)
Marital status
Married/together 91 35.7 (28.7 – 43.4)
Single 9 3.3 (1.6 – 6.6)
Divorced/separated 9 3.9 (2.0 – 7.5)
Widowed 130 57.1 (49.5 – 64.3)
Housing
Alone 45 20.8 (15.2 – 27.6)
Accompanied 194 79.2 (72.3 – 84.7)
Care-giver
No 167 71.1 (60.8 – 81.3)
Yes 72 28.9 (18.7 – 39.17)
Schooling
Illiterate 44 16.6 (11.0 – 24.2)
Incomplete elementary school 104 41.8 (32.8 – 51.4)
Elementary school 28 14.7 (8.3 – 24.7)
High school 43 19.4 (12.7 – 28.4)
Higher education 20 7.5 (3.9 – 13.6)
Skin color
White 211 87.8 (80.6 – 92.5)
Black/black with light skin/yellow 28 12.2 (7.5 – 19.3)
Work
No work 232 97.3 (94.0 – 98.8)
Works 7 2.7 (1.2 – 6.0)
Variables n = 239
n % (95%CI)
Income (minimum wages)
< 1 128 49.7 (39.8 – 59.6)
1 to 3 74 31.8 (26.6 – 37.4)
4 to 6 13 6.0 (3.3 – 10.6)
> 6 24 12.4 (6.9 – 21.4)
Health
Cognitive deficit
No deficit 124 56.5 (46.8 – 66.2)
Probable deficit 112 43.5 (33.8 – 53.2)
Spine disease
No 132 52.1 (44.5 – 59.7)
Yes 107 47.9 (40.3 – 55.5)
Arthritis/rheumatism
No 147 65.9 (57.0 – 74.8)
Yes 92 34.1 (25.2 – 43.0)
Diabetes
No 188 76.1 (68.4 – 82.3)
Yes 5 23.9 (17.6 – 31.5)
Bronchitis/asthma
No 199 83.5 (77.1 – 90.0)
Yes 40 16.4 (10.0 – 22.9)
Systemic arterial hypertension
No 89 37.1 (28.1 – 47.1)
Yes 150 62.9 (52.9 – 71.8)
Cardiovascular diseases
No 15 60.7 (52.0 – 68.8)
Yes 88 39.2 (31.2 – 48.0)
Depression
No 180 75.9 (70.6 – 80.5)
Yes 59 24.1 (19.4 – 29.4)
Table 1. Continuation.
Table 1. Continuation.
Variables n = 239
n % (95%CI)
Stroke
No 206 87.7 (82.5 – 92.9)
Yes 33 12.3 (7.1 – 17.5)
Stomach ulcer
No 212 89.0 (84.4 – 93.6)
Yes 27 11.0 (6.3 – 15.6)
Urinary incontinence
No 132 62.7 (54.3 – 71.2)
Yes 107 37.2 (28.8 – 45.7)
Medication usage
No 13 5.8 (3.1 – 10.6)
Yes 226 94.2 (89.4 – 96.8)
Behavioral
Tobacco use
No 156 64.5 (57.4 – 70.9)
Smoke and stopped 75 32.3 (26.3 – 39.0)
Currently smoked 8 3.2 (1.5 – 6.5)
Alcohol use
No 195 82.3 (76.3 – 87.0)
Yes 44 17.7 (13.0 – 23.7)
Participation in social groups
No 75 33.4 (25.2 – 42.6)
Yes 164 66.6 (57.3 – 74.8)
Level of physical activity during leisure times (minutes per week)
< 150 200 83.1 (76.5 – 88.1)
≥ 150 39 16.9 (11.9 – 23.5)
Others
Falls in the past year
No 178 75.0 (68.8 – 80.2)
Yes 61 25.0 (19.7 – 31.1)
Variables
Positive self-perceived health
% (95%CI)
Brute analysis Adjusted analysis
PR (95%CI) p-value PR (95%CI) p-value
Sociodemographic
Age – 1.01 (0.97 – 1.05) 0.657 –
Sex
Feminine 38.9 (30.4 – 48.1) 1
0.341 1 0.616
Masculine 46.2 (34.5 – 58.3) 1.19 (0.83 – 1.70) 0.91 (0.63 – 1.31)
Marital status
Married/together 47.3 (35.4 – 59.6) 1
0.146 –
Single 50.8 (19.7 – 81.3) 1.07 (0.53 – 2.17)
Divorced/separated 83.0 (47.8 – 96.3) 1.75 (1.18 – 2.61)
Widowed 34.3 (24.4 – 45.7) 0.72 (0.47 – 1.12)
Housing
Alone 41.8 (27.7 – 57.5) 1
0.955 –
Accompanied 41.3 (32.6 – 50.5) 0.99 (0.61 – 1.59)
Care-giver
No 45.5 (0.37 – 0.54) 1
0.127 Yes 31.2 (0.55 – 0.83) 0.68 (0.42 – 1.12)
Schooling
Illiterate 24.6 (13.3 – 41.0) 1
0.068 –
Incomplete
elementary school 38.2 (28.4 – 48.6) 1.55 (0.82 – 2.95)
Elementary school 42.6 (29.0 – 57.5) 1.73 (0.90 – 3.34)
High school 57.5 (28.9 – 81.9) 2.34 (1.07 – 5.09)
Higher education 51.9 (28.4 – 74.6) 2.11 (1.04 – 4.27)
Skin color
White 43.6 (36.8 – 50.7) 1
0.171 –
Black/black with light
skin/yello 25.2 (10.5 – 49.0) 0.58 (0.26 – 1.27)
Work
No work 41.3 (34.5 – 48.5) 1
0.964 –
Works 42.3 (12.3 – 79.2) 1.02 (0.39 – 2.66)
Table 2. Adjusted analyzes of the factors associated with positive self-perceived health of long-lived elderly people from the EpiFloripa Idoso Project. Florianópolis, Santa Catarina, Brazil, 2014.
Table 2. Continuation.
Variables
Positive self-perceived health
% (95%CI)
Brute analysis Adjusted analysis
PR (95%CI) p-value PR (95%CI) p-value
Income (minimum wages)
< 1 37.6 (29.2 – 46.9) 1
0.219 –
1 to 3 39.7 (25.6 – 55.7) 1.06 (0.68 – 1.84)
4 to 6 23.4 (7.6 – 53.3) 0.62 (0.22 – 1.75)
> 6 69.4 (49.8 – 83.8) 1.85 (1.29 – 2.64)
Health Cognitive deficit
No deficit 44.4 (36.3 – 52.6) 1
0.455 Probable deficit 38.7 (26.5 – 50.9) 0.87 (0.60 – 1.26) Spine disease
No 43.7 (33.1 – 54.3) 1
0.495 –
Yes 38.8 (29.5 – 48.2) 0.89 (0.63 – 1.25)
Arthritis/rheumatism
No 45.6 (35.3 – 55.8) 1
0.187 –
Yes 33.3 (20.7 – 45.8) 0.73 (0.46 – 1.17)
Cancer
No 39.8 (31.3 – 48.2) 1
0.182 –
Yes 52.8 (35.8 – 69.8) 1.33 (0.87 – 2.02)
Diabetes
No 45.9 (37.4 – 54.7) 1
0.058 –
Yes 26.8 (15.3 – 42.6) 0.58 (0.33 – 1.02)
Bronchitis/asthma
No 40.7 (33.3 – 48.2) 1
0.656 –
Yes 44.7 (27.5 – 62.0) 1.10 (0.72 – 1.67)
Systemic arterial hypertension
No 44.1 (31.7 – 57.3) 1
0.583 –
Yes 39.8 (31.8 – 48.3) 0.90 (0.62 – 1.31)
Cardiovascular diseases
No 46.8 (38.6 – 55.1) 1
0.079 –
Yes 33.0 (22.8 – 45.2) 0.71 (0.48 – 1.04)
Depression
No 47.9 (39.2 – 56.7) 1
0.004* 1 0.013*
Yes 20.8 (12.0 – 33.5) 0.43 (0.25 – 0.76) 0.49 (0.28 – 0.85)
PR: prevalence ratio; 95%CI: confidence interval of 95%; *significance level less than 5%. Final model adjusted by sex. Variables
Positive self-perceived health
% (95%CI)
Brute analysis Adjusted analysis
PR (95%CI) p-value PR (95%CI) p-value
Stroke
No 43.6 (36.1 – 51.1) 1
0.132 –
Yes 25.4 (7.8 – 43.1) 0.58 (0.29 – 1.18)
Stomach ulcer
No 41.8 (34.3 – 49.2) 1
0.778 –
Yes 38.1 (14.4 – 61.8) 0.91 (0.47 – 1.75)
Urinary incontinence
No 41.4 (33.3 – 49.5) 1
0.994 –
Yes 41.3 (29.1 – 53.6) 1.00 (0.71 – 1.41)
Medication usage
No 69.6 (37.0 – 90.0) 1
0.024* 1 0.058
Yes 39.6 (32.1 – 47.6) 0.57 (0.35 – 0.93) 0.62 (0.37 – 1.02)
Behavioral
Tobacco use
No 41.2 (30.8 – 52.4) 1
0.639 –
Smoke and stopped 40.0 (29.0 – 52.2) 0.97 (0.61 – 1.53)
Currently smoked 58.1 (21.6 – 87.4) 1.41 (0.66 – 2.98)
Alcohol use
No 34.5 (28.4 – 41.1) 1
> 0.001* 1 > 0,001* Yes 73.2 (56.0 – 85.5) 2.21 (1.64 – 2.25) 1.99 (1.54 – 2.56)
Participation in social groups
No 47.7 (33.2 – 62.6) 1
0.265 –
Yes 38.2 (30.5 – 46.5) 0.80 (0.54 – 1.19)
Level of physical activity during leisure times (minutes per week)
< 150 38.1 (31.1 – 45.7) 1
0.010* 1 0.150
≥ 150 57.3 (42.1 – 71.3) 1.50 (1.11 – 2.05) 1.22 (0.93 – 1.60)
Others
Falls
No 39.9 (33.3 – 47.0) 1
0.454 –
Yes 45.8 (31.0 – 61.3) 1.15 (0.80 – 1.65)
previous studies22-24. Among the elderly, depression is a very common mental health
prob-lem22, which, if left untreated, increases the risk of morbidity and mortality, not to mention
is associated with a social and economic burden23.
Positive self-perceived health was also associated with alcohol consumption among the long-lived elderly. Studies25-29 have also observed an association between higher alcohol
con-sumption and positive health perception, after adjustment for sociodemographic and life-style variables, corroborating the findings of this investigation. Other research showed that the prevalence of negative self-perceived health was higher among those who had stopped drinking, followed by individuals who did not drink27.
The increase in age is an important determinant of the amount of alcohol being consumed. Older people consume less alcohol when compared to younger people, but they consume it more frequently29. Moderate drinking is associated with some good
health conditions,27-29 such as better cognition and lower risk of dementia30, better
func-tional performance30, less depressive symptoms27, some protection against
cardiovascu-lar diseases31 and asthma32, lower mortality29,31 and better quality of life28,33, which can
explain the positive self-perceived health of these elderly people. This association can also be explained by the higher probability of a social bond among alcohol-consuming elderly individuals28.
However, these results may be questioned by some biases. One bias may be economic condition, in which people with a higher income consume more alcohol and can access health services more frequently, thereby reducing the impact of alcohol on their health34.
Another point of discussion is that older people who consume alcohol do so because they are healthier, and this is the most likely explanation for the association found between alcohol and positive self-perceived health, in addition to social ties. It is also important to mention that there is a difference in the evaluation of alcohol consumption among the studies, since some studies evaluate low, moderate and high consumption26, some evaluate only
moder-ate use29,30, some evaluate consumption doses26,26,33, and lastly, some evaluate frequency of
consumption in days26,33, months26 or years27, compared to individuals who have never
con-sumed and/or individuals who stopped consuming alcohol.
Nevertheless, further investigations are necessary regarding the relationship between health perception and alcohol consumption in the long-lived elderly. The authors of this study do not recommend that elderly people consume alcohol in order to have a positive self-perception of their health, considering that the public health approach in the UK pro-motes responsible drinking, which seeks to balance the potential benefits of drinking with possible harms34. Furthermore, the Ministry of Health’s recommends no alcohol
consump-tion for improved health and the prevenconsump-tion of chronic diseases34.
1. Organização Mundial de Saúde. Envelhecimento ativo: uma política de saúde. Brasília: Organização Pan-Americana da Saúde; 2005.
2. Instituto Brasileiro de Geografia e Estatística. Síntese de indicadores sociais – Uma análise das condições de vida da população brasileira [Internet]. Rio de Janeiro: Instituto Brasileiro de Geografia e Estatística; 2010. Disponível em: https://ww2.ibge.gov.br/ home/estatistica/populacao/trabalhoerendimento/ pnad2015/default_sintese.shtm (Acessado em 26 de junho de 2011).
3. Pinquart M. Correlates of subjective health in older adults: a meta-analysis. Psychol Aging. 2001; 16: 414-26. 4. Moschny A, Platen P, Klaassen-Mielke R, Trampich
U, Hinrichs T. Barriers to physical activity in older adults in Germany: a cross-sectional study. Int J
Behav Nutr Phys Activity. 2011; 8: 121. https://doi. org/10.1186/1479-5868-8-121
5. Borim FS, Barros MBA, Neri AL. Autoavaliação da saúde em idosos: pesquisa de base populacional no Município de Campinas, São Paulo, Brasil. Cad Saúde Pública. 2012; 28(4): 769-80. http://dx.doi.org/10.1590/ S0102-311X2012000400016
6. Pagotto V, Bachion MM, Silveira EA. Autoavaliação da saúde por idosos brasileiros: revisão sistemática da literatura. Rev Panam Salud Publica. 2013; 33(4): 302-10. 7. Pavão ALB, Werneck GL, Campos MR. Autoavaliação do estado de saúde e a associação com fatores sociodemográficos, hábitos de vida e morbidade na população: um inquérito nacional. Cad Saúde Pública. 2013; 29(4): 723-34. http://dx.doi.org/10.1590/ S0102-311X2013000400010
REFERENCES
sickest patients died or were admitted to long-term care facilities for the elderly, and there-fore were not interviewed.
A positive aspect of this study was the fact that research with long-lived elderly people is still rarely studied in Brazil, due to the difficulty of contacting this group, which further illustrates the importance of researching this specific population. Also, the fact that the research’s outcome is that of positive self-perceived health as opposed to negative self-per-ceived health differs from most studies.
Longitudinal investigations may contribute to a better understanding of the associations found. In this regard, the EpiFloripa Idoso project continued the study and carried out a new wave of collections in the years 2013 and 2014.
CONCLUSION
8. Loyola Filho AI, Firmo JOA, Uchôa E, Lima-Costa MF. Fatores associados a autoavaliação negativa da saúde entre idosos hipertensos e/ou diabéticos: resultados do projeto Bambuí. Rev Bras Epidemiol. 2013; 16(3): 559-71. 9. Arnadottir SA, Gunnarsdottir ED, Stenlund H,
Lundin-Olsson L. Determinants of self-rated health in old age: a population-based, cross-sectional study using the International Classification of Functioning. BMC Public Health. 2011; 11: 670. https://doi. org/10.1186/1471-2458-11-670
10. Lorenzo T, Millán-Calenti JC, Lorenzo-López L, Sánchez A, Maseda A. Predictores de mala salud autopercibida en una población de personas mayores. Rev Esp Geriatr Gerontol. 2013; 48(6): 272-5. DOI: 10.1016/j.regg.2013.04.002
11. Sargent-Cox KA, Anstey KJ, Luszcz MA. The choice of self-rated health measures matter when predicting mortality: evidence from 10 years follow-up of the Australian longitudinal study of ageing. BMC Geriatr. 2010; 10: 18. https://dx.doi. org/10.1186%2F1471-2318-10-18
12. Lacruz ME, Emeny RT, Baumert J, Ladwig KH. Prospective association between self-reported life satisfaction and mortality: Results from the MONICA/KORA Augsburg S3 survey cohort study. BMC Public Health. 2011; 11: 579. https://doi. org/10.1186/1471-2458-11-579
13. Confortin SC, Giehl MWC, Antes DL, Schneider IJC, d’Orsi E. Autopercepção positiva de saúde em idosos: estudo populacional no Sul do Brasil. Cad Saúde Pública. 2015; 31(5): 1049-60. http://dx.doi. org/10.1590/0102-311X00132014
14. d’Orsi E, Ed. Condições de saúde da população idosa do município de Florianópolis-SC: estudo de base populacional. Pesquisa financiada pelo Conselho Nacional de Desenvolvimento Científico e Tecnológico (Processo nº 569834/2008-2).
15. Ware JE Jr., Kosinski M, Keller SD. A 12-item Short-Form Health Survey: construction of scales and preliminary tests of reliability and validity. Med Care. 1996; 34: 220-33.
16. Bertolucci PHF, Brucki SMD, Campacci SR, Juliano Y. O mini-exame do estado mental em uma população geral: impacto da escolaridade. Arq Bras Neuropsiquiatr. 1994; 52(1): 1-7. http://dx.doi.org/10.1590/ S0004-282X1994000100001
17. Almeida OP. Mini mental state examination and the diagnosis of dementia in Brazil. Arq Bras Neuropsiquiatr. 1998; 56(3B): 605-12. http://dx.doi. org/10.1590/S0004-282X1998000400014
18. Babor TF, Higgins-Biddle JC, Saunders JB, Monteiro MG. Audit: The Alcohol Use Disorders Identification Test. 2ª ed. Word Health Organization: Genebra; 1993.
19. Magallón TJC, Robazzi MLC. Consumo de Alcohol em Trabajadores de uma Industria em Monterrey, México. Rev Latino-am Enferm. 2005; 13(número especial): 819-26. http://dx.doi.org/10.1590/ S0104-11692005000700009
20. Meneses-Gaya C, Zuardi AW, Loureiro SR, Crippa JAS. Alcohol Use Disorders Identification Teste (AUDIT): na updated systematic review of psychometric properties. Psychol Neurosci. 2009; 2(1): 83-97. http://dx.doi. org/10.3922/j.psns.2009.1.12
21. Craig CL, Marshall AL, Sjöström M, Bauman AE, Booth ML, Ainsworth BE, et al. International physical activity questionnaire: 12-country reliability and validity. Med Sci Sports Exerc. 2003; 35(8): 1381-95. https:// doi.org/10.1249/01.MSS.0000078924.61453.FB 22. Millán-Calenti JC, Sánchez A, Lorenzo T, Maseda A.
Depressive symptoms and other factors associated with poor self-rated health in the elderly: gender differences. Geriatr Gerontol Int. 2012; 12(2): 198-206. https://doi.org/10.1111/j.1447-0594.2011.00745.x 23. Ocampo-Chaparro JM, Zapata-Ossa HJ,
Cubides-Munévar AM, Curcio CL, Villegas JD, Reyes-Ortiz CA. Prevalence of poor self-rated health and associated risk factors among older adults in Cali, Colombia. Colomb Med. 2013; 44(4): 224-31.
24. Blake H, Mo P, Malik S, Thomas S. How effective are physical activity interventions for alleviating depressive symptoms in older people? A systematic review. Clin Rehabil. 2009; 23: 873-87. https://doi. org/10.1177/0269215509337449
25. Poikotainen K, Vartiainen E, Korhonen HJ. Alcohol intake and subjective health. Am J Epidemiol. 1996; 144: 346-50. https://doi.org/10.1093/oxfordjournals. aje.a008935
26. Frisher M, Mendonça M, Shelton N, Pikhart H, Oliveira C, Holdsworth C. Is alcohol consumption in older adults associated with porr self-rated health? Cross-sectional and longitudinal analyses from the English Longitudinal Study of Ageing. BMC Public Health. 2015; 15: 703-9. https://doi.org/10.1186/ s12889-015-1993-x
27. Balsa AI, Homer JF, Fleming MF, French MT. Alcohol consumption and health among elders. Gerontologist. 2008; 48(5): 622-36.
28. Linda Ng Fat. Are we overestimating the beneficial effects of alcohol in later life? The case of young non-drinkers. J Epidemiol Community Health 2012; 66: A17.
30. Lee SJ, Sudore RL, Williams BA, Lindquist A, Chen HL, Covinsky KE. Functional Limitations, Socioeconomic Status, and All-Cause Mortality in Moderate Alcohol Drinkers. J Am Geriatr Soc. 2009; 57(6): 955-62. https:// doi.org/10.1111/j.1532-5415.2009.02184.x
31. Marmot M, Shipley M, Rose G, Thomas B. Alcohol and Mortality: a U-Shaped Curve. Lancet. 2003; 317(8220): 580-3.
32. Lieberoth S. Moderate alcohol consumption protective against asthma. Amsterdã: European Respiratory Society (ERS); 2011. Annual Congress: Abstract 319. Presented September 25, 2011.
33. Chan AM, Mühlen DV, Kritz-Silverstein D, Barrett-Connor E. Regular alcohol consumption is associated
with increasing quality of life and mood in older men and women: The Rancho Bernardo Study. Maturitas. 2009; 62(3): 294-300. https://doi.org/10.1016/j.maturitas.2009.01.005 34. Brasil. Ministério da Saúde. A vigilância, o controle e
a prevenção das doenças crônicas não transmissíveis – DCNT – no contexto do Sistema Único de Saúde brasileiro [Inter net]. Brasília: Organização Pan-Americana da Saúde; 2005. Disponível em: http:// bvsms.saude.gov.br/bvs/publicacoes/DCNT.pdf (Acessado em 29 de agosto de 2016).
Received on: 03/21/2016
Final version presented on: 08/29/2016 Accepted on: 12/05/2016