contamination in the peanut production chain
André Ribeiro da Silva(1), Lívia Montanheiro Médici Zanin(1), Angélica Tieme Ishikawa(1), Cassia Reika Takabayashi Yamashita(1), Felipe Pedote Fracalossi(1), Thaís Marques Amorim(1),
Eiko Nakagawa Itano(1), Osamu Kawamaura(2) and Elisa Yoko Hirooka(1)
(1)Universidade Estadual de Londrina, Rodovia Celso Garcia Cid, PR-445, Km 380, CEP 86057-970 Londrina, PR, Brazil.
E-mail: [email protected], [email protected], [email protected], [email protected], [email protected], [email protected], [email protected], [email protected] (2)Kagawa University, Faculty of
Agriculture and Graduate School of Agriculture, Miki-cho, Japan. E-mail: [email protected]
Abstract – The objective of this work was to standardize and validate an indirect competitive enzyme-linked immunosorbent assay (ic-Elisa), as a low-cost tool, to monitor the presence of aflatoxin in common and blanched peanuts (Arachis hypogaea) in the production chain. The presence of aflatoxin B1, moisture content, and water activity were analyzed in 60 samples of the peanut cultivar Runner IAC 886, from the 2014/2015 and 2015/2016 harvests of the region of Alta Paulista, in the state of São Paulo, Brazil. The validation showed an adequate linearity (R2 = 0.999), and limits of detection and quantification of 1.13 and 3.59 μg kg-1, respectively. Recovery rates of 104, 102, and 107% at the concentrations of 4, 10, and 20 μg kg-1 aflatoxin B1, respectively, were also recorded. The ic-Elisa showed a good reproducibility with a high-intraday precision, with 1.87% coefficient of variation (CV), and interday precision with 6.75% CV. The moisture content ranged from 4.0 to 7.2% (mean of 5.8%), and the water activity from 0.4848 to 0.6997 (mean of 0.5990) for the tested samples. Aflatoxin B1 was present in concentrations ranging from 1.13 to 29.2 μg kg-1, with only two samples (3.3%) exceeding the maximum allowed limit of 20 μg kg-1. The ic-ELISA developed here is an accessible tool for the rapid monitoring of aflatoxin contamination in the peanut production chain.
Index terms: Aspergillus, aflatoxin B1, blanched peanuts, contamination, mycotoxin.
Desenvolvimento de ic-Elisa para o rastreio da contaminação
por aflatoxinas na cadeia de produção de amendoim
Resumo – O objetivo deste trabalho foi padronizar e validar um imunoensaio enzimático indireto competitivo (ic-Elisa), como ferramenta de baixo custo, para monitorar a presença de aflatoxina em amendoim comum (Arachis hypogaea) e “branqueado”, na cadeia de produção. A presença de aflatoxina B1, o teor de umidade e a atividade de água foram analisados em 60 amostras da cultivar de amendoim Runner IAC 886, das safras 2014/2015 e 2015/2016 da região da Alta Paulista, no Estado de São Paulo. A validação apresentou linearidade adequada (R2 = 0,999) e limite de detecção e quantificação de 1,13 e 3,59 µg kg-1, respectivamente. Taxas de recuperação de 104, 102 e 107% para as concentrações de 4, 10 e 20 µg kg-1 de aflatoxina B1, respectivamente, também foram registradas. O ic-Elisa mostrou boa repetibilidade, com alta precisão intradia com 1,87% de coeficiente de variação (CV), e de precisão interdia com 6,75% de CV. O teor de umidade variou de 4,0 a 7,2% (média de 5,8 %), e a atividade de água, de 0,4848 a 0,6997 (média de 0,5990), para as amostras testadas. A aflatoxina B1 esteve presente em concentrações que variaram entre 1,13 e 29,2 µg kg-1, com apenas duas amostras (3,3%) que excederam o limite máximo permitido de 20 µg kg-1. O ic-Elisa desenvolvido aqui é uma ferramenta acessível para o monitoramento rápido da contaminação por aflatoxinas na cadeia produtiva de amendoim.
Termos para indexação: Aspergillus, aflatoxina B1, amendoim “branqueado”, contaminação, micotoxina.
0.8% estimated for the 2016/2017 harvest. The state of São Paulo is the largest producer of peanut, accounting for approximately 90% of the total national production (Acompanhamento…, 2017). The regions of Alta Mogiana and Alta Paulista are also of importance
Introduction
for peanut production, from where 80% of the production is exported to European countries, while the rest is used by food industries that produce sweets (Acompanhamento…, 2017).
Aflatoxins are one of the main problems associated with peanut production, which can compromise grain quality and depreciate its commercial value. They are toxic secondary metabolites produced by the fungi belonging to the genus Aspergillus, especially by A. flavus, A. parasiticus, and A. nomius (Kensler et al., 2011). The aflatoxins – AFB1, AFB2, AFG1, and AFG2 – are commonly identified from peanut samples (Pitt & Hocking, 2009). The International Agency for Research on Cancer classified the aflatoxin B1 in Group 1, indicating its carcinogenic nature in humans (Aflatoxins, 2002). Structurally, aflatoxins are bisfurans, with dihydrofurans (AFB1 and AFG1) or tetrahydrofurans (AFB2 and AFG2) rings attached to a substituted coumarin, and are synthesized through the polyketide synthesis pathway. The synthesis begins with the conversion of acetate and malonyl CoA into a hexanoyl starter unit, which in turn forms the norsolorinic acid precursor form, followed by sequential enzymatic reactions resulting in the formation of different aflatoxin analogues (Crawford et al., 2009).
Owing to the highly toxic nature of aflatoxin, its contamination in food products is strictly controlled with a maximum allowed limit for different foods worldwide. The European Union established the maximum allowed limit for aflatoxin in peanut, in the Commission Regulation (EC) no. 1881/2006, as 15 μg kg-1 for total
aflatoxin (AFB1 + AFB2 + AFG1 + AFG2), and 8 μg
kg-1 for AFB
1, for sorting or physical treatment, prior
to human consumption (European Union, 2006a). In Brazil, RDC no. 07 of the national health surveillance agency (Agência Nacional de Vigilância Sanitária, Anvisa-MS) established 20 μg kg-1 as the maximum
allowed limit for total aflatoxin (Anvisa, 2011).
As concern about contamination remains alarming for Brazilian peanuts with aflatoxin, new, collaborative studies for the evaluation of new methodologies to identify aflatoxin contamination are essential for the reliable detection of these mycotoxins (Trucksess et al., 1991; Rodríguez-Amaya & Sabino, 2002; Martins et al., 2017).
Liquid chromatography (HPLC) coupled with a UV detector, a fluorescence detector, or a mass spectrometer as detector is the standard method used
for aflatoxin quantification due to its robustness and sensitivity (Turner et al., 2009). However, the analysis should be preceded by an extensive extraction, sample cleaning-up, and analyte concentration procedures that extend the analysis time. In addition, this methodology requires an expensive equipment, highly pure reagents, and technical expertise. These factors limit the application of this methodology for in situ and on-field analysis of aflatoxin contamination. Therefore, the agroindustry encourages the search for alternative techniques for aflatoxin detection (Kolosova et al., 2006; Ono et al., 2016).
Immunochemistry-based analytical methods do not require an expensive instrumentation, and it allows simultaneous analysis of numerous samples without the need for an extensive clean-up steps in-between, and it uses reagents which are harmless to the environment. Hence these methods are an excellent alternative for the routine rapid diagnosis from nanogram (ng) to picogram (pg) detection range (Li et al., 2009). The enzyme-linked immunosorbent assay (Elisa) stand-out as a promising rapid, sensitive, and specific alternative for a simple screening method for the analysis of aflatoxin in peanuts. The development of a monoclonal antibody-based (mAb) Elisa and the use of commercial analytical kits for the detection of aflatoxin from various food matrices have been reported earlier (Kawamura et al., 1988; Liu et al., 2013; Oplatowska-Stachowiak et al., 2016).
The anti-aflatoxin monoclonal antibody (mAb) provides unrestricted possibilities for the development of quantitative or semiquantitative assays such as Elisa intended for monitoring aflatoxins in food products. These immunochemistry-based methods employing mAb offer high-sensitivity and adequate limits of detection/quantification, in comparison with HPLC-based methods, and can be applied to different agricultural raw materials to detect the presence of toxins (Hirooka et al., 2015).
The objective of this work was to standardize and validate an ic-Elisa, as a low-cost tool, to monitor the presence of aflatoxin in common and blanched peanuts in the production chain.
Materials and Methods
from the 2014/2015 and 2015/2016 harvests, and were provided by a processing industry from the municipality of Marília, in the state of São Paulo, Brazil. From these, 42 samples were of common peanut (12 batches from the 2014/2015 harvest and 30 batches from the 2015/2016 harvest) and 18 samples of blanched peanut (6 batches from the 2014/2015 harvest and 12 batches from the 2015/2016 harvest), which were produced in five municipalities (Iacri, Herculândia, Tupã, Marília, and Queiroz), from the region of Alta Paulista, in the state of São Paulo.
The sampling plan adopted for aflatoxin analysis in peanut was adapted from the resolution of the collegiate board of directors, RDC no. 274/2002, of Agência Nacional de Vigilância Sanitária (Anvisa, 2002), by increasing the number of increments and the frequency of sampling. Each sample represented a target batch of 5 Mg, comprising 100 bags of 50 kg each. The global sampling was performed manually for every 100 bags, during the delivery of that batch to the industry. Five increments were collected from each bag at different points, through drilling at the ends and center of bags, totaling about 100 g of samples per bag. The samples from 500 increments were mixed to form a global sample of 10 kg; these samples were then completely ground in a mill to reduce them to an 18-mesh particle size, and homogenized for 5 min using a Y-type mixer with a capacity of 30 kg. A working sample of approximately 200 g was withdrawn from this homogenate, identified according to batch, origin, and receipt date, then packed in a polypropylene packaging, and stored at -18°C for further analysis.
The moisture content of the peanut samples was determined at 105°C in triplicates, in an NV 1.5 chamber (Nevoni, SP, Brazil) until the obtention of constant mass (Zenebon et al., 2008). Water activity (wa) was determined in triplicate using a 4TE water activity meter, following the manufacturer’s instructions (Aqualab, Decagon Devices, Inc., Pullman, WA, USA). Elisa was performed with mAb produced in vitro by the hybridoma strain AF4, which was specific to AFB1 (isotype IgG1 lambda) with very
low cross-reactivity to other analogues: 2.3% AFB2,
3.4% AFG1, and 2.4% AFG2 (Kawamura et al., 1988).
The extraction of aflatoxin for ic-Elisa was carried out using 4 g of ground peanut (18-mesh particle size). The sample was mixed with 0.4 g NaCl in 20 mL HPLC grade methanol:H2O (70:30, v/v) and it
was agitated for 10 min at 150 rpm. The mixture was sonicated for 3 min, and the extract was filtered first through a qualitative filter, and then through a 45 µm glass membrane (Macherey-Nagel, Düren, Germany). The filtrate (500 µL) was dried at 40°C under nitrogen stream, resuspended in 500 µL of sodium phosphate buffer containing 0.05% Tween 20 (PBST):methanol (9:1, v/v), and the same diluent was used to prepare further dilutions.
The ic-Elisa was performed using polystyrene microplates (Corning, New York, NY, USA), sensitized with 50 µL of AFB1-BSA (bovine serum albumin)
(250 ng mL-1 in 0.015 mol L-1 PBS buffer pH 7.3) and
incubated at 4°C for 18 hours. After three washes with PBST (PBS + 0.05% Tween 20), the plates were blocked with 150 µL of 0.1% BSA in PBS and incubated at 25°C for 1 hour, to minimize nonspecific binding. After three washes with PBST, 50 µL of AFB1 standard
(0.1–5.0 ng mL-1) (Aqualab, Decagon Devices, Pullman,
WA, USA), or the 5-fold diluted peanut sample was added to the wells, followed by the addition of 50 µL anti-AFB1 mAb (1:30,000, 4.9x10⁻⁸ mg mL-1) (Aqualab,
Decagon Devices, Inc., Pullman, WA, USA) in PBS were added, and the reaction was carried out at 25°C for 1 hour in triplicate. After six washes with PBST to remove unbound antibodies, 100 µL chromogen substrate TMB/H2O2 (3,3’,5,5’-tetramethylbenzidine/
hydrogen peroxide) were added and incubated for 20 min at 25°C. The enzymatic reaction was stopped by the addition of 50 µL of 1 mol L-1 H
2SO4 to
each well, and the absorbance was read at 450 nm, using a ELX800 ELISA microplate reader (BioTek Instruments, Winooski, VT, USA).
The absorbance average was calculated from the individual values obtained and the results were expressed as linking percentage: linking % = (A+/A-) × 100, in which A+ corresponds to an
average of absorbance of the sample or AFB1 standard,
and A- corresponds to an average of absorbance of
the reaction mixture without AFB1 (50 μL of 0.015
mol L-1 PBS buffer pH 7.3 + 50 μL anti-AFB
1 mAb).
The AFB1 concentration was determined from the
standard curve prepared with AFB1 diluted in 9:1 (v/v)
PBST:methanol, in which the linking percentage was plotted against the log of AFB1 concentration. The
negative control (50 μL of 0.015 mol L-1 PBS buffer pH
Intralaboratorial validation of the method was based on the following parameters: linearity, limit of detection (LOD), limit of quantification (LOQ), specificity, accuracy, precision, and robustness (European Union, 2006b; Inmetro, 2007). The AFB1 standard curve at a
range of 0.1 to 5 ng mL-1 was prepared with a stock
solution (50 ng mL-1) using PBST:methanol (9:1, v/v)
as diluent. The linearity was evaluated by linear regression and coefficient of determination (R2), using
five points of the standard curve (Inmetro, 2007). The limit of detection (LOD) was determined by calculating the blank average (50 μL of 0.015 mol L-1
PBS buffer pH 7.3 + 50 μL anti-AFB1 mAb) subtracted
from the 3.143-fold standard deviation obtained from seven replicates, whereas the limit of quantification (LOQ) was calculated by blank average subtracted from the five-fold standard deviation obtained from seven replicates (Inmetro, 2007).
The specificity was determined by evaluating the peanut matrix interference in aflatoxin detection. The standard curves, prepared in presence of the matrix (matrix) and in absence of the matrix (nonmatrix), were compared. Extracts obtained from the matrix were diluted 2, 5 and 7-fold each in PBST:methanol (9:1, v/v), and the interference was assayed. Then the matrix standard curve (0.1, 0.2, 0.5, 1.5, and 5.0 ng mL-1 AFB
1) was prepared with the extract diluted to the
previously determined dilution factor (five-fold), and compared with the reference standard curve prepared with PBST:methanol (9:1, v/v).The mean values for the reference curve and the matrix curve were compared by the Student’s t-test, as well as by the analysis of standard deviations. Accuracy was evaluated by assaying the recovery of aflatoxin, that is, by spiking three different concentrations of AFB1 (artificial contamination) into a
pool of peanut samples in linear range (4.0, 10.0, and 20.0 μg kg-1) in triplicate. Such a pool was prepared by
homogenizing 15 peanut samples of 7.0 g each (AFB1
level <LOD by ic-Elisa). The precision was evaluated by determining the repeatability of the assay on the same day, when recovery of three concentrations was analyzed in seven replicates; and the intermediate precision was evaluated by measuring the recovery of three concentrations in seven replicates on three different days. The robustness of the assay was assessed by allowing different analysts to perform the analysis, varying the time for plate sensitization with AFB1-BSA
(18 and 24 hours), and using pipettes of different brands
for preparation of anti-AFB1 and anti-IgG-HRP solutions.
The time of plate sensitization with AFB1-BSA has been
considered as the most critical factor among the tested parameters. The efficiency of immunoassay depends on the antigen immobilization on plate surface, which allows of the competition with antigen (mycotoxin in the sample for binding with anti-AFB1 mAb.
The parametric data generated from the validation assays of ic-Elisa was evaluated by analysis of variance, followed by Tukey’s test, at 5% probability, and the statistical analyses were carried out using the software Statistica, version 10 (Dell Statistica, Tulsa, OK, USA).
Results and Discussion
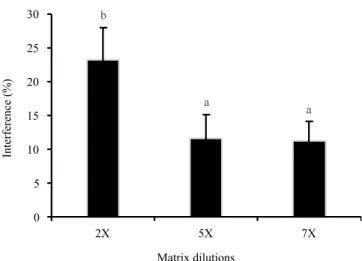
The evaluation of matrix interference is essential in the analysis of mycotoxins by ic-Elisa, as the complexity of the intrinsic macro- and micronutrient compounds present in food could lead to a false positive reaction. Such matrices directly interfere with the analyte (antigen)–antibody interaction (Lee et al., 2004). This undesired interference can be minimized by simple sample dilution, or by including adequate cleaning-up steps prior to the analysis. However, the dependence on expensive imported commercial kits discourages the constant repetitive analysis of the same sample or its dilutions in the field of agroindustry (Ono et al., 2004; Hirooka et al., 2015).
The specificity of ic-Elisa and its improvement with respect to matrix interference was evaluated by analyzing noncontaminated peanut samples at two, five, and seven-fold dilutions. Figure 1 shows that both five and seven-fold dilutions reduced the matrix interference, with average values of 11.6%±3.50, with coefficient of variation (CV) of 3.32%, and 11.2%±2.85, with CV of 3.92%, respectively, which differ significantly from the values of two-fold dilution. Therefore the 5-fold dilution was chosen for further analysis, as its coefficient of variation falls within the value specified in European guidelines, and it also ensured a good recovery, that is, on average 103% recovery was observed when 10 ng g-1 AFB
1 was used
Standard curves were developed with nonmatrized as well as matrized peanut extracts at 5-fold dilution, to minimize the interference (Figure 2). Comparing the deviations shown in both the standard curves (0.1 to 5.0 ng mL-1 AFB
1), an overlap of deviations could
be observed for every data point in the curve. The similarity shown by analysis of averages, through the Student’s test, proved that there was no significant difference (p>0.5). Therefore, the nonmatrix standard curve was used as the basis for calculation, after the subtraction of the matrix interference (11.6%). The linearity of R²=0.9993 observed was in accordance with the minimum acceptable value of R2=0.999
according to Inmetro (2007).
The limit of detection (LOD) and the limit of quantitation (LOQ) for aflatoxin by ic-Elisa were identified to be 0.045 ng mL-1 (1.13 μg kg-1) and 0.143
ng mL-1 (3.59 μg kg-1), respectively. These values are
in accordance with the Brazilian guidelines (20 μg kg-1
of total aflatoxin in peanut), as well as the European guidelines (8 μg kg-1 in peanut to be subjected to
sorting or to other physical treatment, before human consumption). The LOD obtained in the present study was better than that reported by Lipigorngoson et al. (2003) for a monoclonal antibody-based dc-Elisa for AFB1 in corn and peanut. These authors reported an
LOD of 4.0 µg kg-1 with a recovery rate of 88.1 and
99.5%, respectively.
The recovery rate of AFB1 to evaluate the accuracy
of the method is depicted in Table 1. The recovery rates in peanuts spiked with 4, 10, and 20 μg kg-1 AFB
1
ranged from 97.5 to 108.7%, 93.5 to 109%, and 106.5 to 108%, respectively. The recovery rate obtained for the tested concentrations were within the recommended values of the European Community, that is, within 70 to 110% for a contamination range of 1 to 10 µg kg-1,
and 80 to 110% for levels above 10 µg kg-1 (European
Union, 2006b). Asis et al. (2002) reported a recovery rate of 107%, and a correlation of 0.977 with the HPLC method for an ic-Elisa developed for quantification of AFB1 in peanut butter. Subsequently, Li et al. (2009)
also reported a recovery rate ranging from 97 to 102%,
Figure 1. Effect of matrix dilution on the reduction of the
interference in the determination of AFB1 by ic-ELISA in peanut (Arachis hypogaea) samples. Results expressed as 0% mean interference, n=7. Significant difference between a and b, by one-way analysis of variance, at 5% probability.
b
a
a
0 5 10 15 20 25 30
2X 5X 7X
Interference (%)
Matrix dilutions
Figure 2. Analysis of deviations in the standard curve for AFB1 determination in peanut (Arachis hypogaea) samples, in the presence and absence of matrix. Data points represent the mean percentage values from three standard curves performed in triplicates in different days. The error bars represent the standard deviation.
Table 1. Recovery of AFB1 in peanut (Arachis hypogaea) samples by ic-Elisa.
AFB1 added (μg kg-1)
Mean±SD(1) (μg kg-1)
CV (%)
Recovery (%)
Reference values(2) (%)
4 4.1±0.20 4.9 104.4 70 to 110% 10 10.1±0.81 7.9 101.7 70 to 110% 20 21.5±0.16 0.7 107.7 80 to 110%
(1)Results expressed in mean±standard deviation (SD) of three replicates,
analyzed in seven replicates. (2)Regulation (EC) no. 401/2006 (European
when peanuts spiked with 0.1 to 0.2 μg kg-1 AFB 1 were
analyzed by immunoassay.
The precision was analyzed by evaluating the repeatability and the intermediate precision using three AFB1 levels in peanut (4, 10, and 20 μg kg-1).
Both parameters showed a coefficient of variation lower than 15% for every tested level, with an average variation of 1.87% for the repeatability, and 6.75% for the intermediate precision, as recommended by the Brazilian guidelines (Anvisa, 2003), indicating a small variation between the intra- and interday data.
The robustness was evaluated by changing the operator to generate a standard curve. The CV values were obtained by analyzing five toxin concentrations from 0.1 to 5.0 ng mL-1 in triplicates on seven different
days. The low CV of 4 to 13% indicated a low variation after changing the analyst. Similarly, the time duration for plate sensitization with AFB1-BSA, as well as the
use of pipettes of different brands to prepare the anti-AFB1 and anti-IgG-HRP showed a low CV, assuring
an adequate repeatability. To summarize, the ic-Elisa showed enough robustness concerning the three tested variables, and it enabled an approximate 160-fold cost reduction when compared with expensive imported kits.
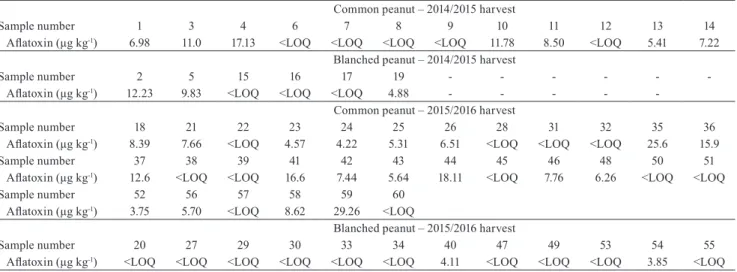
The detected aflatoxin levels, in the 60 batches of peanut analyzed by this ic-Elisa, are summarized in Table 2. Considering the critical importance of
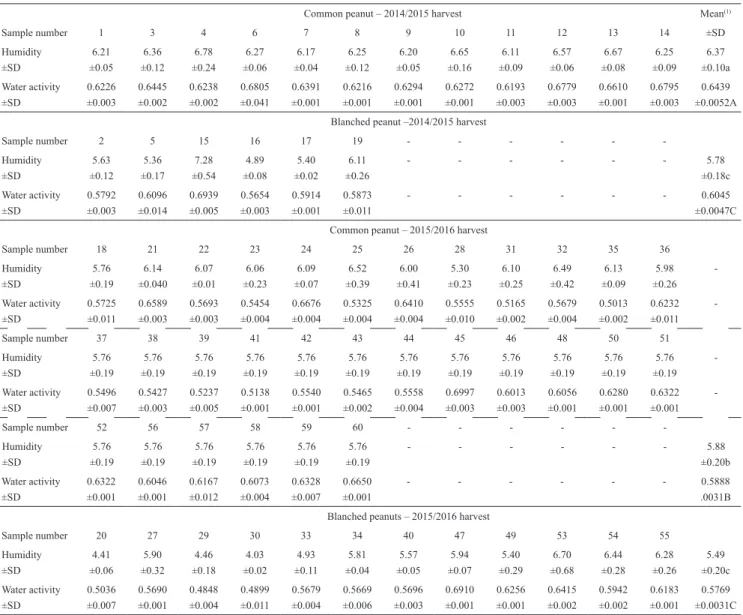
moisture and water activity in aflatoxin production, in the peanut production chain, these parameters were also analyzed for the same 60 samples (Table 3).
Humidity ranged from 5.30 to 6.78% (common) and from 4.0 and 7.28% (blanched). The harvest did not affect the moisture content in blanched peanut Runner IAC 886 cultivar and showed an average of 5.78%±0.18 and 5.49%±0.20 for 2014/15 (n=6) and 2015/2016 (n=12) harvests, respectively. However, there was a difference in the moisture content of the common peanut with respect to the harvest, with 6.37%±0.10 and 5.88%±0.20 for 2014/2015 (n=12) and 2015/2016 (n=30) harvests, respectively (p<0.05). These samples met the maximum limit criteria of 8.0% humidity allowed for shelled peanuts, as established by the Resolution RDC No 274 of Anvisa (2002). The maximum moisture in nonshelled peanut should be 7.0%, under a relative humidity of 70% at 25–27°C, for approximately one-year storage (Waliyar et al., 2008). Batches of blanched peanut showed 5.59% humidity, that is, lower than the 6.02% detected for untreated peanut (p<0.05). Such lower moisture content in blanched peanut batches, in comparison with untreated peanut, can be attributed to the thermal processing employed in blanching to remove peanut skin at 85–90°C for 30–45 min (Schirack et al., 2006).
The values for aw ranged from 0.4848 to 0.6939 (average of 0.5861±0.004) in blanched peanut, and
Table 2. Measurement of aflatoxin in the common and blanched peanuts Runner IAC 886 (Arachis hypogaea) cultivar from the Alta Paulista region, in the state of São Paulo, Brazil, in the 2014/2015 and 2015/2016 harvests(1).
Common peanut – 2014/2015 harvest
Sample number 1 3 4 6 7 8 9 10 11 12 13 14
Aflatoxin (µg kg-1) 6.98 11.0 17.13 <LOQ <LOQ <LOQ <LOQ 11.78 8.50 <LOQ 5.41 7.22
Blanched peanut – 2014/2015 harvest
Sample number 2 5 15 16 17 19 - - -
-Aflatoxin (µg kg-1) 12.23 9.83 <LOQ <LOQ <LOQ 4.88 - - - -
-Common peanut – 2015/2016 harvest
Sample number 18 21 22 23 24 25 26 28 31 32 35 36
Aflatoxin (µg kg-1) 8.39 7.66 <LOQ 4.57 4.22 5.31 6.51 <LOQ <LOQ <LOQ 25.6 15.9
Sample number 37 38 39 41 42 43 44 45 46 48 50 51
Aflatoxin (µg kg-1) 12.6 <LOQ <LOQ 16.6 7.44 5.64 18.11 <LOQ 7.76 6.26 <LOQ <LOQ
Sample number 52 56 57 58 59 60
Aflatoxin (µg kg-1) 3.75 5.70 <LOQ 8.62 29.26 <LOQ
Blanched peanut – 2015/2016 harvest
Sample number 20 27 29 30 33 34 40 47 49 53 54 55
Aflatoxin (µg kg-1) <LOQ <LOQ <LOQ <LOQ <LOQ <LOQ 4.11 <LOQ <LOQ <LOQ 3.85 <LOQ
Table 3. Moisture content and water activity in the common and blanched peanuts Runner IAC 886 (Arachis hypogaea) cultivar from the state of São Paulo, Brazil, in the 2014/2015 and 2015/2016 harvests.
Common peanut – 2014/2015 harvest Mean(1)
Sample number 1 3 4 6 7 8 9 10 11 12 13 14 ±SD
Humidity ±SD 6.21 ±0.05 6.36 ±0.12 6.78 ±0.24 6.27 ±0.06 6.17 ±0.04 6.25 ±0.12 6.20 ±0.05 6.65 ±0.16 6.11 ±0.09 6.57 ±0.06 6.67 ±0.08 6.25 ±0.09 6.37 ±0.10a Water activity ±SD 0.6226 ±0.003 0.6445 ±0.002 0.6238 ±0.002 0.6805 ±0.041 0.6391 ±0.001 0.6216 ±0.001 0.6294 ±0.001 0.6272 ±0.001 0.6193 ±0.003 0.6779 ±0.003 0.6610 ±0.001 0.6795 ±0.003 0.6439 ±0.0052A Blanched peanut –2014/2015 harvest
Sample number 2 5 15 16 17 19 - - -
-Humidity ±SD 5.63 ±0.12 5.36 ±0.17 7.28 ±0.54 4.89 ±0.08 5.40 ±0.02 6.11 ±0.26
- - - 5.78
±0.18c Water activity ±SD 0.5792 ±0.003 0.6096 ±0.014 0.6939 ±0.005 0.5654 ±0.003 0.5914 ±0.001 0.5873 ±0.011
- - - 0.6045
±0.0047C Common peanut – 2015/2016 harvest
Sample number 18 21 22 23 24 25 26 28 31 32 35 36
Humidity ±SD 5.76 ±0.19 6.14 ±0.040 6.07 ±0.01 6.06 ±0.23 6.09 ±0.07 6.52 ±0.39 6.00 ±0.41 5.30 ±0.23 6.10 ±0.25 6.49 ±0.42 6.13 ±0.09 5.98 ±0.26 -Water activity ±SD 0.5725 ±0.011 0.6589 ±0.003 0.5693 ±0.003 0.5454 ±0.004 0.6676 ±0.004 0.5325 ±0.004 0.6410 ±0.004 0.5555 ±0.010 0.5165 ±0.002 0.5679 ±0.004 0.5013 ±0.002 0.6232 ±0.011
-Sample number 37 38 39 41 42 43 44 45 46 48 50 51
Humidity ±SD 5.76 ±0.19 5.76 ±0.19 5.76 ±0.19 5.76 ±0.19 5.76 ±0.19 5.76 ±0.19 5.76 ±0.19 5.76 ±0.19 5.76 ±0.19 5.76 ±0.19 5.76 ±0.19 5.76 ±0.19 -Water activity ±SD 0.5496 ±0.007 0.5427 ±0.003 0.5237 ±0.005 0.5138 ±0.001 0.5540 ±0.001 0.5465 ±0.002 0.5558 ±0.004 0.6997 ±0.003 0.6013 ±0.003 0.6056 ±0.001 0.6280 ±0.001 0.6322 ±0.001
-Sample number 52 56 57 58 59 60 - - -
-Humidity ±SD 5.76 ±0.19 5.76 ±0.19 5.76 ±0.19 5.76 ±0.19 5.76 ±0.19 5.76 ±0.19
- - - 5.88
±0.20b Water activity ±SD 0.6322 ±0.001 0.6046 ±0.001 0.6167 ±0.012 0.6073 ±0.004 0.6328 ±0.007 0.6650 ±0.001
- - - 0.5888
.0031B Blanched peanuts – 2015/2016 harvest
Sample number 20 27 29 30 33 34 40 47 49 53 54 55
Humidity ±SD 4.41 ±0.06 5.90 ±0.32 4.46 ±0.18 4.03 ±0.02 4.93 ±0.11 5.81 ±0.04 5.57 ±0.05 5.94 ±0.07 5.40 ±0.29 6.70 ±0.68 6.44 ±0.28 6.28 ±0.26 5.49 ±0.20c Water activity ±SD 0.5036 ±0.007 0.5690 ±0.001 0.4848 ±0.004 0.4899 ±0.011 0.5679 ±0.004 0.5669 ±0.006 0.5696 ±0.003 0.6910 ±0.001 0.6256 ±0.001 0.6415 ±0.002 0.5942 ±0.002 0.6183 ±0.001 0.5769 ±0.0031C
(1)Means followed by equal letters, lowercase for humidity and uppercase for water activity in the column mean, do not differ by Tukey’s test, at 5%
probability.
from 0.5013 to 0.6998 (average of 0.6045±0.005) in untreated batches (average value considers both the 2014/2015 and 2015/2016 harvests). There was no difference in the average aw values concerning harvest in blanched peanuts. However, there was a difference in untreated batches, which showed an average value of 0.6439±0.0052 for the 2014/2015 harvest, in comparison with 0.5888±0.0031 for the 2015/2016 harvest (Table 3). The aw in both untreated and blanched peanut were within the safe range, considering the minimum aw to support A. flavus
growth (0.78 to 0.80), and for aflatoxin production (0.82) (Pitt & Hocking, 2009). Zorzete et al. (2013) also reported similar data with aw from 0.45 to 0.62, in a monthly analysis involving 35 samples of the Runner IAC 886 and 35 samples of Caiapó peanuts cultivars for six months.
Although aflatoxin was detected in 83.3% (n=50) of peanut batches, with 5.77 µg kg-1 (range, 1.13
to 29.2 µg kg-1), only two samples (3.3%) showed
contamination level higher than 20 µg kg-1 (Table 2), as
to the European guidelines, 76% (n=46) of the samples were within the maximum allowed limit of 8 µg kg-1
established for peanut to be subjected to sorting or other physical treatment, before human consumption (European Union, 2006a).
The presence of aflatoxin in peanut, detected in the present study (Table 2), was lower than that reported in a previous study, with 60 samples of Runner IAC 886 peanut cultivar, in the municipality of Tupã, in the state of São Paulo, Brazil (Nakai et al., 2008). These authors have detected AFB1 in 33.3% samples (n=20, 7.0–116
µg kg-1), and AFB
2 in 28.3% samples (n=17, 3.3–45.5
μg kg-1); however, 17 (28.3%) samples exceeded the
maximum allowed limit of 20 µg kg-1. Martins et al.
(2017) tracked aflatoxins in peanut production chain, and detected positivity in eight samples collected during the drying, blanching, and classification stages, out which four samples showed a contamination level over the limit established by European and Brazilian guidelines. The highest total aflatoxin contamination (100.91 μg kg-1) was observed from nuts in the drying
stage.
The aflatoxin level in blanched peanuts (average of 3.31 µg kg-1; range of 1.13–12.2 µg kg-1) was lower
than that detected in untreated batches (average of 6.83 µg kg-1; range of 1.13–29.2 µg kg-1) (Table 2), showing
a significant difference between the two groups. Additionally, the moisture content (5.59%) and water activity (0.5855) of blanched peanuts were lower than those of untreated peanuts. The difference detected in the aflatoxin level of blanched peanuts is probably associated with the blanching process itself. Following the blanching and removal of the skin of peanut, an electronic selection based on color features is applied routinely, which can remove the nuts damaged by fungal growth on their surface; such procedure can reduce the level of aflatoxin in the final product (Pitt et al., 2012). However, the low water activity resulted from the blanching-heat treatment could probably reduce the amount of viable fungi, which would essentially prevent the aflatoxin production. Further maintenance in adequate storage conditions would ensure the safety of these products.
Conclusions
1. The ic-Elisa method, developed using mAb with high reactivity against AFB1, shows sensitivity,
accuracy, and robustness, for its application as a tool for rapid screening of aflatoxin in the peanut (Arachis hypogaea) production chain.
2. The accessibility of this ic-Elisa conciliates with a cost reduction of approximately 160-fold, in comparison with the currently available commercial kits.
Acknowledgments
To Conselho Nacional de Desenvolvimento Científico e Tecnológico (CNPq), to Coordenação de Aperfeiçoamento de Pessoal de Nível Superior (Capes), to Fundação Araucária, and to Japan International Cooperation Agency (Jica), for the financial support and the scholarships granted.
References
ACOMPANHAMENTO DA SAFRA BRASILEIRA [DE] GRÃOS: safra 2016/17: sexto levantamento, v.4, n.6, mar. 2017.
176p. Available at: <http://www.conab.gov.br/OlalaCMS/uploads/ arquivos/17_03_09_09_16_09_boletim_graos_marco_2017.pdf>. Accessed on: May 13 2017.
AFLATOXINS. In: IARC monographs on the evaluation of
carcinogenic risk to humans. Lyon: Iarc Press,2002. Volume 82:
some traditional herbal medicines, some mycotoxins, naphthalene
and sryrene, p. 171-300.
ANVISA. Agência Nacional de Vigilância Sanitária (Brasil).
Resolução RDC nº 7, de 18 de fevereiro de 2011. Dispõe sobre limites máximos tolerados (LMT) para micotoxinas em alimentos.
Diário Oficial da União, 22 fev. 2011. Seção 1, p.72-73.
ANVISA. Agência Nacional de Vigilância Sanitária (Brasil).
Resolução RDC nº 274, de 15 de outubro de 2002. [Aprova o Regulamento Técnico Sobre Limites Máximos de Aflatoxinas
Admissíveis no Leite, no Amendoim, no Milho]. Diário Oficial
da União, 16 out. 2002. Seção 1, p.45-46.
ANVISA. Agência Nacional de Vigilância Sanitária (Brasil).
Resolução RE nº 899, de 29 de maio de 2003. [Determina a publicação do “Guia para validação de métodos analíticos e
bioanalíticos”]. Diário Oficial da União, 2 jun. 2003. Seção 1,
p.56-59.
ASIS, R.; DI PAOLA, R.D.; ALDAO M.A.J. Determination of aflatoxin B1 in highly contaminated peanut samples using HPLC
and ELISA. Food and Agricultural Immunology, v.14, p.201-208, 2002. DOI: 10.1080/09540100220145000.
CRAWFORD, J.M.; KORMAN, T.P.; LABONTE, J.W.; VAGSTAD, A.L.; HILL, E.A.; KAMARI-BIDKORPEH, O.;
EUROPEAN UNION. Commission Regulation (EC) nº 1881/2006 laying down the methods of sampling and analysis for the official
control of the levels of mycotoxins in foodstuffs. Official Journal
of the European Union, L 70/13, Dec. 20 2006a. 24p.
EUROPEAN UNION. Commission Regulation (EC) nº 401/2006 setting maximum levels for certain contaminants in foodstuffs.
Official Journal of the European Union, L 364, Mar. 9 2006b. 23p.
HIROOKA, E.Y.; ONO, E.Y.S.; TAKABAYASHI-YAMASHITA,
C.R.; ISHIKAWA, A.T.; BARBIN, D.F.; BORDINI, M.T.H.; RISSO, W.E.; FELÍCIO, A.L.S.M.; BAGATIN, A.K.; MIGUEL, T.Á.; SOUZA, T.M.; TABUCHI, Y.; ROSA, J.L.; MACIEL, L.F.; SILVA, D.L.D.; SOBOTTKA, R.P.; PRANDO, A.M.; GARCIA,
S.; ZUCARELI, C.; KURODA, E.K.; HASHIMOTO, E.H.; ANDRADE, D. de S.; MIRANDA, M.Z.; MIRANDA, M.S.; BISPO, E.S.; SOARES, A.L.; SHIMOKOMAKI, M.; SABINO,
M.; ITANO, E.N.; TSUTSUMI, T.; NAGATA, S.; SUGIURA,
Y.; HARADA, K.-I.; KAWAMURA, O. Safety and quality in the agricultural product chain in Brazil. In: EISSA, A.H.A. (Ed.).
Food production and industry. InTech, 2015. p.137-165. DOI: 10.5772/60593.
INMETRO. Instituto Nacional de Metrologia, Qualidade e Tecnologia. DOQ-CGCRE-008: orientação sobre validação de
métodos e ensaios químicos. Brasília, 2007. Revisão 2.
KAWAMURA, O.; NAGAYAMA, S.; SATO, S.; OHTANI, K.;
UENO, I.; UENO, Y. A monoclonal antibody-based
enzyme-linked immunosorbent assay of aflatoxin B1 in peanut products.
Mycotoxin Research, v.4, p.75-87, 1988. DOI: 10.1007/
BF03192102.
KENSLER, T.W.; ROEBUCK, B.D.; WOGAN, G.N.; GROOPMAN, J.D. Aflatoxin: a 50-year odyssey of mechanistic
and translational toxicology. Toxicological Sciences, v.120,
p.28-48, 2011. DOI: 10.1093/toxsci/kfq283.
KOLOSOVA, A.Y.; SHIM, W.-B.; YANG, Z.-Y.; EREMIN, S.A.; CHUNG, D.-H. Direct competitive ELISA based on monoclonal
antibody for detection of aflatoxin B1. Stabilization of ELISA kit
components and application to grain samples. Analytical and Bioanalytical Chemistry, v.384, p.286-294, 2006. DOI: 10.1007/ s00216-005-0103-9.
LEE, N.A.; WANG, S.; ALLAN, R.D.; KENNEDY, I.R. A rapid aflatoxin B1 ELISA: development and validation with reduced
matrix effects for peanuts, corn, pistachio, and soybeans. Journal
of Agricultural and Food Chemistry, v.52, p.2746-2755, 2004. DOI: 10.1021/jf0354038.
LI, P.; ZHANG, Q.; ZHANG, W. Immunoassays for aflatoxins. Trends in Analytical Chemistry, v.28, p.1115-1126, 2009. DOI: 10.1016/j.trac.2009.07.003.
LIPIGORNGOSON, S.; ALI, N.; YOSHIZAWA, T. Limited survey for aflatoxin contamination of polished rice imported
into Japan. Mycotoxins, v.53, p.95-101, 2003. DOI: 10.2520/
myco.53.95.
LIU, B.-H.; HSU, Y.-T.; LU, C.-C.; YU, F.-Y. Detecting
aflatoxin B1 in foods and feeds by using sensitive rapid
enzyme-linked immunosorbent assay and gold nanoparticle immunochromatographic strip. Food Control, v.30, p.184-189, 2013. DOI: 10.1016/j.foodcont.2012.07.008.
MARTINS, L.M.; SANT’ANA, A.S.; FUNGARO, M.H.P.; SILVA, J.J.; NASCIMENTO, M. da S. do; FRISVAD, J.C.;
TANIWAKI, M.H. The biodiversity of Aspergillus section Flavi
and aflatoxins in the Brazilian peanut production chain. Food
Research International, v.94, p.101-107, 2017. DOI: 10.1016/j. foodres.2017.02.006.
NAKAI, V.K.; ROCHA, L. de O.; GONÇALEZ, E.; FONSECA, H.; ORTEGA, E.M.M.; CORRÊA, B. Distribution of fungi and
aflatoxins in a stored peanut variety. Food Chemistry, v.106,
p.285-290, 2008. DOI: 10.1016/j.foodchem.2007.05.087.
ONO, E.Y.S.; BORDINI, J.G.; OMORI, A.M.; HIROZAWA, M.T.; ONO, M.A. Métodos imunológicos para a detecção de fungos toxigênicos e micotoxinas em grãos, alimentos e
rações. In: RESENDE, R.R. (Org.). Biotecnologia Aplicada à
Agro&indústria. São Paulo: Blucher, 2016. v.4, p.895-936. DOI: 10.5151/9788521211150-24.
ONO, E.Y.S.; MENDES, A.M.; MEIRELLES, P.G.; HIROOKA, E.Y.; ONO, M.A. Micotoxinas em alimentos: progressos na
imunodectecção. Biotecnologia, Ciência e Desenvolvimento,
v.32, p.69-80, 2004.
OPLATOWSKA-STACHOWIAK, M.; SAJIC, N.; XU, Y.; HAUGHEY, S.A.; MOONEY, M.H.; GONG, Y.Y.; VERHEIJIN, R.; ELLIOTT, C.T. Fast and sensitive aflatoxin B1 and total aflatoxins ELISAs for analysis of peanuts, maize and feed
ingredients. Food Control, v.63, p.239-245, 2016. DOI: 10.1016/j. foodcont.2015.11.041.
PITT, J.I.; HOCKING, A.D. Fungi and food spoilage. 3rd ed. New
York: Springer, 2009. DOI: 10.1007/978-0-387-92207-2.
PITT, J.I.; TANIWAKI, M.H.; COLE, M.B. Mycotoxin production in major crops as influenced by growing, harvesting, storage and processing, with emphasis on the achievement of Food Safety
Objectives. Food Control,v.32, p.205-215, 2012. DOI: 10.1016/j. foodcont.2012.11.023.
RODRÍGUEZ-AMAYA, D.B.; SABINO, M. Mycotoxin
research in Brazil: the last decade in review. Brazilian Journal
of Microbiology, v.33, p.1-11, 2002. DOI: 10.1590/S1517-83822002000100001.
SCHIRACK, A.V.; DRAKE, M.; SANDERS, T.H.; SANDEEP,
K.P. Impact of microwave blanching on the flavor of roasted
peanuts. Journal of Sensory Studies, v.21, p.428-440, 2006.
DOI: 10.1111/j.1745-459X.2006.00075.x.
TRUCKSESS, M.W.; STACK, M.E.; NESHEIM, S.; PAGE, S.W.; ALBERT, R.H.; HANSEN, T.J.; DONAHUE, K.F. Immunoaffinity column coupled with solution fluorometry
or liquid chromatography postcolumn derivatization for
determination of aflatoxins in corn, peanuts, peanut butter:
collaborative study. Journal of the Association of Official
Analytical Chemists, v.74, p.81-88, 1991.
TURNER, N.W.; SUBRAHMANYAM, S.; PILETSKY, S.A.
Analytical methods for determination of mycotoxins: a review. Analytica Chimica Acta, v.632, p.168-180, 2009. DOI: 10.1016/j. aca.2008.11.010.
USDA. United States Department of Agriculture. World agricultural production. 2016. (USDA. Foreign agricultural
cornell.edu/usda/fas/worldag-production//2010s/2016/worldag-production-01-12-2016.pdf>. Accessed on: Jan 16 2011.
WALIYAR, F.; KUMAR, P.L.; TRAORÉ, A.; NTARE, B.R.;
DIARRA, B.; KODIO, O. Pre- and postharvest management
of aflatoxin contamination in peanuts. In: LESLIE, J.F.;
BANDYOPADHYAY, R.; VISCONTI, A. (Ed.). Mycotoxins: detection methods, management, public health and agricultural trade. Wallingford: CABI, 2008. p.209-218. DOI: 10.1079/9781845930820.0209.
ZENEBON, O.; PASCUET, N.S.; TIGLEA, P. Micotoxinas. In:
ZENEBON, O.; PASCUET, N.S.; TIGLEA, P. (Coord.). Métodos
físico-químicos para análise de alimentos. 4.ed. São Paulo: Instituto Adolfo Lutz, 2008. p.759-801.
ZORZETE, P.; BAQUIÃO, A.C.; ATAYDE, D.D.; REIS, T.A.; GONÇALVES, E.; CORRÊA, B. Mycobiota, aflatoxins
and cyclopiazonic acid in stored peanut cultivars. Food Research International, v.52, p.380-386, 2013. DOI: 10.1016/j. foodres.2013.03.029.