UNIVERSIDADE DA BEIRA INTERIOR
Faculdade de Engenharia
Quantitative Analysis of Take-off Forces in Birds
Telmo José Anastácio da Silva
Tese para obtenção do Grau de Mestre em
Engenharia Aeronáutica
(2º ciclo de estudos)
Orientador: Prof. Doutor Jorge Manuel Martins Barata
Dedication
Always I feel grateful to my parents for bringing me in to the world, take care of me and educate me.
Acknowledgements
This work was performed under the scope of the LAETA-Associated Laboratory on Energy, Transport and Aeronautics sponsored by the FCT-Foundation for Science and Technology.
I want to thank my Parents, Family, Prof. Doutor Jorge Barata, Doutor Fernando Neves, Sr. Rui, LAETA associates…
Telmo Silva
Resumo
O interesse crescente nos Veículos Aéreos não Tripulados “Unmanned Air Vehicles (UAV’s)” e suas diversas utilidades em conjunto com a necessidade de seu fácil transporte e furtividade, levaram à necessidade de criar o conceito dos Micro Veículos Aéreos “Micro Air Vehicles (MAV’s)” e os Nano Veículos Aéreos “Nano Air Vehicles (NAV’s)”. Este tipo de veículos tem como fonte inspiradora os insetos e aves devido à necessária produção simultânea de sustentação e propulsão. Tal como no voo convencional, também no voo animal podem ser identificadas as fases de levantamento (descolagem) e aterragem como diferenciadas do voo longe de uma superfície de apoio. Este trabalho é dedicado ao estudo da fase de levantamento de voo de uma ave columba livia. Foram realizadas experiências para medir a força inicial produzida pela ave para iniciar o voo e a respetiva trajetória na zona próxima do ponto de apoio inicial. Estas medidas foram efetuadas com um sensor de força dotado de elevada velocidade de aquisição de dados e uma camara de alta velocidade. As principais conclusões obtidas com a realização deste trabalho é o facto de que a ave consegue produzir movimentos, que aumentar o momento total quando a ave estica o pescoço para a frente e movendo a cabeça para baixo seguido por continuação de esticamento do pescoço e movimento da cabeça para cima impelindo-se para o ar, resultando num papel principal relativamente às forças mecânicas (contra o poleiro) para o momento linear actuante nos primeiros momentos. Columba livia consegue gerar cerca de 4 vezes o seu peso em força mecânica e acima de 8 vezes o seu peso durante o 2º downstroke.
Palavras-chave
Biomimética, columba livia.Abstract
The increasing interest on Unmanned Air Vehicles (UAV’s) and their several utilities blended with the need of easy carrying and also the stealth, lead to the need to create the concept of Micro Air Vehicles (MAV’s) and the Nano Air Vehicles (NAV’s). Due to the current interest and the present lack of knowledge on the insect’s and bird’s flight, this study was intended to interpret the forces involved on the moment of the take-off of a bird, recurring to an experiment involving a fast data acquisition force sensor and high speed camera, in addition known facts from earlier studies. In order to do that a bibliographic revision was done, to know what was already studied and to find what could yet be studied. That way could be formed a link on the factors involved on the propulsion of a bird at the moment of take-off. The main conclusions obtained by this work is that the bird can produce movements that will enhance the total moment when the bird stretches its neck forward and moving head down followed by stretching even more its neck and moving head up impelling himself into the air, resulting in a main role on the mechanical forces (against perch) for the bird first moments momentum. Columba livia can generate about 4 times its weight worth mechanic force (against perch) and above 8 times its weight during the 2nd downstroke.
Keywords
Table of contents
Chapter 1………1 Introduction……….1 1.1 Biomimetics……….1 1.2 Flight Stages………..2 1.3 Motivation……….3 1.4 Literature Revision………4 Chapter 2………15 Experimental Method………15 2.1 Experimental setup………15 2.2 Measuring equipment………162.2.1 FSS1500NSB Low Profile Force……….17
2.2.2 PicoScope 2204A (USB Oscilloscope)………19
2.2.3 Photron Fastcam Mini-UX50………20
2.3 Measurements and dimensions of the bird……….21
2.4 Data acquisition system and data processing………22
2.5 Calibration process and error estimation……….26
2.6 Power source reliability……….27
Chapter 3………29
Results and discussion……….29
3.1 Take-off angle of ascent on legs………29
3.3 Forward momentum simultaneously with take-off manoeuvre……….31
3.4 Trajectory……….33
3.5 Clap and fling (wing-wing interaction)………35
3.6 Comparison of force measurements……….36
Chapter 4………39
Conclusion……….39
References………41
Appendix A – T-BIRD routines………46
List of Figures
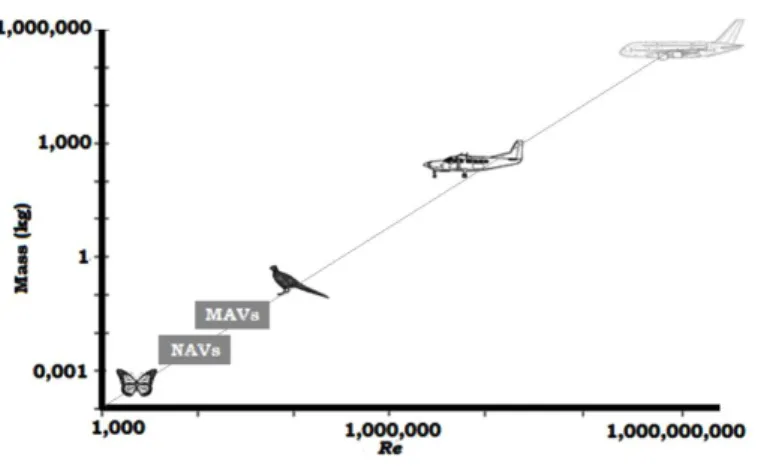
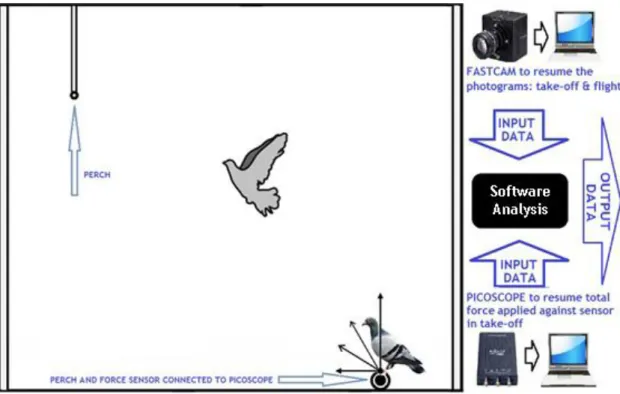
Figure 1. Classification of MAV’s and NAV’s over a relation of Mass and Reynolds Number. Figure 2. Experimental set-up.
Figure 3. On top: detailed group of the perch the attachment base for both perch and sensor, left bottom corner: detail of FSS1500NSB Low Profile Force Sensor.
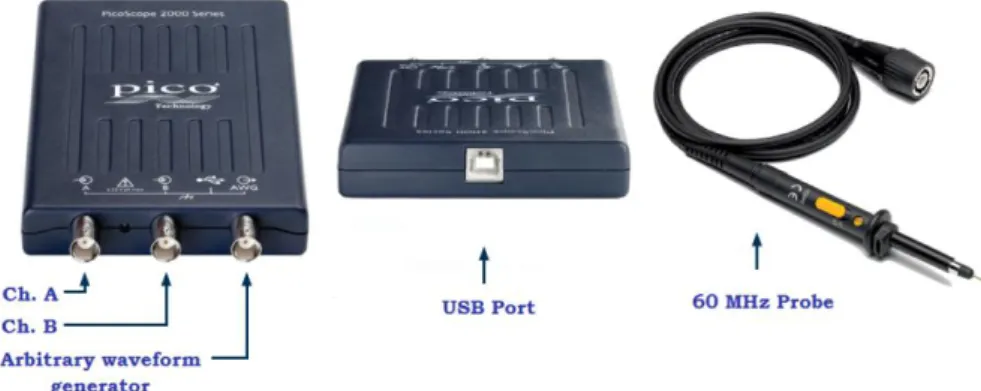
Figure 4. PicoScope 2204A.
Figure 5. Detailed set of equipment used for visualisation.
Figure 6. Scientific classification of columba livia and the adult nominate dimensions. Figure 7. Precision scale used to obtain bird weight.
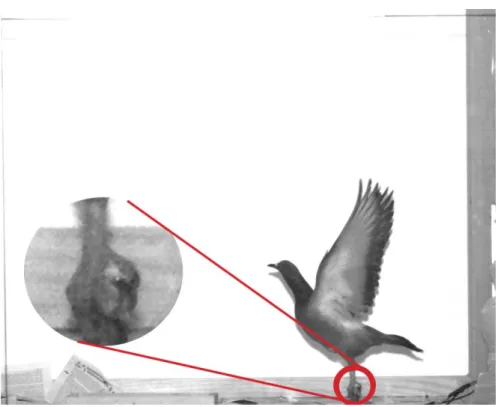
Figure 8. Resume of T-BIRD taking in account data temporal synchronization. Figure 9. Take-off moment (t = 0.000s).
Figure 10. Span deviation [mV] as function of force [N]. Figure 11. Relative error % as function of force [N].
Figure 12. Back UPS-400 Source (Emergency Battery Overvoltage Protection for Electronic and Computer Equipment).
Figure 13. Take-off angle of ascent on legs.
Figure 14. First take-off moments leg posture described angle.
Figure 15. Forward momentum created by the bird during take-off manoeuvre. Figure 16. Plot of horizontal forces as function of time.
Figure 17. Plot of vertical forces as function of time. Figure 18. Path line.
Figure 20. Clap and fling.
Figure 21. Plot of total forces as function of time. Figure 22. Animal during middle second downstroke.
List of Tables
List of Symbols
U horizontal velocity component
V vertical velocity component
W transverse velocity component
X horizontal coordinate
t time instant
Y vertical coordinate
Z transverse coordinate
Re
ratio between inertial and viscous forcesTOangle angle described at take-off
U∞ forward undisturbed flow
Greek symbols angle of trajectory ψ pitch ϕ roll θ yaw
𝛥𝑥
size of the vision field pixel in metersλ wavelength
Subscripts
Chapter 1
Introduction
1.1 Biomimetics
Humankind has looked at nature (living organisms) in search for answers to solve problems throughout their own existence. The term biomimetic derive from Ancient Greek and means (bios life; mimesis imitation); biomimetic life imitation, and has given rise to new technologies inspired by biological solutions at macro and nanoscales. In its fullness meaning, biomimetic refers to all human-made processes, substances, devices, or systems that imitate nature; i.e., refers to the imitation of the models, systems, and elements of nature with the purpose of solving complex human problems. Biomimetic studies belong to a highly multidisciplinary area, encapsulating several branches of science: chemistry, physics, computers, textile, mathematics and electronics. In Nature there are millions of species of which less than two million have been cataloged so far. Just to mention insects (they are among the most diverse groups of animals on the planet, including over a 1,000,000 described species and representing more than a half of all living organisms) According to National Museum of Natural History, most authorities agree on a conservative estimation of insect’s species number of 2,000,000 and could be extended to up 30,000,000 – an gigantic base inspired solutions data in biological systems to solve engineering problems and other fields of technology. One of the early examples of biomimetic was the study of birds to enable human flight. Although never successful in creating a “flying machine”, Leonardo da Vinci (1452– 1519) was a keen observer of the anatomy and flight of birds, and made numerous notes and sketches on his observations as well as sketches of “flying machines”1.The Wright Brothers, who succeeded in flying the first heavier-than-air aircraft in 1903, derived inspiration from observations of pigeons in flight2.
1 Romei, Francesca (2008). Leonardo Da Vinci. The Oliver Press. p. 56. https://en.wikipedia.org/wiki/International_Standard_Book_Number ISBN 978-1-934545-00-3.
2 Howard, Fred (1998). Wilbur and Orville: A Biography of the Wright Brothers. Dober Publications. p. 33. https://en.wikipedia.org/wiki/International_Standard_Book_Number ISBN 978-0-486-40297-0.
1.2 Flight Stages
Barata et al., 2015, performed a bibliographic review concerning Comparative Study of Wing’s Motion Patterns on Various Types of Insects on Resemblant Flight Stages, revealing that the behavioral flight capacitance, maneuverability and ability of insect’s flight in recent years has become an active research that provided biological adaptive inspirations for the design and control of man-made MAVs and NAVs, essentially by identifying, exploiting and understanding the basic principles of performance in-flight displayed, essentially due to a main reason: their maneuverability is remarkable and by far superior to every maneuverability of any man-made flying vehicle and has captured the humans attention in a way to achieve such knowledge. Although the authors have addressed this work to insect´s flight, there are parameters that are common to the study of the flight of birds.
The behavioral flight capacitance and ability of each animal (insect, bird, bat) is determined by the functional capabilities of their wing’s muscles to produce force and to work at a certain response speed and depends as well of their efficiency in transforming chemical to mechanical energy – wing’s muscles from different sources could vary widely in their performances. The power product of these muscles is subsequently transmitted to the wings, which unlike an aircraft wings are neither streamlined nor smooth: the shape, corrugation and performance of the wings and the complex flapping motion during the stroke cycles will determine the ability of an animal to fulfil successfully every stunning maneuver.
The aerodynamics between flapping and gliding flight differ substantially in two important ways: in a gliding wing, the air tends to remain attached and flowing smoothly over the surface of any airfoil; by contrast, the air over a flapping wing tends to become entrained in a swirling vortex bound to the upper surface of the wing - separated flow. And whereas the attached flow over a gliding wing look approximately similar from one moment to next, the separate flow over a flapping wing varies constantly - unsteady flow. Nowadays it is widely accepted that the insects make an extensive use of unsteady separated flow mechanisms in order to generate far greater aerodynamic forces that for them, would be impossible to achieve with steady, or quasi-steady, attached flow.
Birds change the angle of attack continuously within a flap as well as with speed. When a bird flaps its wings the lift force is rotated forward in order to provide thrust that counteracts drag and increases the bird speed and also increase lift to counteract its weight (allowing the bird to maintain height or to climb). Flapping involves two translational phases: the downstroke (providing the majority of the thrust), and the upstroke (depending on the bird's wings can or provide some to none thrust). During upstroke the wing is slightly folded inwards to reduce the energetic cost of flight. Flapping involves also two rotational phases: pronation
(associated with downstroke-forward movement), and supination (associated with upstroke-backward movement).
The ability of flight is a metabolically expensive way to move about, since gravity and drag has to be overcome. Mostly often the cross section a bird’s wing reminds a teardrop with a flatter lower surface than the top, like an airfoil. On its forward trajectory, this airfoil passes through an air stream forcing it to split in two separate streams: over the top and bottom of the wing. Air is forced to travel over the top curved surface and creates an area of lower pressure over the wing. Air under the wing is not deflected as much and creates a relatively higher pressure than over the top of the wing. By consequence, this pressure difference effectively pushes the wing upwards and generates lift. By altering the shape and angle of the wings and feathers independently (twist, rotation speed, morphing, flapping angle and elastic deformation of feathers during a wing beat) some birds are able and naturally supplied to perform extremely acrobatic manoeuvers at their will.
1.3 Motivation
Since every animal needs to generate enough force to enable sufficient airflow across the wings in order to generate sufficient lift to ascend, the take-off is one of the most energetically demanding aspects to resume the flight. An important aspect is also the demand of knowledge related to take-off, since most MAVs created are designed without fully autonomous take-off technology; instead, they are hand-launched; in fact, many rely on a controlled crude crash-landing, contrasting the elegance precision landing of a perching bird. Regarding the take-off, a recent research dimension has focused on development of bird like perching mechanisms; not only the ground mobility as well as the perching mechanism inspired from bird claws. Beyond the difficulties on developing MAVs, only few designs adequately address the required control issues and almost only quite few ones are able to complete a flight cycle (including take-off and precision smooth landing); regarding this, the main objective of this work concerns in the search of Quantitative Analysis of Take-off Forces in Birds, thus, for future fully autonomous MAVs take-off improvements.
1.4 Literature Review
Tanaka et al., 2011, conducted an experimental work concerning on the effect of wing flexibility in hoverflies using an at-scale polymer wing and an at-scale rigid wing carbon fiber model, both mimicking a natural wing of a hoverfly. The polymer artificial wing venation, corrugation and measured flexural stiffness are comparable to that of the natural wing. The experience consisted on the 5 levels of hinge stiffness variation: very soft; soft; intermediate; rigid; and very rigid. The artificial wings and hinges were tested with an at-scale tethered flapping mechanism driven by a piezoelectric actuator. It was tested single wings, independent of flow induced from the collateral wings, head, chest, abdomen or legs. The used wingbeat cadence and angles are identical to natural wings and were assayed appropriate trajectories for the flight of hoverflies. It was found that maximum lift was achieved when the stiffness of the hinge was similar to that of a hoverfly natural articulation in both wing cases and as well, as the magnitude of measured lift is sufficient for hovering; for identical wingbeat movements it was also found that the rigid wing proved to be most suitable for the production of greater lift. Their results also suggest the authors that hoverflies could exploit intrinsic compliances to generate desired motions of the wing [1]. Ang HaiSong et al., 2009, elaborated a numerical investigation including the studies of low Reynolds number (Re) aerodynamics, unsteady computational fluid dynamics and flight control for fixed-wing MAVs, bird-like MAVs, dragonfly-like MAVs and bee-like MAVs. The authors found that characteristics between natural flight (Re 100-30,000) and conventional aircraft flight (Re > 500,000) have a notable difference relating to the Reynolds number that easily led to flow separation on the MAV’s surfaces. Authors found that CFD methods of the steady flow and the unsteady flow with small amplitude were not suitable for the strongly unsteady characteristics of the flow field of flapping-wing and developed an effective solution method to perform simulations for unsteady flows with moving boundaries using N-S equations of compressible fluids, a method based on a dual time stepping scheme in conjunction with low Mach number preconditioning to solve the unsteady N-S equations. Characteristic boundary conditions were also developed to accommodate to the preconditioned characteristic system. Their test results indicated that the algorithm could provide satisfactory accuracy and convergence for a large range of unsteady flow problems. A dynamic unstructured overset grid method was developed for moving boundary problems with large relative movements. Their obtained results revealed that for fixed wing with low Aspect Ratio (AR) and low Re, the wing presents an involving 3D quite complex structure and that tip vortex not only affects the lift and drag, but also introduces unsteadiness in aerodynamic performance at high angles of attack. The CFD method for flapping wing demonstrated the unsteady vortex flow and the thrust generation mechanism of the flapping-wing flyers. By comparison of the aerodynamic forces of the flexible flapping-wing with those of rigid
flapping-wings, it was found that if the wing structure was controlled with suitable flexibility, and that the lift and thrust could be effectively raised. For the dragonfly tests, the results indicated that the wake of the flapping fore-wing exerts great influence on the aerodynamic performance of the hind-wing. For the bee tests, the results of flapping-wing with compound motion could produce higher lift and thrust; the motion parameters that have influence on lift and thrust of flapping-wing included plunging amplitude, plunging frequency, sliding amplitude, pitching mean angle and pitching amplitude. Their results for the bee-like MAV revealed also that the increase of pitching mean angle reduced the thrust [2].
Zhang & Yu, 2014, presented a numerical and experimental work proposing a new flapping wing type inspired by superior flight performance of natural flight masters like birds and insects and based on the ventilating flaps that can be opened and closed by the changing air pressure around the wing. For this, they created ventilated wings provided with a series of slots managed with the ability to be opened and closed either through active or passive control mechanisms during the flapping cycle. During the downstroke, the slots remain fully closed to represent the full wing area and thus, to generate maximum positive lift; as the upstroke begins, the slots open out and allow ventilation to occur within the wings by reducing the exposed wing area, drag, and hence negative lift generated in the process. These slots areas serve as a variable in which, a correlation with the decrease in negative lift can be generated. Related to materials, was used a corrugated Polypropylene Sheets; the wingbeats cycle varied from 30 degrees above to and 40 degrees below horizontal; the wings were reinforced with carbon rods at the leading edge, trailing edge and along chord. They tested wings with 0, 2 and 4 slots. The primary components of the experimental procedure were a brushless engine and a lithium battery, a gear mechanism for reducing the rotational speed, a crankshaft, a rack and a pinion to convert linear motion into rotational and a wing support; The authors stated their main challenge were to build such mechanism and to study their lift capacity. The numerical work was developed with the use of 2D and 3D CFD: ANSYS/FLUENT V.6.3.26 with a 120 X 56 X 60 mesh simulating velocity, U∞ = 1.4 m/s. By opening slots during upward wing movement the downforce reduction was considerable; all support results were positive, which immediately justify the use of this type of ventilation. The use of ventilation, allowed identifying a clear trend of increased lift capacity with increasing frequency. Vortex formed in the leading edge exhibit the same general trend, including the formation and stroke (shedding), but due to the presence of the slots, the flow pattern becomes more complex [3].
Ha et al., 2012, developed a work with the main objective of presenting a complete analysis of the artificial wings of an allomyrina dichotoma, investigating its static and dynamic characteristics and the relations between them, for posterior application to flapping wings on micro-airplane. The fabrication of the wings was based on the standards of the specie and the
complex structure was simplified with only the main veins system (carbon fiber – 0.1 mm thick) and wing membrane (Kapton film - 7.7 μm) [4].
Tanaka & Wood, 2010, presented a work about the fabrication of syrphidae artificial wings, micro molded in thermoset resin. The topology of the wing was generated by micro tomography x-ray (tainted with iodine) and posteriorly exported to a 3D CAD model; the patterns of the semi-circular veins sections were produced by four different size laser rays; 125, 100, 75, 50 μm; the wing has 11.7 mm of length and 100 μm undulation. The solid part of the veins and membrane was simultaneously formed and integrated by a simple molding process. The 3D mold was created by ablation of laser layers (laser Nd: YV04 – λ = 355 nm; 2W; pulsing radiation 15 ns a 20 KHz) with 6 μm height resolution, engraved on a silicon wafer [5].
Lehmann et al., 2005, using a digital particle image velocimetry (DPIV) and a dynamically scaled mechanical model of the small fruit fly drosophila melanogaster, studied the “clap-and-fling” movement (force enhancement due to contralateral wing interactions during stroke reversal). They modeled the clap and-fling using two computer-controlled, dynamically scaled Plexiglas wings (left and right wing) programmed to flap back and forth in prescribed kinematic patterns; their model was equipped with a force transducer for measure perpendicular and parallel forces. Using software routines in MATLAB (MathWorks, Inc., Natick, MA, USA), they managed to reconstruct the lift and drag force based on the results of the measured forces and based on the angular position of the wing throughout the stroke cycle; the model was flapped at (50 <Re <200) and had an aspect ratio of ~1.9, with the experience being made at an immersed onto a 2 m3 tank of mineral oil (wings length = 25 cm; oil density = 0.88x10³ kg·m–3; kinematic viscosity = 115 cSt). Their experimental work consisted on: varying the distance between the wings; the Reynolds number; the rotational time and angular velocity at the ventral and dorsal stroke reversal. To perform DPIV, they used a TSI dual mini-Nd:YAG laser to create two identically positioned light sheets through the wing at five equally spaced distances from the wing base and perform pairs of images of ~185x185·mm2 captured at 12 different phases of the stroke cycle. To visualize wake structure during clap-and-fling, the oil was seeded with bubbles by pumping room air through a ceramic water purification filter. Their results confirm previous research on the clap-and-fling mechanism and show that dorsal wing–wing interaction modestly enhances total normal flight force and lift production among insects flying at an intermediate Reynolds number. For wing kinematics modeled on tethered flying fruit fly, the magnitude and orientation of the mean force vector produced by wings during clap-and-fling generates a lift increase of 8.2% (mean lift: single wing = 0.222 N; two wings = 0.243 N). This enhancement occurs when the two wings are still in close proximity and the angular separation between them is less than about 10º, but vanishes at greater angular separations. They also found that besides a role for total lift enhancement, a concomitant 10% lift augmentation due to clap-and-fling
beneficially counterbalances pitch moments on the animal body produced by the increase in ventral stroke amplitude [6].
Lehmann & Pick, 2007, made an improvement of the previous study (Lehmann et al, 2005), using the same dynamically scaled mechanical model of the small drosophila melanogaster wing, in the “clap-and-fling” movement. Their experience was made in an immersed 2 m3 tank of mineral oil (wings length = 25 cm; oil density = 0.88x10³ kg·m–3; kinematic viscosity = 115 cSt). The authors do not made references to the used technics, so, it might be considered that they used the same DPIV, TSI dual mini-Nd:YAG and seeding systems. They used two computer-controlled dynamically scaled Plexiglas wings (left and right wing) programmed to flap back and forth in prescribed kinematic patterns. One wing was equipped with a 2-DoF force transducer that measured forces perpendicular and parallel to the wing in the spanwise direction. Using software routines in MATLAB (MathWorks, Inc., Natick, MA, USA), they managed to reconstruct the lift and drag force based on the results of the measured forces and based on the angular position of the wing throughout the stroke cycle; the model was flapped at (Re ~134) and had an aspect ratio of ~1.9. All the 17 bio-inspired kinematic patterns experiments were conducted using a horizontal stroke plane of 160º stroke amplitude, 0.17 Hz stroke frequency and 50º angle of attack with respect to the horizontal; the heaving motion was changed. Although none of the patterns used in this study exactly matched any of those found in flying insects, the various wing trajectories covered various categories of stroke shapes used by flying insects, such as oval or figure-eight shapes. They found that the clap-and-fling movement induced vertical force augmentation significantly decreased with increasing vertical force production averaged over the entire stroke cycle, whereas total force augmentation was independent from changes in force produced by a single wing. They obtained maximum (17.4%) and minimum (1.4%) vertical force augmentation in two types of figure-eight stroke kinematics whereby rate and direction of heaving motion during fling may explain 58% of the variance in vertical force augmentation. This finding suggested the authors that vertical wing motion distinctly alters the flow regime at the beginning of the downstroke. Their data revealed that pitching moments were largely independent from mean vertical force; however, clap-and-fling reinforces mean pitching moments by approximately 21%, compared to the moments produced by a single flapping wing. Pitching moments due to clap-and-fling significantly increased with increasing vertical force augmentation and produced nose-down moments in most of the tested patterns [7]. Miller & Peskin, 2009, presented 2D numerical simulations of flight constructed to be similar to the physical experiments of previous investigators. They solved the Navier–Stokes equations on a 1230×1230 Cartesian grid computational domain, and each wing was discretized on a Lagrangian array of 120 points (flexible and rigid models). They calculated the Lift and drag forces as functions of time by summing the forces that each immersed boundary point of the model wing applied to the fluid at each time step and taking the
opposite sign of that value; the angles of attack were defined using a set of equations describing the angular velocity during the rotational phase of the stroke. The Re was set to 10, corresponding to the case of some of the smallest flying insects, and the non-dimensional bending stiffness was varied from about 0.25 to 4. Related to some limitations of their model, the authors concluded from this work that the drag forces generated from wing–wing interactions could be an order of magnitude larger than a single wing, and that the addition of flexibility could reduce the drag but the maximum and average drag forces were still substantially larger than the single wing case. Related to clap and fling, the authors found that the drag forces generated during fling with rigid wings could be up to 10 times larger than what would be produced without the effects of wing–wing interaction. They concluded also that the horizontal components of the forces generated during the end of the upstroke and beginning of the downstroke cancel as a result of the motion of the two wings, and could not be used to generate thrust. As a result, clap and fling appears to be rather inefficient for the smallest flying insects. Authors also add flexibility to the wings and found that the maximum drag force generated during the fling could be reduced by about 50%. In some instances, the net lift forces generated were also improved relative to the rigid wing case [8]. Ramamurti & Sandberg, 2007, presented 3D Computer simulations of unsteady flow past a
drosophila under hovering and free flight conditions. The governing equations were the
incompressible Navier–Stokes equations in Arbitrary Lagrangian-Eulerian (ALE) and they managed the computations by using a time-accurate flow solver that was discretized in space using a Galerkin procedure with linear tetrahedral elements (a feflo incompressible flow solver). They studied both the hovering and the yaw axis directions for a maneuvering, by considering that the unsteady forces and moments were produced by both flapping wings and including the body of the drosophila as it hovers and then executes a saccade maneuver. All kinematics of the wings and the body of the drosophila were prescribed from experimental observations and were used in a XYZ experimental coordinates system consisted of the coordinates of the head, the tail, the wing hinges and tips and the unit vector normal to the wings. In order to convert this data to rigid body translation and rotation, first the drosophila body was placed in the computation coordinate system (xyz) with the head to tail aligned along the x-axis, the two wings placed flat on the (y-z) plane. The body was rotated along the x-axis through a roll angle ϕ, followed by a yaw rotation of θ about the y-axis, and the by a pitch rotation of ψ about the z-axis. This set of rotations was equivalent to the Euler angle systems commonly used in aeronautical engineering. After, the kinematics of the wings was converted to 6-DOF motion for the body and the wings. The results revealed that the differences in the kinematics between the right and the left wings show that subtle change in the stroke angle and deviation angle could result in the yaw moment for the turning maneuver. The origin of the yaw moment was investigated by computing the center of pressures on each wing and the individual moment arms and had led to the conclusion that it was the forward force and a component of the lift force that combined to produce the
turning moment while the side force alone produced the restoring torque during the maneuver [9].
Fontaine et al., 2009, In order to quantify flight kinematics during different types of maneuvers, developed a visual tracking system that estimates the posture of the fly from multiple calibrated cameras. An accurate geometric fly model was posteriorly designed using unit quaternions to capture complex body and wing rotations, automatically fitted to the images in each time frame. Their video subjects consisted of 3 day old female drosophila
melanogaster filmed at 6000 fps with a shutter speed of 50 μs. The video sequence was
filmed in a previous study that analyzed flight initiation using high-speed cameras (Photron Ultima APX) to capture orthogonal views at a resolution of 512 pixels by 512 pixels. With the video sequences the model-based image tracking was quantified; the body and wing kinematics of drosophila were recorded in multiple synchronized cameras, and first built a geometric model of the drosophila, assuming a rigid flying body. After, they used a polygonal model to construct a parameterized generative model of the drosophila that contains three primitive shapes: the body, head and wings. The primitive shapes were assembled into an articulated model that each wing joint was modeled as a spherical joint (permitting arbitrary rotations about all three coordinate axes); the shapes were constructed by applying continuous transformations to a B-spline curve. To parameterize the rotations of the
drosophila body and wings relative to a fixed global frame, they utilize unit quaternions
because their global representation does not suffer from the singularities inherent in Euler angle schemes: a 4×4 matrix defined the position of a body-fixed reference. To assess the accuracy of the proposed method, they compared body pose estimates in six video sequences with those reported by previous researchers. Their visual tracking system algorithm was written in MATLAB and had an average computation time of 45±3 s per frame on a 3.0 GHz Intel® Xeon processor and for each video sequence the geometric model was manually initialized to the first frame according to “Coordinate transformations”. The database of training samples consisted of 380 samples from a voluntary take-off and 111 samples from an escape take-off; the orientation measurements were smoothed with a zero phase lag fourth order Butterworth filter with a cut-off frequency of 1000 Hz and 250 Hz for the wings and body, respectively. This tracking system was able to measure stroke amplitude, geometric angle of attack and other parameters important to a mechanistic understanding of flapping flight. All sequences show that drosophila melanogaster do not utilize clap and fling during take-off and were able to modify their wing kinematics from one wingstroke to the next. Their approach should enable biomechanists and ethologists to process much larger datasets than possible at present and, therefore, accelerate insight into the mechanisms of free-flight maneuvers of flying insects [10].
Truong et al., 2012, investigated by visualization the aerodynamic characteristics of the beetles (mean body mass 5<gram<10); this insect has a pair of elytra wings (rigid
forewings→2.5 cm) and flexible hind wings→5 cm lengths. During the flapping motion, both elytra and hind wings flap on same frequency (37 - 40 Hz), however in different flapping angles: hind wing (160-180º) and for the elytra (34-38º). The beetles were kept on organic peat in the laboratory at a humidity of 50% and a temperature of 25ºC. They visualized free, tethered, hovering, forward and climbing flights experiments. The visualization of flow field around the beetle’s wing was performed in a low speed, open-type wind. A small hook with a diameter of 0.5 mm was attached to the thorax of the beetle with cyanoacrylate glue. The hook was used to hang the beetle at the center of the test section (1 x 1 m) in a wind tunnel. After a few minutes of suspension, the beetle started to freely fly away. A vertical hot wire was used to generate a smoke sheet while paraffin was flowing through it. The quality of the smoke sheet was adjusted for the best resolution in the image processing. To generate the dense stroke streamlines, an array of knots with diameter of 0.2 mm was made along a 0.1 mm tungsten wire. A high-speed camera (Photron APX) was located outsider the test section, and 1 kW halogen lamps were placed at appropriate positions to illuminate the focus region. The beetle’s wing motion was captured at 2000 fps at a pixel resolution of 1024×1024 and exposure time of 1/4000 s. The camera lens was connected to an image processor to a PC, while PHOTRON FASTCAM VIEWER software was used to capture images and control the high speed camera set-up. The incoming flow velocity was 1 ms−1 for free flight and 1.5 ms−1 for tethered flight. Leading edge, trailing edge and tip vortices on both wings were clearly observed by the authors. They observed that the leading edge vortex was stable and remained on the top surface of the elytron for a wide interval during the downstroke of free forward flight. They stated that the elytron wings may have a considerable role in lift force generation of the beetle. They found a suction phenomenon between the gaps of the hind wing and the elytron in upstroke that may improve the positive lift force on the hind wing. It was also found a reverse clap-fling mechanism while in hovering flight. The hind wings touch together at the beginning of the upstroke [11].
The aerodynamic theory of bird flight evolve continuously changing on motion of wing planform (a mixing of twist, rotation speed, morphing, flapping angle and elastic deformation of feathers during a wing beat) and differs abysmally from steady forward airplane´s flight; scientific evidences show that in a gliding wing the air tends to remain attached and flowing smoothly over the surface of any airfoil; by contrast, the air over a flapping wing tends to become entrained in a swirling vortex bound to the upper surface of the wing - separated flow. And whereas the attached flow over a gliding wing look approximately similar from one moment to next, the separate flow over a flapping wing varies constantly - unsteady flow. Nowadays it is widely accepted that animals (birds, insects and bats) make an extensive use of unsteady separated flow mechanisms in order to generate far greater aerodynamic forces that for them, would be impossible to achieve with steady, or quasi-steady, attached flow [12]; consequently, the state of art for calculation concerning instantaneous forces is still virtually impossible; however it is possible to consider two main approaches for modelling the
aerodynamics of such flight: by estimating the local force acting on a wing-strip (or blade element) and to integrate (or sum) the result over the wingspan, considering that the instantaneous forces on a wing in unsteady motion are equal to those in steady flow at the same local speed and angle of attack; or by taking advantage of the fact that flapping wings deform the fluid around them, and the aerodynamic force on the wing is associated with the impulse of the wake momentum change. Hence, from the topology and kinetic energy transferred in the vortex wake of the flying animal, lift and drag can be calculated although cannot offer instantaneous wing force resolution [13]. The mechanics of bird flight have been receiving an increasingly interest in the last decades. This interest was fostered by the need of MAVs – (Micro Air Vehicles) adequate and efficient to perform surveillance, communications relay links, ship decoys, and detection of biological, chemical, or nuclear materials. MAVs become even more challenging when DARPA launched in 1997 a pilot study into the design of portable (150 mm) flying vehicles to operate in D3 - dull, dirty and dangerous - environments [14]. More recently DARPA launched a Nano Air Vehicle (NAV) program with the objective of developing and demonstrating small (<100 mm) lightweight air vehicles (<10 g) with the potential to perform indoor and outdoor missions [15]. Figure 1 ranks NAV’s and MAV’s over a relation of mass and Reynolds number.
All requirements of low altitude, long flight duration at low speeds (up to 100 km/h), small wing spans and masses, together with demanding capabilities of take-off, climb, loiter, hover, maneuver, cruise, stealth and gust response are further beyond today’s fixed wing or rotorcraft vehicles. At the same time, MAVs fit in the general sizes, weights, and locomotion performance of natural flying animals [16].
Nevertheless, biomimetic engineered devices are still far from achieve similar performances of the living organisms, essentially due to a lack of a its total understanding and consequently more research is needed [17].
Although it can be found an extensive literature related to the understanding of aerodynamics on several flight stages on animals (insects, birds, bats) and some research related to the understanding of its flight control, there is a lack of research concerning to the initial flight stage on birds: the take-off procedure.
For a natural flyer, flight is never only to float and to move in the air. In addition to an instinctive and outstanding flight capability, a natural flyer excels in adopting appropriate pilot strategies to perfect the flight performance. One prominent flight strategy of a bird is to interact with the surrounding conditions, such as the environmental airflow and land forms. Kestrels and albatrosses are reported to be capable of exploiting a large-scale airflow to accomplish various skilled flight modes, for instance, flying against the wind at the velocity of the wind for wind hovering, and gaining energy by repeatedly crossing the boundary between air masses of significant velocity difference for dynamic soaring [18].
Passing to the take-off mechanisms, we know that the forces that most contribute during the take-off phase are generated by the bird’s legs as studied with performed tests on a geopelia cuneate. Recent research has revealed that initial take-off velocity in birds is driven mostly by hindlimb forces. However, the contribution of the wings during the transition to air is unknown. Integrated measurements of both leg and wing forces during take-off and the first three wingbeats in zebra finch (taeniopygia guttata, body mass 15g) and diamond dove (geopelia cuneata, body mass 50g) were completed. Measured ground reaction forces produced by the hindlimbs using a perch mounted on a force plate, whole-body and wing kinematics using high-speed video, and aerodynamic forces using particle image velocimetry (PIV). Take-off performance was generally similar between species. When birds were perched, an acceleration peak produced by the legs contributed to 85±1% of the whole-body resultant acceleration in finch and 77±6% in dove. At lift-off, coincident with the start of the first downstroke, the percentage of hindlimb contribution to initial flight velocity was 93.6±0.6% in finch and 95.2±0.4% in dove. In finch, the first wingbeat produced 57.9±3.4% of the lift created during subsequent wingbeats compared with 62.5±2.2% in dove [19].
Consistent with Tobalske, et. al., 2004, hummingbirds, with small body size and proportionally small hind limbs, fly differently compared with other birds. One important consequence of their unique method of take-off is that their initial flight velocity is comparatively slow. Due to their insect-like wingbeat style, thought to produce lift during upstroke and downstroke, hummingbirds appear particularly well suited for hovering flight. Their flight style results in a higher energetic cost of submaximal fast flight compared with hovering and slow flight. This may be unique among birds and may ultimately account for
their use of slow take-off velocity during autonomous take-off. Factors that may represent increased motivation to take-off quickly, for escape or aggression, results in increased velocity relative to autonomous take-off. However, take-off velocity in motivated hummingbirds is still less than mean take-off velocity in other species [20].
Wing and body movements of pigeons (columba livia) during short distance free-flights between two perches was observed and found that the greatest accelerations were observed during the second wingbeat of take-off [21].
Regarding to aerodynamic phenomena is known that the hummingbirds modulate the orientation and trajectory of their mechanical oscillator to accomplish a change in velocity [22].
The separating flow on the low pressure side of the wing reduces of aerodynamic performance. And giving as example in nature, the owl that is able to reduce and control the separation of flow on its wings. One of the special adaptations of the owl wing, that is, the velvet-like surface structure on the upper chamber, is assumed to strongly influence the flow field around the wing [23].
The calypte hummingbird uses its tail as a mean of deflecting the aerodynamic flux as mean to achieve stability during the hoovering flight [24].
Wing beat frequency much depends on birds mass, having the lowest value for bigger mass birds and the opposite for light birds [25].
Resuming works on biomimetics by Barata, et al. [26, 27, 28, 29, 30], much has been contributed.
It is known that the behavioral flight capacitance and ability of insects in flight in recent years, has been an active research that provided inspiration on their maneuverability and agile flight, for the design and control of man-made MAVs and NAVs, essentially by identifying and exploiting the basic principles of performance in-flight displayed by the insects. The current investigation focus is on the achieving of a greater perception of flight performances held by several types of insects on displaying their abilities on flight maneuvers on resemblant flight stages; thus regarding to a bio inspired flapping wings robustness for MAVs and/or NAVs applications.
On a more general perspective investigation has been performed focused on the mechanisms involved with natural locomotion (thrust and/or lift), known that biological systems with interesting applications to Micro Air-Vehicles (MAVs) are generally inspired on flying insects or birds; however, similarly to the aerodynamics of flight, powered swimming requires animals
to overcome drag by producing thrust. Commonalities between natural flying and swimming have an important role on flow control issues. Several researchers recognize that the perception of flight performances held by insects is not completely understood. All control surfaces present on flying animals (feet or wings) are not designed by nature as of rigid materials; instead, they are elastic materials. Insect’s wings are morphological wonder (elastic material: every wing motion is a sum of horizontal, vertical and torsional movement), however, what really enables the wings to make enough force for the animal to stay in the air, is the way insects flap them: at a very high angle of attack, creating a structure at the leading edge of the wing, (tornado-like structure) called leading-edge vortex. Researchers investigated dimensionless numbers to study the flight, and their findings were disappointing since it became clear that different points of view exist in the biomechanics field on how to best define and use. So, successful biology-inspired or biomimetic concepts will depend on the understanding of the natural mechanisms especially when they do not agree with the present engineering design principles. An additional difficulty (and a very important one) is the fact that state of art on elastic materials with identical or similar elastic properties of natural insect’s wing, does not exist yet.
The natural flight ability of animals has been an active research in recent years that provided inspiration on their maneuverability and agile flight, for the design and control of MAVs and NAVs. Nevertheless, biomimetic engineered devices are still far from the living organisms and more research is needed. There is a general agreement that an unsteady dynamics approach is required to capture the physical phenomena at this scale. Additionally, propulsion and lift should not be considered independently. Flapping wing systems appeared in animals such as insects, birds, and fishes, which are known to exhibit remarkable aerodynamic and propulsive efficiencies. Flapping wings induce angular, centripetal and Coriolis accelerations in the air near to the wing’s surface, which diffuse into the boundary layer of the wing. Some results suggest that the flying animals could control the predictability of vortex-wake interactions, and the corresponding propulsive forces with their wings.
So, the main studies published so far have been dedicated to the aerodynamic effects during flight stages, wing structures. Nevertheless, the studies about the take-off stage are much more scarcer for both insects and birds. In the present study the take-off and initial stages of flight were studied using a columba livia specimen. For the accomplishment of this study, in order to interpret the forces involved on the moment of the take-off of a bird, it was recurred to an experiment involving a fast data acquisition force sensor and high speed camera. The remainder of this thesis is structured in 3 chapters. In the next chapter the experimental method is described in detail, and then the results are presented in Chapter 3. Then the main conclusions and findings of the present work are reported in the following chapter. The Appendixes include the software developed by the author as well as the main publications resulting from the present investigation.
15
Chapter 2
Experimental Method
2.1 Experimental setup
This chapter describes the experimental setup used in this work from which Figure 2 illustrate a general overview at a glance. The experimental set-up is described in detail, such as all used devices and components and how are they connected; it is also explained a used code and a specific code generated specially for this work as well as the visualization technique, the calibration of some components and the error estimation.
(
The force produced by the bird during take-off is registered both by a FSS1500NSB Low Profile Force Sensor and a Photron FASTCAM Mini UX50. The perches are located at the middle section of the cage in order to allow a better focus of the images. A relation between real dimensions (rulers which measure the field of view dimensions with precision to 1 [mm]) and
the Photron FASTCAM Mini UX50 pixels (1280 x 1024 square proportion (1:1) pixels), resulting in the following relation:
∆𝑥 =
86.5 𝐸−21280𝑚
(1)
Where 86.5E-2 m is the width of the horizontal axis of the field of view and 1280 the total number of pixels per line of the camera retina. So, equation (1) represents the dimension in meters of the field of view of each square pixel.The measurements were made at an atmospheric pressure of 987.0 [kPa] and ambient temperatures from 17.8ºC up to 19.5ºC during March of 2016.
2.2 Measuring equipment
The experimental setup includes a bird cage with 1100 mm of height, 1300 mm of length and 1000 mm of depth. Inside the cage is a columba livia used as the subject of study for the take-off and flight tests. The distance between both perches is 962 mm. As illustrated in Figure 2, attached to the cage floor is a perch mounted on a base that supports the FSS1500NSB Low Profile Force sensor; this sensor records the vertical mechanical forces into analog signals (caused by the bird's legs). The sensor is connected by wires to a PicoScope 2204A that receives and reproduces the analog signals into digital signals in the form of plots. The PicoScope is connected to a computer that collects all information related to mechanical forces.
Another set of components is used in visualization technique: a FASTCAM Photron Mini-UX 50 using a TOKINA lens 100mm F 2.8 MACRO AT-X M100 PRO D, with its respective dedicated lens hood and a Manfrotto 190 tripod; this set is connected to another computer that collects all the video recorded information. In order to favor the analysis of frames (for both the code program and user), the image is saturated to a gain of 6.2 and illumination is compensated with the aid of a spotlight KAISER Videolight 6 1000 Watt. The cage has another perch in a higher position; all take-off and flight tests are carried out form the lowest to the highest perch. The video record footage is obtained at distance of ~ 7 meters in a parallel plane to trajectory performed by the bird.
2.2.1 FSS1500NSB Low Profile Force
After an extensive research for possible means of direct force measurements, it was concluded that a piezoresistive sensor would be the most adequate in order to measure force generated by the bird (columba livia). The measurements could be performed fast enough while maintaining equilibrium relative to the measurements precision.
The FSS1500NSB Low Profile Force Sensor was found to be adequate. It is capable of linear response in a range from 0 to 15 [N] forces and has a useful safe feature of overforce with a value of 45 [N], but most importantly its capability of very fast response with typical values of 0.1 [ms] while on a range of 10% to 90% of the full span signal.
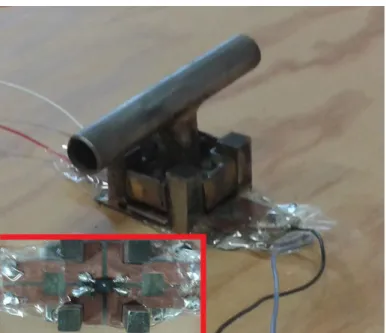
In spite of these good characteristics it could not be used directly due to its reduced dimensions. So, a fixation device or platform was designed in order to accommodate this sensor which comprises an impressed circuit, a base structure, a jumping platform for the bird and the FSS1500NSB Low Profile Force Sensor (fig. 3).
The structure or base was made of steel pieces welded with brass alloy, as was the jumping platform structure, the impress circuit was drawn with acid resistant and water resistant material so it would be ready to be submerged on 60% concentration nitric acid and relatively quickly removed from the acid meaning the impress circuits were well defined. Those 4 elements were assembled with the sensor glued with hot thermal glue to the impress circuit in a way that it would be positioned to connect each 4 terminals independently to a circuit on the IC, then each terminal was soldered with typical circuit solder (a mixture of tin and lead), after that was possible to perform 4 holes each on a terminal of the IC in order to be possible
Table 1. FSS1500NSB Low Profile Force Sensor characteristics.
Figure 3. On top: detailed group of the perch the attachment base for both perch and sensor, left bottom corner: detail of FSS1500NSB Low Profile Force Sensor.
to solder connecting wires on the IC, that wires would be able to facilitate the inter-connections. After that IC containing the sensor must be attached to the base structure by means of hot thermal glue. Then that base structure glued with hot thermal glue to cage floor providing a good fixation while the bird would perform the jump to the air from the jumping platform structure placed on top of the force sensor.
The force felt by the sensor is given by the following empirical relation:
𝐹
𝑡𝑜𝑡𝑎𝑙=
𝑠𝑝𝑎𝑛−81.22911.645(2)
Where 𝐹𝑡𝑜𝑡𝑎𝑙 is the total force impressed on the force sensor mechanism in Newton [N] as function of span that is the electric tension in millivolt [mV] measured by the PicoScope
2204A described in the next section.
2.2.2 PicoScope 2204A (USB Oscilloscope)
This device is a PicoScope® 6 with a PC Oscilloscope software version 6.11.12.1692, which is the responsible part for the data acquisition from the FSS1500NSB Low Profile Force Sensor. It converts the electric potential difference into usable data taking advantage of its very fast acquisition capability, making possible to generate a very detailed plot of the potential difference as a function of time, posteriorly being traduced to a plot of F (force generated by the Columba Livia legs and its weight) as a function of time as mentioned before relating to equation (2).
2.2.3 Photron Fastcam Mini-UX50
This device uses the Photron FASTCAM Viewer version 3610 (x64) and serves 2 main purposes. With it is possible to confirm and record the correct jump of the bird, defining a correct jump as a jump that the bird can take its claws of the perch at near the same time and without touching the ground at the moments of the entire record time post leaving contact with the perch, that conditions validate a correct jump. The other purpose is the most obvious for such kind of equipment, that is the recording of the moments of jump and flight that will allow a detailed visualization and post processment of images that will serve to calculate the force components, explained in detail on section 2.4.
The camera was set to operate at 250 [fps] (images per second), shutter speed of 1/2000 [s] (exposition time), trigger mode end (recording until pressed the trigger), resolution 1280 x 1024 pixels, 1000 [W] light source (to saturate the image irrelevant details such as wood knots) and a high gain of the camera signal.
2.3 Measurements and dimensions of the bird
The columba livia was first described by Gmelin in 17893. Columba livia (also known as rock dove or rock pigeon) is a member of the Columbidae bird family (doves and pigeons) often simply referred to as the “pigeon”. Wild Columba livia are native to Europe, North Africa, and southwestern Asia; a large range with an estimated global extent of occurrence of 10,000,000 km2. According to specialists, the rock pigeon's lifespan is anywhere from 3–5 years in the wild to 15 years in captivity, though longer-lived specimens have been reported4. Having in consideration the rank of main dimensions for an adult nominate Columba livia, their length, wingspan and weight will fall in ranges between 29 to 37cm; 62 to 72cm and 238 to 380g (fig. 6), respectively; for this work was used a specimen with such values of 27.2cm; 57.4cm; 298.89g (fig. 7).
3 In J.F. Gmelin's https://en.wikipedia.org/wiki/Systema_Naturae appeared in Leipzig, 1788-93.
4 BBC Science & Nature. http://www.bbc.co.uk/nature/wildfacts/factfiles/3030.shtml Retrieved 2008-02-19.
2.4 Data acquisition system and data processing
Just like illustrated (Figure 2) all data acquisition for this work was transferred from a Photron FASTCAM Mini UX50 and from a PicoScope 2204A with the help of two different PC’s separately from each other: i.e, the first one collected all video recorded information and the second one collected all buffered data from PicoScope. As it was desired the crossing of all collected information it would be an imperative requirement for temporal synchronization, as a unique path for extrapolating of valid results concerning on the study of the contribution of muscular forces – before, during and after take-off; the contribution of these same forces to perform the take-off; the contribution of aerodynamic forces on the take-off; the total time of take-off manoeuvre, and as well as take-off angle measurements, required to obtain perch sensor force components. The temporal synchronization was achieved with the help of Matlab code entitled DLTdv5.m generated by Tyson Hedrick; such code served as a basis for obtainment of a consecutively positioning of the animal over time and was focusing on a reference point chosen accordingly to the ease of tracking on animal’s body – and as all video recordings took place in a parallel plane related to the animal flight, the eye of the bird served as a graphical reference for easy recognition and consequent easy tracking. In fact, this way the DLTdv5.m code generated an output data file of coordinate points (pixels) corresponding to the alongside animal locomotion. This output data file was found to be insufficient for the present study, and a new code called T-BIRD was developed (Appendix A). Both codes were supposed to run exclusively on MATLAB®. The T-BIRD routines start to input the data obtained from DLTdv5.m, and performs a pixel to meter (m) conversion by multiplying ∆x (eq. 1) on all values of positioning (with an estimated error below 5%). In order to calculate the aerodynamic forces for posterior plotting the results on this work, the Figure 7. Precision scale used to obtain bird weight.
required derivatives were initially computed using first order equations (upward differences); since the results of such equations revealed unsatisfactory error values, the following step was the computation with 2nd order equations (central differences equations), that revealed a significantly error cutback; so, it was then decided to apply the discretization of central difference equations. Since velocity, V(t) is the derivative of position and acceleration, a(t), is the derivative of velocity, the second order discretized derivation (central differences) can be written as (eq. 3):
𝑽 = 𝑑𝑷 𝑑𝑡
⁄
=
(𝑷𝑡+1+𝑷𝑡−1−4∗𝑷𝑡) ∆𝑡+ 𝑂 (ℎ
2) (3)
Where: ∆𝑡 = 𝑐𝑜𝑛𝑠𝑡𝑎𝑛𝑡; V = velocity component [m/s]; P = bird eye position [m];𝛥t= constant time step obtained by inverting the camera acquisition speed [s]; O(h2) = higher order terms that correspond to the 2nd order error.
(eq. 4) follows the derivation of V(t):
𝒂 = 𝑑𝑽 𝑑𝑡
⁄
=
(𝑽𝑡+1+𝑽𝑡−1−4∗𝑽𝑡)∆𝑡
+ 𝑂 (ℎ
2)
(4)
Where 𝒂 represents the acceleration component (ax, ay) [m/s2].Next is performed another calculus given by the next formula obtaining the force component (Fx, Fy) relative to the camera data (aerodynamic forces).
𝑭 = 𝑚 ∗ 𝒂 (5)
[31]
Where:F = force components vector[N];
m = bird mass [kg].
Another important T-BIRD routine enables the user to evaluate by visualization, the specific frame number (N) on which the bird loses contact with the ground; once this is achieved, the user inputs the specific frame number (N) again on the code. The code than generate a position vector defined between frame numbers (N+1) – (N); this vector provides a direction that will enables the code to calculate the bi-dimensional angle of take-off, (TOangle = arctg ((yN+1 – yN) / (xN+1 – xN)). This routine was mainly designed with the objective to allow the user
not only to obtain the take-off angle, as well as to compute the other component (horizontal) and the main vector of the mechanical forces on the sensor, resumed by (eq. 6 and 7):
𝑭
𝑡𝑜𝑡𝑎𝑙 𝑥= 𝐹
𝑡𝑜𝑡𝑎𝑙∗ 𝑐𝑜𝑠 (𝑇𝑂
𝑎𝑛𝑔𝑙𝑒)
(6)
𝑭
𝑡𝑜𝑡𝑎𝑙 𝑦= 𝐹
𝑡𝑜𝑡𝑎𝑙∗ 𝑠𝑒𝑛 (𝑇𝑂
𝑎𝑛𝑔𝑙𝑒)
(7)
Where:Ftotal is given by (eq. 2);
By simplification the take-off angle was considered constant during the jump time.
The major contribution of code T-BIRD to this work is a routine especially designed to import the force sensor data and the FASTCAM data (input - offset in time) and processes all input information in order to make them match the temporal synchronization, as shown in Figure 8.
Explaining in detail, the algorithm processes the temporally pre-synchronized value, 𝑡𝐹𝐴𝑆𝑇𝐶𝐴𝑀𝑛𝑒𝑤 ; this value remains unchanged and is processed to output as the reference time (t=0.000s) (fig. 9) and it is used by the code to adjust the 𝑡𝑠𝑒𝑛𝑠𝑜𝑟𝑜𝑙𝑑 old variable in a new one 𝑡𝑠𝑒𝑛𝑠𝑜𝑟𝑛𝑒𝑤 temporally synchronized with 𝑡𝐹𝐴𝑆𝑇𝐶𝐴𝑀𝑛𝑒𝑤 . Taking into account the last and the before last force value recorded on the sensor, it turns workable to perform a linearization in order to obtain the exact moment by which the force value on the sensor is F = 0 [N] – i. e., the exact moment the bird loses contact with the ground (sensor). Force plots (graphics) show a negative value that the authors of this work attribute to the noise signal value. The temporal synchronizing point has become as the time reference (t = 0.000s).
Case 1: t < 0.000s - the bird is on the ground yet (sensor); Case 2: t > 0.000s - bird has lost contact with the ground; Case 3: t = 0.000s - transition point of the two previous cases. Figure 8. Resume of T-BIRD taking in account data temporal synchronization.
In this kind of sensor, the manufacturer manual does not mention mechanical or electronic damping. Although it might be possible to create an algorithm to perform damping or damping compensation, it was considered not advisable to change the input data, for several reasons: the sensor is not fitted with damping systems by the manufacturer; thus, it was also taken into account not to tamper (restrict or prevent its oscillations) and allow the greatest amount of data input. Although the force sensor consistently generates the same output for the same force, the applied sensor is excessively small and has little inertia; therefore, any linear vibration will act strongly, causing noise increase. In addition to the take-off, the raw data graph plots the forces measured (against the ground) by the sensor and read by the PicoScope for other moments prior to the bird intention to initialize the take-off maneuver; these moments before take-off, left recorded total force values in the sensor:
Case 1: Ftotal < Wbird - Bird does not intend to start the take-off maneuver; Case 2: Ftotal ≥ Wbird - Bird started the take-off maneuver (impulse).
Resuming the take-off time can be presented as the time period within first moment of no contact on the sensor (ground) F = 0 [N] and the moment of Ftotal ≥ Wbird.
2.5 Calibration process and error estimation
The calibration process was achieved by making several measurements with different weights, until the possibility of estimating the maximum error produced by the FSS1500NSB Low Profile Force Sensor. After these tests was made a validation of the maximum error, achieving an error inferior to 5% and so turning to be proper for the direct force measurements at fast speed acquisition.
27
2.6 Power source reliability
During the force sensor calibration, it was decided to implement the use of a Back UPS-400 Source (Emergency Battery Overvoltage Protection for Electronic and Computer Equipment) in order to guarantee the stability of DC voltage; however the noise values obtained with the inclusion of this equipment remained similar to those previously obtained, so it was decided to abandon the use of Back-UPC 400 source, since there was no explicit benefit on the results.
Figure 11. Relative error % as function of force [N].
Figure 12. Back UPS-400 Source (Emergency Battery Overvoltage Protection for Electronic and Computer Equipment).


![Figure 10. Span deviation [mV] as function of force [N].](https://thumb-eu.123doks.com/thumbv2/123dok_br/18903475.935571/46.892.169.681.351.687/figure-span-deviation-mv-function-force-n.webp)
![Figure 11. Relative error % as function of force [N].](https://thumb-eu.123doks.com/thumbv2/123dok_br/18903475.935571/47.892.205.737.130.488/figure-relative-error-function-force-n.webp)
