Doi: https://doi.org/10.25186/cs.v15i.1659
Comparison of sensory attributes and chemical markers of
the infrared spectrum between defective and non-defective
Colombian coffee samples
Yeison Fernando Barrios Rodriguez1 , Karen Tatiana Salas Calderon1 , Joel Girón Hernández1
1Universidad Surcolombiana/USCO, Facultad de Ingeniería agrícola, Centro Surcolombiano de Investigación en Café/CESURCAFÉ, Avenida Pastrana Borrero, Colombia Contact authors: yfbr06@gmail.com, joel.giron@usco.edu.co, tatianasalasc@gmail.com
Received in November 3, 2019 and approved in March 10, 2020
ABSTRACT
Defects in coffee affect the sensory quality of finished drink. To avoid this, defective beans are usually removed after threshing, as, once the green beans have been roasted, it becomes difficult to identify the defects. Procedures have been developed to evaluate coffee samples using infrared spectroscopy to detect such defects. As such, this study evaluated infrared spectra and sensory attributes of 39 coffee samples in: commercial ground and instant coffees, medium and high roast quality coffees, and defects present in the coffee. The sensory analysis was performed by 10 judges, semi-trained by a Q-grader, and eleven attributes were assessed using a semi-structured hedonic scale. The spectra obtained from the coffee samples were processed by mean centering, normalization (probabilistic quotient normalization), area normalization, first derivative and second derivative, later followed by principal component analyses. The sensory results showed differences in the evaluated attributes, differentiating between the samples of high quality medium roasted coffee from the other samples. After processing IR spectra of the samples by area normalization, PCA results exhibited four different groups: a) medium, high roasted quality coffee, with broken and chipped defects; b) commercial ground coffee and defects of sour, insect damaged, and faded; c) black defects, and d) instant coffee. Using the chemical descriptors obtained from the infrared spectra, it was possible to separate between high quality, commercial and instant coffee.
Key words: Coffee bean defects; FTIR-ATR; principal component analysis; quality coffee.
1 INTRODUCTION
Quality coffee is the result of good agricultural practices and proper post-harvest handling. Its intrinsic characteristics meet a requirement that may be a necessity or an expectation (ISO, 2000). However, in roasted and ground coffee, the addition of defective beans is a common practice, which negatively affects the sensory characteristics of the beverage (Reis; Franca; Oliveira, 2013a; 2013b). Defective beans become evident after the threshing stage, and these must be selected and eliminated by physical analysis to avoid imbalances in the coffee’s organoleptic characteristics (Puerta- Quintero, 2001). The green coffee beans are then roasted, after which it becomes difficult to identify the defects (Diaz et al., 2018). Sensory evaluation is used to assess coffee quality, which is a subjective method, as it requires expert tasters and the procedures imply a considerable investment of time (Craig et al., 2018).
Some authors have proposed the use of analytical methodologies to identify defects present in roasted coffee, based on infrared spectroscopy (Craig et al., 2018; Piccino et al., 2014; Zanin et al., 2016). Fourier Transform Infrared Spectroscopy (FTIR) is an attractive technique due to easy sample preparation and quick determinations. (Rodriguez; Allendorf, 2012). Infrared spectroscopy records changes in the absorption and radiation emitted by molecular vibration with a given energy level; each functional group provides a characteristic absorption, regardless of its relationship to the
rest of the molecule (Rodriguez; Allendorf, 2012). Spectral analyses have been presented as a reliable tool for the objective evaluation of coffee quality attributes, allowing information on the chemical composition to be obtained quickly (Barbin et al., 2014). It has been demonstrated in studies on the characterization and discrimination of defective and non-defective green coffee (Craig; Franca; Oliveira, 2012b), roasted and ground coffee (Craig; Franca; Oliveira, 2012a). Given the need to establish a rapid assessment of the presence of defects and their influence on sensory quality, the purpose of this paper was to: i) evaluate and compare the sensory attributes and chemical markers of the infrared spectrum between defective and non-defective Colombian coffee samples, and ii) establish a classification of coffee samples by applying the principal component analysis (PCA) method to the data obtained from infrared spectroscopy.
2 MATERIAL AND METHODS 2.1 Sample selection and preparation
Fourteen coffee samples were used: four commercial instant coffee samples, four commercial ground coffee samples, and three high and medium roast quality coffee samples evaluated under the protocol established by the American Association of Specialty Coffees (SCA). Additionally, we worked with five types of defects according
to SCA classification (American Association of Specialty Coffees - SCA, 2018): total or partially black, insect damage, faded, broken/chipped, and sour or partially sour. These defects were selected due to their impact on the sensory characteristics of coffee. Samples of commercial ground and instant coffees were purchased from chain stores, coffee samples were obtained from local producers in the Huila region and coffee defects were sorted and supplied by a local coffee cooperative. The green and defective beans were passed through a No. 13 sieve of 5 mm diameter to eliminate smaller beans and each type of defect was prepared independently without mixing.
Green coffee samples and defects were roasted in a TC 150R rotary drum roaster (Quantik, Bogotá, Colombia), ground in a Bunn mill (G3 HD BLK, Springfield, USA), and sieved to a particle size of between 150 and 250 μm. Luminosity (L*) range recommended by Wei and Tanokura (2014) were then applied to establish the samples’ roasting level. Color measurements were made using a CR-410 colorimeter (Konica Minolta Sensing Inc., Japan) with D65 illuminant, and 10° standard observer.
2.2 Analytical determinations
For all analyses, 9 types of samples were considered: commercial ground coffee, commercial instant coffee, high roasted quality coffee, medium roasted quality coffee, total or partially black, insect damaged, faded, chipped/broken, sour or partially sour. Prior to sensory analysis, pH, water content and soluble solids values were obtained for each sample. The pH was determined following the methodology established by Mazzafera (1999). The water content was determined by a moisture analyzer MB45, (OHAUS-MB45, Parsippany, EE. UU). The soluble solids content was determined using a PR-201α digital refractometer (ATAGO, USA).
2.3 Sensory analysis
A sensory analysis was carried out for each one of the samples previously defined; in the case of the treatments obtained from the samples of commercial ground coffee, quality coffee, and defects, the AeroPress preparation method was implemented, with a ratio of 7 grams of ground coffee per 100 milliliters of water filtered with activated carbon at a temperature of 90 °C as recommended by Sanchez and Chambers (2015). For the instant coffee samples, the methodology described by Oliveira et al. (2009) was implemented, with ratio of 2 grams of sample per 150 milliliters of water filtered with activated carbon at 90 °C.
The sensory analysis was performed by a panel of 10 semi-trained judges; constituted from persons normally familiar with quality of coffee, capable of discriminating differences and communicating their reactions. The panel analyzed 19 coffee extracts in two sessions. The panelists were previously trained by a Q-grader certified professional and in general descriptive
analysis of testing and perception of sweet, sour, salty, bitter, and umami. For this study, the judges received further orientation to coffee using samples that may not be included in the analysis.
For the cup tasting, each participant was given 50 ml of the extract to evaluate the attributes of: aroma, color, sweetness, flavor, aftertaste, body, acidity, flavor to coffee, bitterness and overall score on a hedonic scale from zero to nine, with zero indicating the lowest acceptance value, and nine the highest (Silva et al, 2013). The assessment panel also provided sensory descriptors for each of the samples based on the sensory lexicon dictionary of World Coffee Research (WCR; SCA, 2017).
2.4 Infrared spectroscopy
IR spectra readings were taken using approximately 1 g of roasted ground coffee (< 0.5 mm), with working conditions of 56% relative humidity and 24.83 °C in an FTIR Cary 630 spectrophotometer, with a DLATGS detector and an ATR sampling accessory (Agilent, Santaclara California, USA). All spectra were recorded within the 4000-650 cm-1 range with
a resolution of 8 cm-1 and 20 scans. The approximate total
times required for sample preparation were 3 minutes, the final spectrum was obtained from the average of five sample readings. Three samples were used for each defect and four samples of instant coffee and ground coffee.
2.5 Statistical analysis
The results of the analytical determinations and sensory analysis were evaluated using simple ANOVA. Tukey’s test was used to find mean differences between the samples, with a significance level of 95%.
The infrared spectra were processed using Resolutions Pro-software (Agilent, USA) in order to compensate for changes in experimental conditions, remove redundant information and enhance sample-to-sample differences, mean centering, normalization (probabilistic quotient normalization), area normalization, first derivative and second derivative of area were applied to the spectra. Subsequently, a principal component analysis (PCA) was performed to obtain sample clusters from chemical markers in infrared spectroscopy. Data (treated and untreated) were scaled by dividing by the standard deviation of each of the variables and centered by subtracting the mean, in order to decrease variability. The areas used for the analysis were those included in the 3000-2800 cm-1 and 2000-900 cm-1
regions. The statistical procedures were performed using the R Core Team (2019) program GPU General Public License.
3 RESULTS AND DISCUSSION
Table 1 presents the mean values and the standard deviation for the parameters evaluated for each of the samples. The luminosity (L*) for the treatments of high roast quality
coffee, commercial ground coffee, black, insect damaged, faded, broken/chipped and sour showed no differences (p>0.05). With average values lower than 21.5 (L<21.5), these samples were classified as high roast. According to the roasting table described by Wei and Tanokura (2014), medium roasted quality coffees were classified as medium roasting and instant coffee samples as cinnamon roasted.
Regarding humidity content all samples in the study exhibited values below 5%, results are consistent with those reported by Hernández et al. (2007). Samples IC and CGC presented higher values as a consequence of the storage process before the experiment. The pH parameter evidenced differences (p<0.05): the lowest values were found in the medium roasted quality coffee sam p les, which presented the lowest roasted
level. These results coincide with those reported by Bahamón, Guzmán and Parrado (2018), Valencia, Pinzón and Gutiérrez (2015) and Fujioka and Shibamoto (2008), who associated the presence of chlorogenic acids and organic acids such as citric and malic acids with the pH. These types of compounds are degraded during the roasting process, generating a decrease in the pH. In general, the results obtained coincide with those reported by Gloess et al. (2013).
3.1 Sensory analysis
The results of the sensory analysis are shown in Table 2. There is a preference for medium roasted quality coffee samples, which gave the higher acceptance averages for most of the attributes. Differences (p<0.05) were found
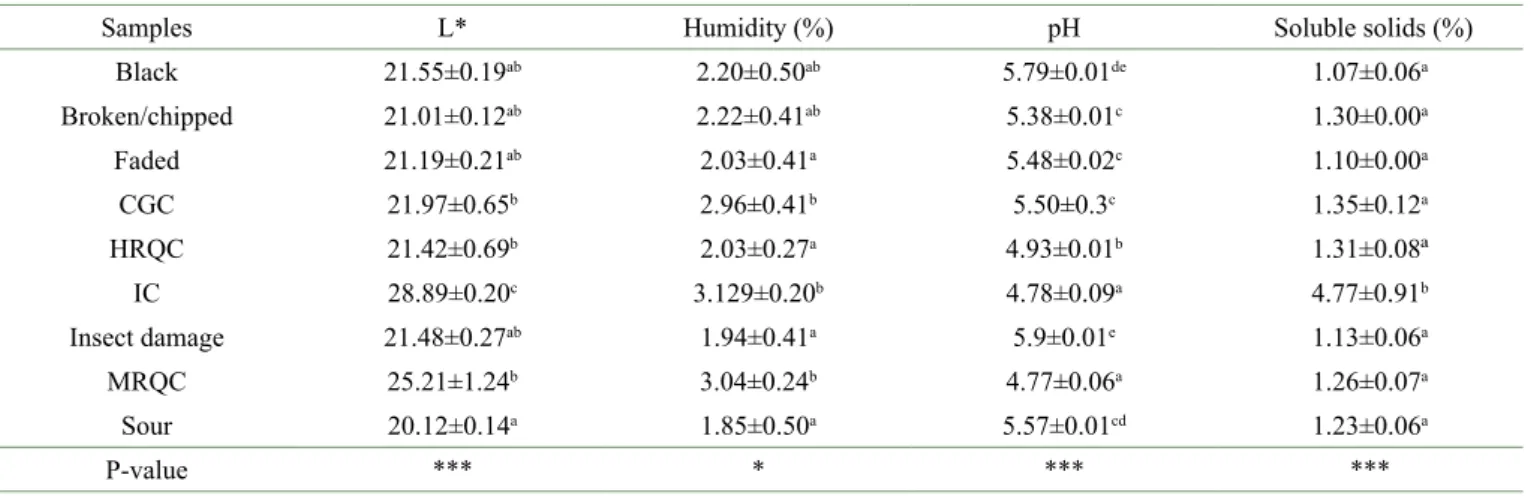
Table 1: Mean values ± standard deviation for the determination of pH, color, humidity and soluble solids of the different treatments
and ANOVA p-values for significance.
Samples L* Humidity (%) pH Soluble solids (%)
Black 21.55±0.19ab 2.20±0.50ab 5.79±0.01de 1.07±0.06a Broken/chipped 21.01±0.12ab 2.22±0.41ab 5.38±0.01c 1.30±0.00a Faded 21.19±0.21ab 2.03±0.41a 5.48±0.02c 1.10±0.00a CGC 21.97±0.65b 2.96±0.41b 5.50±0.3c 1.35±0.12a HRQC 21.42±0.69b 2.03±0.27a 4.93±0.01b 1.31±0.08ª IC 28.89±0.20c 3.129±0.20b 4.78±0.09a 4.77±0.91b Insect damage 21.48±0.27ab 1.94±0.41a 5.9±0.01e 1.13±0.06a MRQC 25.21±1.24b 3.04±0.24b 4.77±0.06a 1.26±0.07a Sour 20.12±0.14a 1.85±0.50a 5.57±0.01cd 1.23±0.06a P-value *** * *** *** *** p < 0.001. * p < 0.01.
Mean ± SEM. Different letters in the same column indicate significant differences (Tukey P<0.05).
CGC: commercial ground coffee. IC: instant coffee. HRQC: high roasted quality coffee. MRQC: medium roasted quality coffee.
Table 2: Intensity attributes mean scores (based on 5 replicates) for coffee samples in studied and ANOVA p-values for significance.
Attribute Black Broken/ chipped Faded GCC HRQC IC damageInsect MRQC Sour P-value Aroma 0.4±0.2a 0.3±0.1a 1.4±0.6a 0.4±0.1a 4.4±1.2b 4.4±0.9b 0.7±0.3a 7.11±2.1c 0.67±0.27a *** Color 8.8±3.4ab 8.9±3.6ab 8.2±3.3a 9.5±2.2b 6.1±1.7c 6.7±1.5c 8.5±3.5a 2.28±0.66d 8.82±3.36a *** Sweetness 0.8±0.3a 0.4±0.2a 0.5±0.2a 0.7±0.2a 4.3±1.2b 3.2±0.7b 0.8±0.3a 6.04±1.74c 0.53±0.22a *** Aftertaste 6.9±2.8ac 5.8±2.4abc 8.4±3.4c 5.2±1.2ab 5.2±1.4ab 3.8±0.8b 7.5±3.0ac 5.54± 1.60ab 7.8±3.18ac * Flavor 0.4±0.2a 0.5±0.2a 0.9±0.4a 0.4±0.1a 3.9±1.1b 3.5±0.8b 0.4±0.2a 6.01±1.74c 0.32±0.13a *** Body 2.4±0.9a 2.9±1.2a 7.1±2.9b 3.7±0.8a 5.0±1.4ab 3.6±0.8a 5.3±2.2ab 4.76±1.37ab 5.67±2.3ab ** Acidity 1.1±0.4ab 0.4±0.1a 1.5±0.6abc 1.0±0.2a 3.6±1.0cd 2.8±0.6bc 1.0±0.4ab 5.30±1.53d 0.72±0.30a *** Flavor to coffee 0.8±0.3a 0.4±0.1a 0.9±0.3a 0.4±0.1a 4.5±1.2b 3.4±0.7b 0.6±0.2a 6.48±1.87c 0.45±0.18a *** Bitter 1.7±0.7ab 1.6±0.65ab 1.4±0.6ab 2.4±0.5ab 4.3±1.2bc 5.3±1.2cd 1.6±0.7ab 7.13±2.06d 0.92±0.37a *** Scoring 0.3±0.1a 0.55±0.22a 0.8±0.3a 0.3±0.1a 4.6±1.2bc 3.3±0.7b 0.4±0.2a 6.02±1.74c 0.41±0.10a *** * p < 0.05. ** p < 0.01. *** p < 0.001.
Mean ± SE. Different letters, in the same row indicate significant difference (Tukey P<0.05) .
for all attributes in each of the samples. In terms of color, the lowest score went to the medium roasted quality coffee samples due to the fact that the score was given by color intensity. Thus, its value is given by the lightness of its color. In this context, the scores given by the evaluation panel were consistent with the analytical color measurements obtained prior to the sensory analysis for the samples evaluated (Table 1), with the exception of samples of instant coffee that were light in color when ground. The sensory analysis for coffee preparation showed a change in color, which placed the drink in the dark coffee category. The ratings for the acidity attribute were consistent with pH values; samples of medium and high roasted quality coffee were highlighted, as were samples of ground instant coffee with the highest average ratings. The attributes that differed the most among the samples were: sweetness, aroma, taste, and coffee flavor. The best results in these attributes were presented by medium roasted quality coffee, followed by samples of high roasted quality coffee and instant ground coffee, while the other samples obtained rating values close to zero.
The statistical analysis of sensory attributes allowed to group the samples as follows: a first group including
commercial ground coffees together with the defects, which presented the lowest scores by attribute, indicating the presence of defective beans and contributing undesirable sensory characteristics in the coffee beverage (Toledo et al., 2016). The second group included samples of instant coffee and high roasted quality coffee. The sensory acceptance of instant coffee samples can be given by the chemical composition of the product during its elaboration process, which improves its attributes and approximates its sensorial characteristics to those of a high roasted quality coffee. Finally, the samples of medium roasted quality coffee formed a last group as they yielded the best results; however, in the attributes of aftertaste, body, acidity, and scoring, they presented similar behavior to the high roasted quality coffee samples, and in the attributes of aftertaste and body, to the instant coffee samples.
3.2 Sensory descriptors
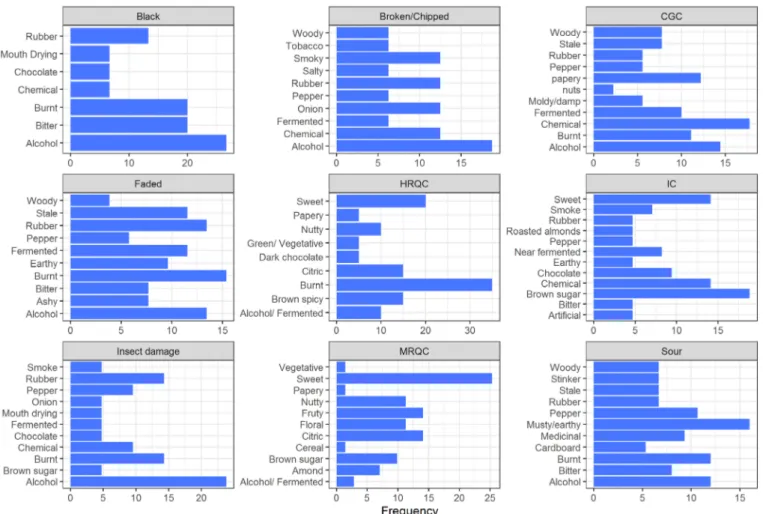
Figure 1 shows the descriptors obtained for the samples evaluated. Medium roasted quality coffee presented sweet, fruity and citrus characteristics. As the roasting level increased, there was a decrease in positive descriptors and
Figure 1: Descriptors provided by semi-trained judges and their percentage occurrence in coffee samples; associated according
to the taster wheel of the coffee taster based on the sensory lexicon dictionary of World Coffee Research (WCR; SCA, 2017). CGC: commercial ground coffee. IC: instant coffee. HRQC: high roasted quality coffee. MRQC: medium roasted quality coffee.
the appearance of undesirable characteristics such as smoky, burnt, alcoholic, phenolic, woody, and hay-like, among others, indicating increased negative attribute intensity with respect to the roasting level however, positive descriptors associated with sweet notes and brown species were also obtained. These results are consistent with other studies such as those conducted by Bhumiratana, Adhikari and Chambers (2011) and Giacalone et al. (2019), who describe a significant increase in aroma associated with prolonged roasting time and temperature, resulting in an increase in sensory attributes such as bitter, astringent, burnt, licorice, and tobacco; while sweet/ fruit and acid attributes correlated negatively with the roasting level.
The defects samples presented descriptors that are usually associated with negative characteristics such as alcohol and rubber notes that lead to low acceptance of the drink. The defects also exhibited the different notes, black beans presented burnt and bitter notes; broken/chipped sample exhibited smoky, onion and chemical notes; faded beans showed fermented, earthy and burnt notes; insect damage evidenced peppery, chemical and smoked notes; sour defects mainly presented peppery, medicine-like, earthy and smoky notes. On the other hand, the samples of commercial ground coffee presented behavior similar to that observed in the defects with spicy, fermented, chemical, burnt, and alcohol notes. Finally, in the instant coffee samples, sweet, chocolate and brown sugar descriptors were obtained, similar to what was found in the samples of medium and high roasted quality coffee. However, descriptors such as earthy, chemical, spicy,
bitter, and artificial flavors were also evidenced; descriptors considered unfavorable for the sensory acceptance of the coffee drink (Geel; Kinnear; De Kock, 2005).
3.3 Infrared spectroscopy
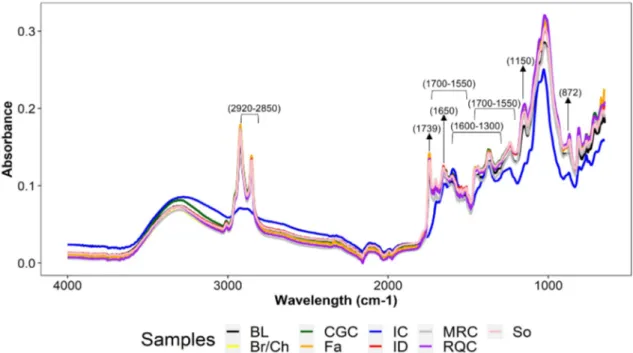
Figure 2 shows the absorbance results for each of the samples evaluated at each longitude. Comparatively, samples of commercial ground coffee, coffee defects (broken/ chipped, sour, insect damaged, faded, black), high and medium roasted quality coffees presented similar spectra. However, differences in absorbance levels were found in certain parts of the infrared spectroscopy fingerprint region (1800-650 cm-1). Commercial instant coffee samples showed
qualitatively marked differences, especially in regions of interest such as 3000-2800 cm-1 and 1800-1500 cm-1, which is
due to additional thermal stages in instant coffee processing. Production of concentrated liquor in instant coffee leads to the loss of volatile compounds (Oliveira et al., 2009) and the caramel flavor is imparted to the product those changes cause differences in the product’s relative concentration and chemical composition (Villalón et al., 2018) resulting in significant changes in the original chemical components of the bean (Cho et al., 2014). This explains the absence of peaks at some of the wavelengths. In the 3280 cm-1 band attributed
to water, the behavior for all treatments was similar, the highest levels of absorbance were presented in samples of instant coffee and commercial ground coffee, followed by samples of high roasted quality coffee and coffee defects with the same absorbance level.
Figure 2: Identification of coffee chemical compounds in infrared spectroscopy obtained from ART-FTIR. The samples correspond
to defective coffee beans: broken/chipped (Br/Ch), sour (So), insect damage (ID), faded (Fa), black (BL), commercial ground coffee (CGC), high roast quality coffee (HRQC), medium roast quality coffee (MRQC), instant coffee (IC).
The most relevant information for the samples was found in the 1800-650 cm-1 region where non-volatile compounds of
interest for coffee and precursors of certain sensory attributes such as astringency, sweetness and acidity were evidenced. Infrared spectroscopy showed peaks of compounds such as carbohydrates, polysaccharides, caffeine, trigonelline, chlorogenic acids and proteins, which provide particular characteristics at sensory level (Buffo; Cardelli, 2004; Charles et al., 2005). These compounds contribute directly to taste, with attributes such as bitterness, astringency and sweetness, and may act as precursors of volatile compounds, which ultimately translate into sensory descriptors associated with coffee quality (Sunarharum; Williams; Smyth, 2014).
Peaks between 1153 and 1150 cm-1 have been reported
for polysaccharides (Craig et al., 2018). The treatments that presented greater absorbance in the wavelength of 1150 cm-1
were high quality roasted coffee and commercial ground coffee. The evaluated treatments presented peaks at a longitude of 872 cm-1 reported by other studies to the presence of carbohydrates
(Lyman, et al., 2003). High roast quality coffee showed the highest absorbance, followed by medium roasted quality coffee treatments; commercial ground coffee and coffee defects samples exhibited similar behaviors. The presence of carbohydrates allows sweet notes to develop and be perceived (Sunarharum; Williams; Smyth, 2014), generating various kinds of compounds, such as carboxylic acids, furans and aldehydes during roasting (Wei; Tanokura, 2014).
Peaks that have been related to caffeine in other studies in coffee (Craig; Franca; Oliveira, 2012a; Craig; Franca; Oliveira, 2012b) were observed in the 2920 and 2850 cm-1 range. Similar results were reported by Paradkar
and Irudayaraj (2002). The region in question is associated with C-H bond vibration of the methyl group of the caffeine molecule (Craig; Franca; Oliveira, 2012a; Craig; Franca; Oliveira, 2012b). In other studies, the 2920 and 2850 cm-1
sharp bands are attributed to combined bands to which both caffeine and lipids contribute (Craig; Franca; Oliveira, 2012b; Cremer; Kaletunç, 2003). In this region, it is important to point out that the samples of instant coffee did not present peaks, marking a difference with the other samples evaluated and that presented very similar levels of absorbance among them. Additionally, in the 1659 cm-1 wavelength identified as the
determinant band for caffeine in roasted coffee (Garrigues et al., 2000), the samples evaluated showed a displacement of the peak to the 1650 cm-1 length. Bearing in mind that the presence
of caffeine contributes to the bitterness, body, and taste of the coffee drink (Sunarharum; Williams; Smyth, 2014) the results of infrared spectroscopy coincide with the sensory evaluation for the attributes of body and bitterness, where the evaluation panel did not present a discrepancy between the scores of the samples of coffee defects, commercial ground coffee, and high roasted quality coffee. These in turn presented the
highest absorbance values in the areas described above related to caffeine.
Trigonelline is associated to peaks in the region between 1600 -1300 cm-1 (Craig; Franca; Oliveira, 2012b).
The compound is an alkaloid biologically derived from the enzymatic methylation of nicotinic acid (Farah, 2011), and it is of great relevance in coffee as it is responsible for bitterness and is a precursor to the formation of different kinds of volatile compounds during roasting, such as pyrroles and pyridines (Farah, 2011). In the results obtained, there is evidence of low absorbance for the instant and medium roasted high-quality coffee samples, associated with the higher values of acceptance by the panel in the attribute of bitterness in the sensory analysis (5.26 ± 1.18 and 7.13 ± 2.06 respectively). The lower or more moderate the bitterness, the greater the acceptance.
Consistent with Craig, Franca and Oliveira, (2012b), chlorogenic acids occurred in the 1420-1000 cm-1 region,
however, the presence of other types of compounds in this region of the spectrum is possible. The results observed in Figure 2 show that the samples of commercial and quality ground coffees exhibited the highest absorbance in these wavelength ranges. Chlorogenic acids are a family of esters formed between certain trans-cinnamic acids and quinic acid (Sunarharum; Williams; Smyth, 2014). According to the descriptions by Silverstein et al, (2005), axial deformation C-O of quinic acid occurs in the 1085-1050 cm-1 range, while angular deformation O-H occurs
between 1420 and 1330 cm−1. Consequently, bands in the
1420-1050 cm-1 range could be due to the presence of chlorogenic
acids. In this respect, the samples of instant coffee did not show pronounced peaks in the region in question, indicating low content of this compound compared to the other samples studied. During roasting, the trans-cinnamic acids degrade and quinic acid increases, increasing bitterness in high roasted coffees (Sunarharum; Williams; Smyth, 2014). The samples with the highest roasting level exhibited higher absorbance values, which is consistent with the results for the bitterness attribute of sensory analysis, where the best acceptance was evidenced in medium roasted quality coffee.
Lipids were observed to be present at the 1739 cm-1
wavelength. Ground commercial and high quality coffee treatments showed a response at this wavelength value, only instant coffee showed different absorbance. Other authors have associated the 1740 cm-1 band with the carbonyl (C=O)
vibration in fatty acids or aliphatic esters indicating possible association with lipids (Lyman et al., 2003; Craig; ; Franca; Oliveira, 2012b).
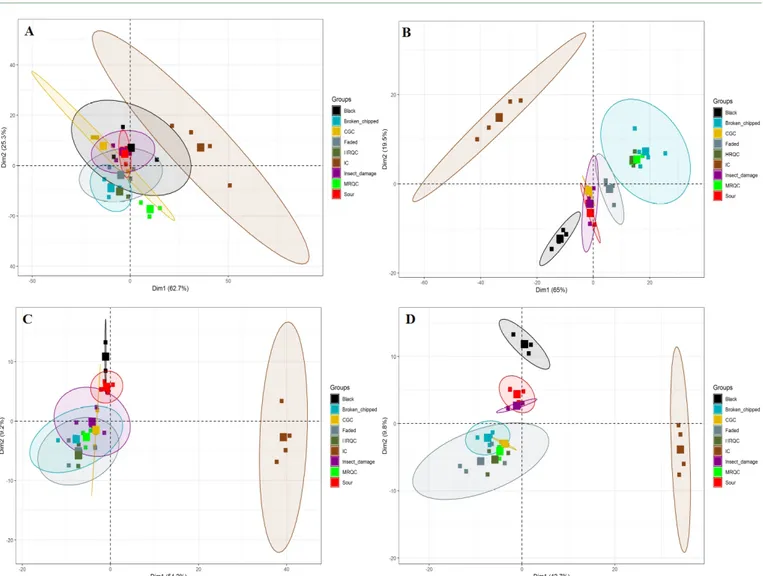
3.4 Multivariate analysis: Principal components
After spectra processing, area normalization, first and second derivative exhibited the best sample grouping. The PCA results for the raw data and each of the IR spectra data treatments for each of the samples studied are shown in Figure 3.
A grouping of samples obtained with the first and second derivative differentiated defects such as black and sour beans, while the samples evaluated for quality coffees were grouped with other categories of defective beans. The second derivative results showed that quality coffee samples (medium and high roasted) were discriminated with the broken beans. This type of defect is purely physical and did not affect the sensory analysis, but could present a different behavior than whole beans during roasting.
IR spectra data discrimination obtained after area normalization provided the best results (Figure 3B). In this case, instant coffee was differentiated from the rest of the samples as located in the upper left quadrant and separated from the medium and high roasted quality coffee samples, where broken and chipped samples were also located. These coffee defects do not usually generate negative characteristics in the beverage, because they are beans that break during processing and their chemical composition is not affected. Additionally,
Figure 3: PCA scores scatter plot (PC1 vs. PC2) of FTIR spectra obtained from (A) Raw data, (B) Area normalization, (C) First
derivative, (D) Second derivative.
IC: instant coffee. HRQC: high roasted quality coffee. MRQC: medium roasted quality coffee.
it was evidenced that the commercial ground coffee samples were in the same groups as the defective samples, except for defective black beans. The rest of the treatments applied to the spectra did not allow discrimination among the samples. Regardless of infrared spectroscopy data treatment, instant coffee samples were always shown separately from the other samples. These results coincide with those reported by Craig, Franca and Oliveira, (2012b), who demonstrated that by applying principal components analysis to spectral data, processed with the first derivative, made it possible to separate defective and non-defective coffee samples.
The evaluation of the loads obtained for each variable, after the PCA analysis of the IR spectra treated with area normalization, indicated that the spectral range with the greatest influence on the values of PC1 were 1130-1050, 2000-1800, 2850-2821 cm-1, this region previously associated with
the presence of lipids. In the case of PC2, the spectral ranges with the greatest influence were 1760-1790 cm-1, 1650-1600
cm-1, 1430-1400 cm-1, and the peaks in the 2880-2850 cm-1 region.
Both areas were associated with the presence of caffeine, CGA and lipids; mentioned regions separated instant coffee from other samples.
The results mentioned above show that the chemical markers given by IR spectra analysis of the samples allow to obtain a grouping that coincides with the sensory results. It was also found that the chemical markers for the commercial coffee samples were similar to those found for the defects: sour, insect damaged, and faded, demonstrating the technique’s capacity for quality control of roast coffee in the identification of possible defects.
4 CONCLUSIONS
High quality medium roast coffee presented the highest acceptance averages in sensory analysis evidencing higher frequencies for positive attributes: as the roasting level increased, the descriptors associated with good quality diminished, resembling commercial ground coffee and coffee defects. The sensory analysis did not allow to differentiate between the defects evaluated. On the other hand, the treatment of infrared spectrum data separated the defects of black and sour beans from the rest of the samples.
The transformation of IR spectra data normalized by area combined with principal component analysis made it possible to find a separation of samples, in accordance with the sensory results, in which four groups were distinguished: a) medium and high roasted quality coffee, with broken and chipped defects; b) commercial ground coffee with sour, insect damaged, and faded defects; c) black defects, and d) instant coffee. Finally, the results showed that the samples evaluated of commercial coffee are assigned to the same group of defective coffee beans. Further studies are needed to compare FTIR spectra processing in order to obtain a consistent PCA grouping method.
5 ACKNOWLEDGMENT
This work was supported by the South Colombian Coffee Research Center CESURCAFÉ – Universidad Surcolombiana. Authors contributed equally to this study.
6 REFERENCES
BAHAMÓN, A. F.; GUZMÁN, G. N.; PARRADO, L. X.
ATR-FTIR for Discrimination of Espresso and Americano Coffee Pods. Coffee Science, 13(4):550-558, 2018. BARBIN, D. F. et al. Application of infrared spectraltechniques on quality and compositional attributes of coffee: An overview. Food Research International, 61:23-32, 2014.
BHUMIRATANA, N.; ADHIKARI, K.; CHAMBERS, E. Evolution of sensory aroma attributes from coffee beans to brewed coffee. LWT - Food Science and Technology, 44(10):2185-2192, 2011.
BUFFO, R. A.; CARDELLI, C. Coffee flavour: An overview.
Flavour and Fragrance Journal, 19(2):99-104, 2004.
CHARLES, B. M. et al. Interactions between volatile and nonvolatile coffee components. 1. Screening of nonvolatile components. Journal of Agricultural and
Food Chemistry, 53(11):4417-4425, 2005.
CHO, A. R. et al. Influence of roasting conditions on the antioxidant characteristics of colombian coffee (Coffea Arabica L.) beans. Journal of Food Biochemistry, 38(3):271-280, 20114.
CRAIG, A. P. et al. Mid infrared spectroscopy and chemometrics as tools for the classification of roasted coffees by cup quality. Food Chemistry, 245:1052-1061, 2018.
CRAIG, A. P.; FRANCA, A. S.; OLIVEIRA, L. S. Discrimination between defective and non-defective roasted coffees by diffuse reflectance infrared Fourier transform spectroscopy. LWT - Food Science and
Technology, 47(2):505-511, 2012a
CRAIG, A. P.; FRANCA, A. S.; OLIVEIRA, L. S. Evaluation of the potential of FTIR and chemometrics for separation between defective and non-defective coffees. Food
Chemistry, 132(3):1368-1374, 2012b.
CRAIG, A. P.; FRANCA, A. S. OLIVEIRA, L. S.
IRUDAYARAJ, J. ILELEJI, K. Fourier transform infrared spectroscopy and near infrared spectroscopy for the quantification of defects in roasted coffees. Talanta,
Netherlands, v.134: p.379-386, 2015.
CREMER, D. R.; KALETUNÇ, G. Fourier transform infrared microspectroscopic study of the chemical microstructure of corn and oat flour-based extrudates.
Carbohydrate Polymers, 52(1):53-65, 2003.
DIAZ, D. R. C. et al. Quantitative assessment of specific defects in roasted ground coffee via
infrared-photoacoustic spectroscopy. Food Chemistry, 255:132-138, 2018.
FARAH, A. Coffee Constituents. In: CHU, Y. F. Coffee: Emerging Health Effects and Disease Prevention (Ed.), Wiley-Blackwell, 2012, 352p.
FUJIOKA, K.; SHIBAMOTO, T. Chlorogenic acid and caffeine contents in various commercial brewed coffees.
GARRIGUES, J. M. et al. Fourier transform infrared determination of caffeine in roasted coffee samples.
Journal of Analytical Chemistry, 366(3):319-322,
2000.
GEEL, L.; KINNEAR, M.; DE KOCK, H. L. Relating consumer preferences to sensory attributes of instant coffee. Food Quality and Preference, 16(3):237-244, 2005.
GIACALONE, D. et al. Common roasting defects in coffee: Aroma composition, sensory characterization and consumer perception. Food Quality and Preference, 71:463-474, 2019.
GLOESS, A. N. et al. Comparison of nine common coffee extraction methods: Instrumental and sensory analysis.
European Food Research and Technology,
236(4):607-627, 2013.
HERNÁNDEZ, J. A. et al. Analysis of the heat and mass transfer during coffee batch roasting. Journal of Food
Engineering, 78(4):1141-1148, 2007.
ISO 9001. Quality management system, principles and
terminology. 2000.
LYMAN, D. J. et al. FTIR-ATR analysis of brewed coffee: Effect of roasting conditions. Journal of Agricultural
and Food Chemistry, 51(11):3268-3272, 2003.
MAZZAFERA, P. Chemical composition of defective coffee beans. Food Chemistry, 64(4):547-554, 1999.
OLIVEIRA, A. L. et al. Sensory evaluation of black instant coffee beverage with some volatile compounds present in aromatic oil from roasted coffee. Ciência e Tecnologia de
Alimentos, 29(1):76-80, 2009.
PARADKAR, M. M.; IRUDAYARAJ, J. Rapid determination of caffeine content in soft drinks using FTIR-ATR spectroscopy. Food Chemistry, 78(2):261-266, 2002. PICCINO, S. et al. Aromatic composition and potent
odorants of the “specialty coffee” brew “Bourbon Pointu” correlated to its three trade classifications. Food
Research International, 61:264-271, 2014.
PUERTA, G. I. Cómo garantizar la buena calidad de la bebida del café y evitar los defectos. Avances técnicos
CENICAFÉ. 2001. Available in: <https://www.cenicafe.
org/es/publications/avt0284.pdf>. Access in:: June, 14, 2019.
R CORE TEAM. 2019. R: A language and environment for statistical computing. R Foundation for Statistical Computing, Vienna, Austria. <https://www.R-project.org/>.
REIS, N.; FRANCA, A. S.; OLIVEIRA, L. S. Discrimination between roasted coffee, roasted corn and coffee husks by Diffuse Reflectance Infrared Fourier Transform Spectroscopy. LWT - Food Science and Technology, 50(2):715-722, 2013a.
REIS, N.; FRANCA, A. S.; OLIVEIRA, L. S. Performance of diffuse reflectance infrared Fourier transform spectroscopy and chemometrics for detection of multiple adulterants in roasted and ground coffee.
LWT - Food Science and Technology, 53(2):395-401,
2013b.
RODRIGUEZ, S. L. E.; ALLENDORF, M. E. Use of FTIR for rapid authentication and detection of adulteration of food. Annual Review of Food Science and Technology, 2(1):467-483, 2012.
SANCHEZ, K.; CHAMBERS, E. How does product preparation affect sensory properties? An example with coffee. Journal of Sensory Studies, 30(6):499-511, 2015. SPECIALTY COFFEE ASSOCIATION - SCA. Protocols:
cupping specialty coffee. Available in: <http://scaa. org/?page=resources&d=cupping-protocols> Access in: June, 02, 2019.
SILVA, A. N. da. et al. Performance of hedonic scales in sensory acceptability of strawberry yogurt. Food Quality
and Preference, 30(1):9-21. 2013.
SILVERSTEIN, R.; WEBSTER, X.; KIEMLE, J. Infrared Spectrometric. In:SILVERTEIN, R.; WEBSTER, X.; KIEMLE, J. Spectrometric identification of organic
compounds. 8.ed. United States of America, Wiley, 2005.
466p.
SUNARHARUM, W. B.; WILLIAMS, D. J.; SMYTH, H. E. Complexity of coffee flavor: A compositional and sensory perspective. Food Research International, 62:315-325, 2014.
TOLEDO, P. R. et al. Relationship between the different aspects related to coffee quality and their volatile compounds. Comprehensive Reviews in Food Science
and Food Safety, 15(4):705-719, 2016.
VALENCIA, J.; PINZÓN, M.; GUTIÉRREZ, R. Caracterización fisicoquímica y sensorial de tazas de café producidas en el departamento del Quindío. Revista
Alimentos Hoy, 23(36):150-156, 2015.
VILLALÓN, N. et al. An 1H NMR-based
metabolomic approach to compare the chemical profiling of retail samples of ground roasted and instant coffees. Food Research International, 106:63-270, 2018.
WEI, F.; TANOKURA, M. Chemical Changes in the Components of Coffee Beans during Roasting. In: PREEDY, V. R. (Ed). Coffee in Health and Disease
Prevention. Academic Press, 2014, 1080p.
WCR - WORLD COFFEE RESEARCH. Sensory lexicon: Unabridged definition and references.2017.
Available in: <https://worldcoffeeresearch.org/media/ documents/20170622_WCR_Sensory_Lexicon_2-0.pdf>. Access in: June, 20, 2019.
ZANIN, R. C. et al. Good cup quality roasted coffees show wide variation in chlorogenic acids content. LWT - Food