O R I G I N A L P A P E R
Population census and nesting habitat selection of thin-billed prion
Pachyptila belcheri
on New Island, Falkland Islands
Received: 19 August 2002 / Accepted: 11 November 2002 / Published online: 24 January 2003 Ó Springer-Verlag 2003
Abstract Seabirds have the potential to be used as indi-cators for monitoring changes in the southern oceans. However, many species and populations are still poorly known. The thin-billed prion (Pachyptila belcheri) is the most abundant seabird species around the Falkland Islands, but this far, no detailed censuses of its popula-tions had been carried out. In this study, we developed a methodology, based on standard field methods combined with a Geographical Information System, to census the biggest known colony (New Island) of this species. Data were also collected on nesting habitat preferences. Results indicate that there are 1,081,000 (95% confidence limits: 815,000–1,346,000) apparently active nest-burrow entrances on New Island South which, given the very high occupancy rates by known breeders, should correspond to a similar number of nesting couples. We present quantitative evidence that
this result can be extrapolated for the entire island, giving an overall estimate of 2 million pairs. Prions have an almost ubiquitous distribution on New Island, but they are more frequent in areas with steeper slopes (ex-cluding cliffs). Habitats dominated by introduced grass species generally hold higher densities of nests in com-parison to most native formations.
Introduction
Petrels (Order Procellariiformes) are by far the most diverse, widespread and abundant bird group of the southern oceans (Antarctic and sub-Antarctic), being only regionally surpassed in terms of biomass by penguins (Sphenisciformes). They are therefore an interesting group to monitor, as their behaviour and population dynamics might reflect changes in those large, remote and little-known ecosystems (Montevecchi1993; Monaghan 1996). This is particularly relevant when considering important changes related to fisheries and climate that seem to be occurring in the southern oceans (e.g. Croxall 1992). Although many studies (including some long-term) have been developed in the last decades, particularly concerning albatrosses (Diomedeidae), many petrel species and populations remain poorly known.
The thin-billed prion, Pachyptila belcheri, is a small petrel which, although occasionally found almost any-where in the sub-Antarctic oceans, is only known to nest at a handful of locations: on the Falkland Islands, Isla Noir (Chile), Crozet and Kerguelen (Warham 1990; del Hoyo et al. 1992). It is considered not-threatened (del Hoyo et al. 1992), but little is known about its popula-tion size, trends and ecology (but see, for example, Strange 1980; Jouventin 1994). The most important nesting site for this species is thought to be New Island, in the Falklands (del Hoyo et al. 1992), but no censuses on this site or other important Falkland colonies have ever been attempted. In fact, except for studies on black-browed albatrosses, Diomedea melanophris, and
DOI 10.1007/s00300-002-0465-9
Paulo Catry Æ Ana Campos Æ Pedro Segurado Mo´nica Silva Æ Ian Strange
P. Catry (&)
Unidade de Investigac¸a˜o em Eco-Etologia, Instituto Superior de Psicologia Aplicada,
Rua Jardim do Tabaco 44, 1149–041 Lisbon, Portugal E-mail: paulo.catry@netc.pt
P. Catry
Edward Grey Institute of Field Ornithology, University of Oxford, Department of Zoology, UK A. Campos
Quinta de Sa˜o Caetano, E´vora, Portugal P. Segurado
Unidade de Macroecologia e Conservac¸a˜o,
Universidade de E´vora, Centro de Ecologia Aplicada, 7002–554, E´vora, Portugal
M. Silva
Department of Zoology, University of Washington, Box 351800 Seattle, WA98195, USA
I. Strange
New Island South Conservation Trust, New Island South, Falkland Islands Present Address:P. Catry
British Antarctic Survey, High Cross, Madingley Road, CB3 0ET, Cambridge, UK
penguins (e.g. Thompson and Rothery 1991; Bingham 1998), most published figures on Falkland seabirds result from rather crude estimates, and in the particular case of the thin-billed prion, estimates of the population size differ by an order of magnitude (Croxall et al. 1984; Woods and Woods 1997).
In this study, we attempt to estimate the population size (by assessing nest-entrance density) of the thin-billed prion in New Island, to provide an indication of the importance of this site for the species and baseline data for future assessments and monitoring. At the same time, we studied the distribution of the nesting population, in order to better understand if there are land-based limiting factors that could condition its distribution and abundance. The large number of birds and relatively wide distribution at this site forced us to develop a methodology (based on simple and standard methods; see, for example, Campos and Granadeiro 1999 or Stenhouse et al. 2000) that might be useful for researchers facing similar conditions.
Materials and methods
The Falkland Islands are located about 500 km northeast of the closest point of South America at the southern end of the Pata-gonian shelf. The archipelago is formed by two main islands (East and West Falkland) and a few hundred small outer islands and islets. New Island is one of the westernmost islands in the Falk-lands, facing the open ocean and covering a flat area of approxi-mately 1,970 ha. The ground is hilly (highest point 226 m above sea level), with high cliffs in the west and low ground on the eastern side of the island.
New Island has a 150-year history of depredation and exploi-tation, having been used by whalers, sealers and penguin oilers, as well as by sheep farmers who introduced cattle, pigs, goats, rabbits, cats, rats and mice (cattle, pigs and goats have since been removed; few cats and sheep remain). The natural cover has been severely changed due to grazing, fires and the introduction of exotic species. At a certain point (mid-twentieth century), prions were considered a pest by the owner of the island, who introduced pigs to root them out. Feral cats were plentiful in those days. Despite all these rav-ages, New Island still holds significant seabird populations, with several thousand nesting pairs of each of the following species: black-browed albatross, gentoo (Pygoscelis papua), Magellanic (Spheniscus magellanicus) and rockhopper (Eudyptes chrysocome) penguins and imperial shags (Phalacrocorax atriceps), as well as several hundred fur-seals (Arctocephalus australis) and small numbers of sea-lions (Otaria byronia). The human population usually varies from 3 in winter to 5–15 in summer.
The island is divided into two properties of approximately the same surface (the exact border has not been precisely defined). Both halves are managed as nature reserves. In New Island North, a few dozen sheep remain, but otherwise there are no significant land uses in the whole island. Due to access facilities, our work was carried out on New Island South only.
Census work
Fieldwork (burrow counts) was conducted between 14 January and 5 February 2002, during early prion-chick rearing. We used a systematic sampling approach to estimate prion density. We ran 32 transects crossing the whole of New Island South from east to west (Fig. 1). Transect location was chosen following a gridded map, the grid of which had been defined for a different purpose and with no
relation to any ground characteristics. While in the field, each transect starting point was located by map reading. Direction was established using a compass. Along the transect, we stopped at every 30 m (approximately measured by counting steps, always by the same person and after calibration taking into account differ-ences between habitats and slopes). The application of these pro-cedures resulted in all plots (a total of 934) being randomly located in relation to habitat features and burrow-entrance abundance. At each location, one fieldworker stood at the centre of the plot holding the tip of a 3.99-m rope, while a second observer held the other end and walked describing a circle and counting all burrow entrances whose centres fell inside the 50-m2plot. Counted burrows were those with a clear entrance (most had signs of occupancy, like feathers, eggshells, footprints or signs of recent digging). Burrow entrances overgrown by the vegetation (very few were in this situ-ation) were not counted. Only a few very steep cliff areas above the sea on the west coast were not surveyed. Excluding rock faces (unsuitable for prions), non-surveyed areas represent less than 1% of New Island South surface.
Habitat description
In each plot, the following environmental variables were measured: 1. Altitude. Measured in feet according to the only available map. Eight categories (100 foot intervals) were defined ranging from 1 (0–100 feet) to 8 (700–800 feet).
2. Slope. Six slope categories ranging from 0 (flat ground) and 1 (1–10°) to 5 (41–50°).
3. Orientation. Eight 45° classes centred in the main compass bearings (N, NE, E, etc.). Not measured on flat ground. 4. Habitat type. It includes ten categories (Table 1). When two
categories occurred in a plot, the dominant type was chosen to Fig. 1 Thin-billed prion-nest density in plots along transects in New Island South
describe it. However, in the vast majority of plots only one type of habitat was present.
5. Rock. Presence (1) or absence (0) of exposed slabs of rock or stones.
6. Bank. Presence (1) or absence (0) of peat banks (taller than 50 cm), generally formed by erosion.
7. Penguins. Number of Magellanic penguin burrows in the plot.
Data analysis
To study the influence of the environmental variables on prion distribution, we used logistic regressions and graphical methods. In order to explore the existence of spatial autocorrelation (Cliff and Ord 1998) between counts of prion burrows, an omnidirectional semi-variogram (e.g. Maurer 1994; Villard and Maurer 1996) was adjusted using the Software Variowin version 2.21 (Pannatier 1996). An interactive procedure was used to model the geometry of the semi-variogram and get a rough estimate of the distance between quadrats at which autocorrelation became negligible. This distance (300 m) was used as a rule to derive sub-samples of non-autocorrelated observations from the original data matrix.
Logistic regression models were adjusted to each sub-sample of non-autocorrelated data using presence and absence of prion nest entrances as dependent variables. A backward stepwise elimination procedure based on likelihood-ratio test (Hosmer and Lemeshow 1989) was used to select variables to enter the models. A P-value of 0.1 was used as threshold for variable inclusion (e.g. Shriner et al. 2002). Model performance was quantified using the AUC index, which represents the area under the ROC (Receiver Operator Characteristic) curve (Fielding and Bell 1997). This measure assesses how far from chance the model predicts occurrence, varying from 0.5 (random classification) to 1 (perfect classifica-tion). A crossvalidation procedure was used to choose the subset of variables that better predicted the occurrence of prion nest entrances: each model, adjusted to each sub-sample, was validated using the remainder sub-samples as test samples; the model that had the highest mean AUC was selected as the final model (Fielding and Bell 1997). The number of models in which a variable was included was used as a measure of its relative importance.
A map of New Island (Directorate of Overseas Survey Map 1961, sheet no. 16 DOS 453) with altitude contours was digitalised and introduced into the Geographical Information System (GIS) ArcView (ESRI 1999). A digital elevation model and a slope sur-face with 4-m resolution were then produced using the ArcView 3d Analyst extension. This allowed us to calculate the flat surface of the island (1,969.6 ha), the ‘‘real surface’’ (2,133.9 ha), which takes into account the increase in area caused by the raggedness of the terrain, and also the ‘‘potentially suitable nesting area’’ (2,066.6 ha), which is the ‘‘real surface’’ minus the area of the very steep slopes (>50°) and cliffs. It was this last value that was used to calculate the number of burrow entrances on the entire island. Our estimate of the total flat surface is lower than the values published by the Department of Agriculture (2,314 ha), but not significantly different from a recent military estimate by British Forces, Falk-land IsFalk-lands (personal communication).
Results
Nest density and distribution
Prion nest entrances were found in 51.1% of the 934 study plots and were distributed in the whole study area (Fig. 1). A mean number of 10.3 (range: 1–71) entrances per plot where prions were present (n =477) was recorded. Prion burrows were clumped (variance/mean ratio of 17), often being found in aggregations that
Table 1 Habitat categories in New Island defined for the purpose of studying prion habitat selection (for more details on the Falklands flora and vegetation, se e Moore 1968 and Davies and McAdam 1989) Habitat Description Long grass Grass growing longer than 0.15 m. In most places dominated by the introduced Holcus lanatus . This grass was extensively sown in New Island in the middle of the twentieth century. In some areas it showe d sign s o f disease and patches with dense ma ts of dead grass were frequent Native grass Mats of dense and long native species of grass, generally monospecific, the most important of which is the spiky grass Poa robusta . In some areas other superficially similar species occur and dominate, for example, the mountain blue grass Poa alopecurus and the blue couch-grass Agropy ron magellanicum Short grass Grass shorter than 0.15 m (usually much shorter than this). It included several species (several unidentified), most of which were introdu ced Sorrel Sheep’s sorrel Rumex acetosella . It is mostly found on eroded peat or open soil, on areas that have been disturbed, noticeably by prion excavation activities Tussac Maritime tussac formation is confi ned to coastal areas and is dominated by stands of tussac grass Parodiochloa flabellata . It is now less widespread than previously due to overgrazing, fires, pests anddisease. Although in some areas tussac grass can grow to 3–4 m, on New Island it rarely exceeds 2 m , probably due to low rainfall Heath This formation is dominated by a dwarf shrub heath, the diddle-dee Empetrum rubrum , and locally by the mountain berry Perne ttya pumila Feldmark Cushion plants are the dominant types in the feldmark formation, growing mostly at higher ground and ridges (i.e. in exposed conditions). Common species include the balsam bog Bolax gummifera , different Azorella species and Nassauvia gaudichaudii , often interspersed with short grasses Ferns Growing in areas usually dominated by diddle-dee, there are some pure beds of live and dead ferns Blechnum spp., forming monosp ecific car pets of variable surface Gorse Although rare on New Island (found mostly around the settlement), this exotic gorse Ulex europaea formation was distinguished for its uniqueness and the fact that it seemed impenetrable for the prions Bare soil Areas with little or no vegetation growth, varying from deep peat to a thin layer or almost complete absence of soil on rocky ground
varied from a handful to dozens of nests. However, even within those aggregations, density was variable. Also, isolated burrow entrances and areas with very low densities were not uncommon. The highest density recorded in a 50-m2plot was 1.42 entrances m)2.
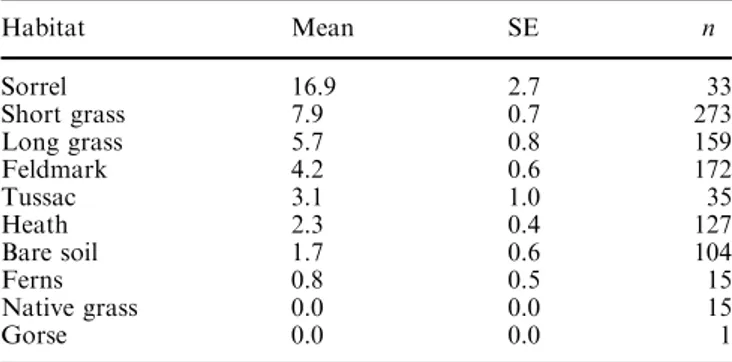
Eighteen sub-samples of non-autocorrelated plots, each comprising between 41 and 59 quadrats, were derived from the original data matrix (see Materials and methods). The slope and habitat were the variables that more frequently were included in the models (Table 2). The best model, which includes the variables slope, habitat and bank (Table 3), classifies the validation data sets with an AUC of 0.75, which can be considered as a fair classification (Swets 1988), and has a good score for the classification of the training data set (0.84). The number of prion burrows increased with slope in all sub-samples. Prion nests were clearly more abundant in areas covered with grass (particularly short), and were rare or absent in native long grasses, ferns and gorse stands (Table 4). Heather, feldmark vegetation and tussac grass had intermediate densities. Areas covered with sorrel had the highest densities of prions, but this
probably resulted from sorrel growing in areas disturbed by the prions rather than the birds selecting sorrel-cov-ered patches. It is possible that other species of grasses were also favoured by the presence of prions, due to soil disturbance and presumably elevated nitrogen contents. However, while sorrel often perfectly matched the dis-tribution of high-density prion colonies, such a pattern was not evident with short or long grasses. Areas with bare soil varied from high densities (in deep soil) to al-most no nest sites, but in general they had few birds. The presence of a peat bank increased the probability of prion occurrence.
How representative is our sample?
We placed our study plots in a systematic way along transects, as a random design would have been too la-bour intensive. So the question of whether or not our sample is representative of both New Island South and the whole island is an important one. We took the most important predictor of burrow distribution to suggest that our (large) sample is as good as a random one. A comparison of the distribution of slope frequencies in the study plots or in a similar number of randomly as-signed plots (placed using GIS) in New Island South reveals almost no differences (Fig. 2). Furthermore, a comparison with a similar random sample for New Is-land North shows only small differences (Fig. 2). This difference is not tested statistically, because there can be no doubt that the two halves of the island are different. The point being made here is that the difference is small. Similar results (not shown) were obtained for altitude profiles. Unfortunately, the same type of comparison cannot be performed for habitat types, as these have not been mapped. However, the differences should be rela-tively small, as no obvious bias could be detected during
Table 2 Number of times each variable was included in the models after the backward stepwise procedures
Variables Number of models % of models
Slope 12 66.7 Habitat 12 66.7 Bank 7 38.9 Orient 7 38.9 Penguin 6 33.3 Altitude 5 27.8 Rocks 2 11.1
Table 3 Log-likelihood tests for the variables included in the final model Variables Change in)2 log likelihood df Significance of change Habitat 12.921 7 0.074 Bank 3.304 1 0.069 Slope 6.903 1 0.009
Table 4 Mean number of prion burrows per plot in different habitats Habitat Mean SE n Sorrel 16.9 2.7 33 Short grass 7.9 0.7 273 Long grass 5.7 0.8 159 Feldmark 4.2 0.6 172 Tussac 3.1 1.0 35 Heath 2.3 0.4 127 Bare soil 1.7 0.6 104 Ferns 0.8 0.5 15 Native grass 0.0 0.0 15 Gorse 0.0 0.0 1
Fig. 2 Distribution of slope frequencies in (top) the study plots, (middle) in a similar number of randomly assigned plots (placed using GIS) in New Island South and (bottom) with a similar random sample for New Island North
fieldwork. Besides, given the geomorphologic similarity between the north and the south, and the similar past and present land uses, no major differences should be expected. In fact, the general perception of those who know both properties is that prion abundance is similar on both sides. In conclusion, we feel confident about extrapolating from our samples to the rest of the island.
How many nest entrances in New Island?
The overall mean number of burrow entrances per 50-m2 plot was 5.26 (S.E.=0.31, n=934). Given that New Island South has an estimated suitable nesting surface (see above) of 10,333,000 m2, the total number of bur-row entrances can be estimated at 1,087,032. Assuming that the study plots are a representative sample, we can calculate the 95% confidence limits at 960,824 and 1,213,239 nest entrances. Note that although the number of prion nests in plots does not follow a normal distri-bution, with such a large sample size, the estimates of the mean are likely to do so (Central Limit Theorem; see also below), and therefore confidence limits can be cal-culated using standard procedures. It could be argued that because our plots are not truly independent sam-pling units, being grouped along transects, a more con-servative approach should be used. We addressed this by using the Tukey’s Jackknife Method (Sokal and Rohlf1981), where we calculated 32 pseudovalues of the mean by leaving 1 transect out in each turn. The dis-tribution of the resulting pseudovalues does not depart from a normal distribution (Kolmogorov-Smirnov test of goodness of fit; Z =0.87, P =0.44, n =32). The jackknifed estimate of the mean is 5.23, with a standard error of 0.63. Note that the jackknife standard error is approximately the same as the one calculated by applying the standard formula for the standard error of a ratio estimate (Cochran 1977; P. Rothery, personal communication). This gives an estimate of the number of burrow entrances for New Island South of 1,080,832, and with 815,233 and 1,346,431 as lower and upper 95% confidence limits. We use these more conservative esti-mates to extrapolate for the whole of New Island: number of burrow entrances=2,161,664 (Lower 95% C.L. 1,630,465; Upper 95% C.L. 2,692,862).
Discussion
Apart from the thin-billed prion, other Pachyptila spe-cies have occasionally been caught on New Island, and the fairy prion Pachyptila turtur nests elsewhere in the Falklands (Strange 1992, unpublished work). So the question might arise whether the burrow entrances we counted belonged to the study species. Although we cannot be certain that there were no misidentifications, it seems highly unlikely that more than an insignificant number of nests could belong to other species. Several years of study of prions on New Island have never
resulted in the confirmation of other species nesting, and even if some did, they would be expected to use different nesting sites (for example, amongst boulders and in rock crevices) as they do elsewhere (e.g. Strange 1992). Also, during this survey we inspected hundreds of prion car-casses found in Antarctic skua (Catharacta antarctica) territories, and could find no other prion (or other petrel) species. Other burrowing petrels nesting in New Island (white-chinned petrel, Procellaria aequinoctialis, and maybe sooty shearwater Puffinus griseus) have tiny (probably less than 100 pairs) populations, and their nests are easy to differentiate.
Slope was the physical variable with the greatest ex-planatory power for the variation in numbers of prion burrows. Higher densities on steep slopes have also been found in several other burrowing petrels (e.g. Schramm 1986; Brandt et al. 1995) and could be related to: (1) better drainage, and (2) easy take-off and landing at the burrow entrance, allowing improved predator escape. Antarctic skuas are important prion predators on New Island, as happens elsewhere in sub-Antarctic islands, and therefore could provide a selective force for habitat-selection decisions to evolve. Ease of take-off could also be the reason for the preference to nest in short, com-pared to long, grass but since the occurrence of these habitats also varies with slope and altitude, it is difficult to disentangle all these factors.
Nest-site availability can be an important factor limiting bird populations (Newton 1998), including burrow-nesting Procellariiformes (Ramos et al. 1997). On New Island, however, there is no evidence for a shortage of potential nesting sites for the thin-billed prion. These birds seem to have a large tolerance for diverse habitat features, and are found nesting in good numbers in a great variety of habitats and situations (see Genevois and Buffard 1994 for similar conclusions). Overall estimated density was only 0.21 entrances m)2 (compared to a maximum recorded of 1.42 entrances m)2) and the birds seem to successfully use all habitats that have large land coverage on New Island. Many apparently suitable nesting areas were not being used, including spots where much larger Magellanic penguins were finding enough soil to dig burrows. Unused areas were rather uniformly distributed all over the island, and did not seem to correlate in any way with the distribu-tion of known predators such as ship rats (Rattus rattus), cats (which are scarce), skuas or birds of prey. It is in-teresting to note that habitat suitability does not seem to have decreased in historical times, as habitats dominated by introduced grasses hold much higher densities of prions than native formations like tussac or other native grasses, ferns, feldmark and heather. However, tussac grass shelters introduced predators such as rats and cats, and it is possible that its suitability decreased as a result. In burrowing-petrel colonies, each burrow entrance does not necessarily correspond to one nest chamber (although this is often the case in the present species; Genevois and Buffard 1994) and one nesting pair. Sometimes, one entrance leads to two or more chambers
where eggs are laid, and on other occasions two or more burrow openings are linked to one single nest. Further-more, burrow occupancy rate can be variable in petrels, and sometimes is well under 100% (e.g. Berrow 2000). This can be partly a consequence of adult experienced birds refraining from breeding in certain years, a behaviour that can be frequent in thin-billed prions (Chastel et al. 1995). Our best estimate in relation to this issue comes from a sample of 100 nests (in long-grass habitat) that were dug in 2000/2001 and revealed an occupancy rate (percentage of nests where an egg was laid) of 97%. Re-occupancy rates of nests fitted with removable nest-chamber roofs in the year after study (and therefore after disturbance in the previous year) were lower, at 83% ( n =136; 36 other nests had been dug late in the previous season). However, all these estimates were obtained halfway through incubation, and there-fore do not account for any early egg loss. Entrances per nest were not quantified during these works, but an educated guess is that in New Island, on average, one burrow entrance corresponds to one breeding pair. Therefore, we estimate the thin-billed prion population in New Island to be around 2,000,000 breeding pairs. More work concerning occupancy and non-breeding rates in different habitats and early in the season is recommended.
Woods and Woods (1997) estimated the Falkland thin-billed prion population to be ‘‘between 50,000 and 100,000 pairs, perhaps more’’. Our work shows that their estimate must be wrong by at least an order of magnitude. The figure previously presented by Croxall et al. (1984), although still an underestimate, is much closer to the reality. Only more census work on other breeding colonies will allow the production of a robust estimate for the Falkland Archipelago.
Acknowledgements We thank Peter Rothery, Christophe Barbraud, Robert Furness and Stuart MacKay for helpful comments on the manuscript. Part of this study was supported by Fundac¸a˜o para a Cieˆncia e Tecnologia (FCT-Portugal) as a part of the Programa plurianual (UI&D 331/94), and P. Catry benefited from a post-doctoral fellowship from FCT (Praxis XXI BPD/16304/98). This study would not have been possible without the support of the New Island South Conservation Trust.
References
Berrow SD (2000) The use of acoustics to monitor burrow-nesting white-chinned petrels Procellaria aequinoctialis at Bird Island, South Georgia. Polar Biol 23:575–579
Bingham M (1998) The distribution, abundance and population trends of gentoo, rockhopper and king penguins in the Falkland Islands. Oryx 32:223–232
Brandt CA, Parrish J, Hodges, CN (1995) Predictive approaches to habitat quantification: dark-rumped petrels on Haleakala, Maui. Auk 112:571–579
Campos AR, Granadeiro JP (1999) Breeding biology of the white-faced storm-petrel on Selvagem Grande Island, North-East Atlantic. Waterbirds 22:199–206
Chastel O, Weimerskirch H, Jouventin P (1995) Body condition and seabird reproductive performance: a study of three petrel species. Ecology 76:2240–2246
Cliff AD, Ord JK (1998) Spatial autocorrelation. Pion, London Cochran WG (1977) Sampling techniques. Wiley, New York Croxall JP (1992) Southern Ocean environmental changes: effects
on seabird, seal and whale populations. Philos Trans R Soc Lond B 338:319–328
Croxall JP, McInnes N, Prince PA (1984) The status and conser-vation of seabirds at the Falkland Islands. In: Croxall JP, Evans PGH, Schreiber RW (eds) Status and conservation of the world’s seabirds. ICBP, Cambridge, pp 271–291
Davies TH, McAdam JH (1989) Wild flowers of the Falkland Is-lands. Bluntisham Books, Cambridge
ESRI (1999) ArcView GIS Help (v 3.2). Environmental Systems Research Institute, New York
Fielding AH, Bell JF (1997) A review of methods for the assess-ment of prediction errors in conservation presence/absence models. Environ Conserv 24:38–49
Genevois F, Buffard E (1994) Sites de nidification et caracte´ris-tiques des terriers chez deux espe´ces de pe´trels sympatriques aux Iles Kerguelen: le pe´trel bleu Holobaena caerulea et le prion de Belcher Pachyptila belcheri. Alauda 62:123–134
Hosmer DW Jr, Lemeshow S (1989) Applied logistic regression. Wiley, New York
Hoyo J del, Elliot A, Sargatal J (eds) (1992) Handbook of the birds of the world, vol I. Lynx Ediciones, Barcelona
Jouventin P (1994) Les populations d’oiseaux marins des TAAF: re´sume´ de 20 anne´es de recherche. Alauda 62:44–47
Maurer BA (1994) Geographical Population Analysis: tools for the analysis of biodiversity. Blackwell Science, Oxford
Monaghan P (1996) Relevance of the behaviour of seabirds to the conservation of marine environments. Oikos 77:227–237 Montevecchi WA (1993) Birds as indicators of change in marine
prey stocks. In: Furness RW, Greenwood JJD (eds) Birds as monitors of environmental change. Chapman & Hall, London, pp 217–226
Moore DM (1968) The vascular flora of the Falkland Islands. British Antarctic Survey Scientific Reports no. 60
Newton I (1998) Population limitation in birds. Academic Press, San Diego
Pannatier Y (1996) VARIOWIN: Software for Spatial Data Analysis in 2D. Springer, Berlin Heidelberg New York Ramos JA, Monteiro LR, Sola E, Moniz Z (1997) Characteristics
and competition for nest cavities in burrowing Procellariifor-mes. Condor 99:634–641
Schramm M (1986) Burrow densities and nest site preferences of petrels (Procellariidae) at the Prince Edward Islands. Polar Biol 6:63–70
Shriner SA, Simons TR, Farnsworth, GL (2002) A GIS-based habitat model for wood thrush, Hylocichla mustelina, in Great Smoky Mountains National Park. In: Scott JM, Morrison ML, Heglund PJ (eds) Predicting species occurrences: issues of ac-curacy and scale. Island Press, Covelo, Calif.
Sokal RR, Rohlf FJ (1981) Biometry, 2nd edn. Freeman, New York Stenhouse IJ, Robertson GJ, Montevecchi WA (2000) Herring gull Larus argentatuspredation on Leach’s storm-petrels Oceano-droma leucorhoa breeding on Great Island, Newfoundland. Atlantic Seabirds 2:35–44
Strange IJ (1980) The thin-billed prion, Pachyptila belcheri, at New Island, Falkland Islands. Gerfaut 70:411–445
Strange IJ (1992) A field guide to the wildlife of the Falkland Is-lands and South Georgia. HarperCollins, London
Swets KA (1988) Measuring the accuracy of diagnostic systems. Science 240:1285–1293
Thompson KR, Rothery P (1991) A census of the black-browed albatross Diomedea melanophrys population on Steeple Jason Island, Falkland Islands. Biol Conserv 56:39–48
Villard M, Maurer BA (1996) Geostatistics as a tool for examin-ing hypothesized declines in migratory songbirds. Ecology 77:59–68
Warham J (1990) The petrels. Their ecology and breeding systems. Academic Press, San Diego
Woods RW, Woods A (1997) Atlas of breeding birds of the Falkland Islands. Nelson, Oswestry