Cátia Sofia Alves Gouveia
Predicting the impacts of climate change on
the distribution and conservation of
ii
Predicting the impacts of climate change on the distribution and
conservation of endemic forest land snails of Madeira Island
Dissertation supervised by Pedro Cardoso, PhD
Finnish Museum of Natural History, University of Helsinki
Robert A. D. Cameron, PhD The University of Sheffield
iii
ACKNOWLEDGEMENTS
First of all, I would like to thank my supervisors Pedro Cardoso and Robert A. D. Cameron, for the supervision and support given in the development of this work. I am extremely grateful for the opportunity to be under their guidance, for all their inspiration and scientific support during the different stages of this work. I am convinced that my future as a researcher will be greatly influenced by their experience and knowledge. I would also like to thank Dinarte Teixeira, for all the support given since the draft of the first ideas of this project and for sharing his knowledge and enthusiasm about modeling, land snails and conservation. His commitment to this work and valuable contributions were crucial during the entire project.
I am also extremely grateful to Direção Regional do Ordenamento do Território e Ambiente, for their support and access to the BIOBASE, and also for providing digital cartography and geographic information.
A special thank to the Centre for Climate Change Impacts Adaptation & Modeling, who kindly provided future climate scenarios, modelled under the CLIMAAT II project (Climate and Meteorology of the Atlantic Islands (Azores, Madeira and Canary Islands)). I owe a special debt of appreciation to the Natural History Museum of London, for allowing the examination of molluscan collection from Madeira Island.
iv
Predicting the impacts of climate change on the distribution and
conservation of endemic forest land snails of Madeira Island
ABSTRACT
Climate change is emerging as one of the major threats to natural communities of the world’s ecosystems; and biodiversity hotspots, such as Madeira Island, might face a challenging future in the conservation of endangered land snails’ species. With this thesis, progresses have been made in order to properly understand the impact of climate on these vulnerable taxa; and species distribution models coupled with GIS and climate change scenarios have become crucial to understand the relations between species distribution and environmental conditions, identifying threats and determining biodiversity vulnerability.
With the use of MaxEnt, important changes in the species suitable areas were obtained. Laurel forest species, highly dependent on precipitation and relative humidity, may face major losses on their future suitable areas, leading to the possible extinction of several endangered species, such as Leiostyla heterodon.
v
Avaliação dos impactos das alterações climáticas na distribuição e
conservação dos moluscos terrestres endémicos da floresta
da Ilha da Madeira
RESUMO
As alterações climáticas têm sido referenciadas como uma das maiores ameaças às comunidades naturais dos ecossistemas mundiais; sendo que hotspots de biodiversidade, como é o exemplo a ilha da Madeira, poderão enfrentar importantes desafios futuros na conservação de espécies ameaçadas de moluscos terrestres. Esta tese pretendeu fornecer algumas pistas para o conhecimento do impacto das alterações climáticas nestes taxa
vulneráveis. Nesse sentido, os modelos preditivos da distribuição de espécies, acoplados com os SIG e cenários climáticos futuros tornam-se cruciais para compreensão das relações entre a distribuição das espécies e as variáveis ambientais, auxiliando a identificação de ameaças à biodiversidade.
O uso do MaxEnt permitiu identificar importantes alterações nas futuras áreas para distribuição das diferentes espécies. Os moluscos terrestres endémicos da floresta Laurissilva, altamente dependentes da precipitação e humidade relativa, enfrentarão perdas significativas nas áreas potenciais à sua distribuição, as quais poderão, inclusivamente, conduzir à extinção de espécies ameaçadas, como é o caso da Leiostyla heterodon.
vi
KEYWORDS
Climate change Predictive models Land snails MaxEnt
Geographic Information Systems Madeira Island
PALAVRAS-CHAVE
Alterações climáticas Modelos preditivos Moluscos terrestres MaxEnt
vii
ACRONYMS
ASCII: American Standard Code for Information Interchange AUC: Area under the receiver-operator curve
BIOBASE: Madeira’s Biodiversity Database
CIELO: Clima Insular à Escala Local (Insular Climate at Local Scale) CLIMAAT: Clima e Meteorologia dos Arquipélagos Atlânticos
COSRAM: Carta de Ocupação de Solos da Região Autónoma da Madeira (Land Cover Map of the Autonomous Region of Madeira)
CR: Critically Endangered CSV: Comma-separated values DD: Data deficient
DPAEME: Departamento de Producción de la Agencia Estatal de Meteorología de España
EN: Endangered
ESRI: Environmental Systems Research Institute
EUSHD: European Union Species and Habitats Directive EX: Extinct
GCM: Global Circulation Models GIS: Geographic Information System HadCM3: Hadley Center Coupled Model
IMP: Instituto de Meteorologia de Portugal (currently IPMA: Instituto Português do Mar e da Atmosfera)
IPCC: Intergovernmental Panel on Climate Change IUCN: International Union for Conservation of Nature LC: Least Concern
MaxEnt: Maximum Entropy Modeling
Max SSS: Maximizing the sum of sensitivity and specificity NT: Near Threatened
ROC: Receiver operating characteristic SAC: Special Areas of Conservation SDM: Species distribution models SPA: Special Protection Areas
viii
TSS: True Skill statisticix
GENERAL INDEX
ACKNOWLEDGEMENTS ... iii
RESUMO ... iv
ABSTRACT ... v
PALAVRAS-CHAVE ... vi
KEYWORDS ... vi
ACRONYMS ... vii
INDEX OF TABLES ... xii
INDEX OF FIGURES ... xiii
1. INTRODUCTION ... 1
1.1. Global warming ... 1
1.2. Biodiversity shifts and loss in a changing world ... 2
1.3. Adapting protected areas ... 2
1.4. Species distribution models as a conservation tool ... 3
1.5. Oceanic islands under pressure ... 4
1.6. Madeira geology and climate ... 5
1.7. Madeiran biodiversity ... 6
1.8. The Madeiran land snail fauna ... 7
1.9. The conservation of Madeiran snails... 8
1.10 Main objectives ... 10
2. MATERIALS AND METHODS ... 11
2.1. Study area ... 11
2.2. Preliminary data compilation ... 12
2.3. Sampling ... 12
2.4. Climate data and scenarios ... 13
2.5. Habitat data and future changes ... 14
2.6. Species distribution modelling under climate change only ... 15
2.7. Habitat distribution modelling ... 17
2.8. Species distribution modelling under climate and habitat change ... 17
2.9. Post-modelling processing ... 18
2.10. Changes in biodiversity descriptors ... 18
3. RESULTS ... 21
3.1. Sampling data ... 21
x
3.3.1. Craspedopomatidae ... 23
3.3.2. Lauriidae ... 28
3.3.3. Clausiliidae... 42
3.3.4. Vitrinidae ... 44
3.3.5. Hygromiidae... 48
3.4. Overall patterns of change ... 56
3.5. Net change versus turnover ... 63
3.6. Changes in community composition ... 65
4. DISCUSSION ... 72
4.1. The Madeiran land mollusc fauna at present ... 72
4.2. Limitations to the effectiveness of the modelling process ... 72
4.3. Model outputs and projected distributions ... 73
4.4. Changes in community composition ... 76
4.5. From predicted models to conservation ... 77
4.6. Land snail conservation ... 78
4.7. Conservation planning under climate change ... 84
5. CONCLUSION ... 87
REFERENCES ... 89
ANNEXES... 112
Annex 1: List of target species and environmental data used in the model ... 112
Table 1:Land snails’ nomenclature, IUCN conservation status and population trends. ... 112
Table 2: Environmental variables used in the model ... 114
Annex 2: Scripts used to perform geoprocessing operations and Map algebra expressions to estimate community patterns ... 115
Figure 1: Python scripting for Clipping and Centroid definition ... 115
Figure 2: Python scripting for Centroids coordinates’ attributio ... 115
Figure 3: Python scripting for converting multiple ASCII to Raster ... 116
Figure 4: Python scripting to calculate the sum of the ten replicates for each species ... 116
Figure 5: Python scripting for reclassifying several Rasters ... 116
xi
Annex 3: Predictive distribution maps for habitat modelling ... 118
Figure 1: Predictive distribution maps for natural forest areas ... 118
Figure 2: Predictive distribution maps for natural shrub areas ... 118
Figure 3: Predictive distribution maps for natural herbaceous vegetation ... 119
Annex 4: Resume of MaxEnt results: AUC values and jacknife analysis ... 120
Table 1: Land snails’ species list, number of records of each species within Madeira Island, and AUC values obtained for training data, under both models ... 120
Table 2: Species list, number of occurrences (n), area under the curve (AUC) and contribution of each variable to the model in current scenario (climate change variables only) ... 122
xii
INDEX OF TABLES
Table 1: List of target species, IUCN conservation status, population trend and
occurrence within sampling stations ... 22
Table 2: Land snails species list, conservation status under the IUCN criteria and area (km2) where each species is predicted to have suitable climate for each scenario (climate change only, with no habitat change or dispersal limitation) ... 58
xiii
INDEX OF FIGURES
Figure 1: Map of the Madeira Island and Desertas, with Natura 2000 network and
Madeira Natural Park areas ... 11
Figure 2: Map of Protected Areas in Madeira Island ... 12
Figure 3: BIOBASE data distribution and sampling stations within the study area ... 13
Figure 4: Distribution of natural forest, natural shrub areas and natural herbaceous vegetation in Madeira Island, according to land use map COSRAM 2007 ... 15
Figure 5: Flowchart of modelling methodology ... 18
Figure 6: Matching/mismatching components between two periods. Adapted from Carvalho et al. (2012) ... 19
Figure 7 and 8: Relative importance of environmental variables in species’ distribution, for modelled scenarios ... 23
Figure 9: Predictive distribution maps for Craspedopoma mucronatum ... 24
Figure 10: Predictive distribution maps for Craspedopoma neritoides ... 25
Figure 11: Predictive distribution maps for Craspedopoma trochoideum. ... 26
Figure 12: Predictive distribution maps for Craspedopoma lyonnetianum ... 27
Figure 13: Predictive distribution maps for Lauria fanalensis ... 29
Figure 14: Predictive distribution maps for Leiostyla arborea. ... 30
Figure 15: Predictive distribution maps for Leiostyla colvillei. ... 31
Figure 16: Predictive distribution maps for Leiostyla heterodon ... 32
Figure 17: Predictive distribution maps for Leiostyla concinna ... 33
Figure 18: Predictive distribution maps for Leiostyla laurinea ... 34
Figure 19: Predictive distribution maps for Leiostyla cassida ... 35
Figure 20: Predictive distribution maps for Leiostyla falknerorum. ... 36
Figure 21: Predictive distribution maps for Leiostyla cheilogona ... 37
Figure 22: Predictive distribution maps for Leiostyla loweana ... 38
Figure 23: Predictive distribution maps for Leiostyla irrigua ... 39
Figure 24: Predictive distribution maps for Leiostyla sphinctostoma ... 40
Figure 25: Predictive distribution maps for Leiostyla vincta vincta ... 41
Figure 26: Predictive distribution maps for Leiostyla vincta watsoniana ... 42
Figure 27: Predictive distribution maps for Boettgeria crispa ... 43
Figure 28: Predictive distribution maps for Plutonia albopaliata ... 44
xiv
Figure 30: Predictive distribution maps for Plutonia marcida ... 46
Figure 31: Predictive distribution maps for Plutonia nitida ... 47
Figure 32: Predictive distribution maps for Plutonia ruivensis ... 48
Figure 33: Predictive distribution maps for Geomitra tiarella ... 49
Figure 34: Predictive distribution maps for Actinella actinophora... 50
Figure 35: Predictive distribution maps for Actinella arridens ... 51
Figure 36: Predictive distribution maps for Actinella fausta ... 52
Figure 37: Predictive distribution maps for Actinella armitageana ... 53
Figure 38: Predictive distribution maps for Leptaxis furva ... 54
Figure 39: Predictive distribution maps for Leptaxis membranacea ... 55
Figure 40: Number of species predicted to gain or lose suitable habitat under A2 and B2 scenarios, categorized by the percentage of range reduction/expansion relatively to present. ... 62
Figure 41: Environmental barriers that might limit land snails dispersion ... 63
Figure 42: Changes in area (number of grids cells) between present and future (A2 and B2 scenarios, and periods 2040-69 and 2070-99) ... 64
Figure 43: Estimated distribution of land snails’ species richness (Alpha-diversity) ... 66
Figure 44: Geographical distribution of Alpha-diversity differences among the analysed periods ... 67
Figure 45: Geographical distribution of Total Beta-diversity among the analysed periods ... 68
Figure 46: Geographical distribution of Beta diversity due to Species replacement among the analysed periods ... 69
1
1.
INTRODUCTION
1.1. Global warming
Global climate is constantly changing, and such changes have impacts on the fauna and flora at all scales. Some particular events, for example the glacial periods of the Pleistocene, have had drastic effects on biodiversity in some parts of the world. In recent times, however, human activities have played an increasingly important role in determining the direction and speed of climate and biodiversity change. The documented increase in anthropogenic greenhouse gas emissions has been causing widespread changes in temperatures since the mid-20th century and its continued increase will accelerate global warming and induce many changes in the global climate system. Current models suggest that even if greenhouse gas concentrations remain stable in the future, warming will continue for several decades, due to the time scales related to climate processes, feedbacks and slow response of the oceans (IPCC, 2007a).
In recent decades, improvements in computational capacity and measuring technology have enabled the creation of sophisticated models of climate change allowing for varying scenarios and assumptions. According to the Intergovernmental Panel on Climate Change (IPCC, 2007a), the best estimate projection for the low emissions scenario applied to the climate system (B1) suggests a global average temperature increase of 1.8 ºC (range from 1.1 ºC to 2.9 ºC), while the best estimation for the high emissions scenario (A1FI) points to 4.0 °C (range from 2.4 °C to 6.4 °C), by 2100.
These models also confirm that other climatic changes already observed will accelerate. These include the unprecedented extensive melting surface of glaciers, changes in wind patterns and precipitation, in sea levels and salinity, and in the increased frequency and intensity of extreme climatic events, including droughts, heat waves, intense rainfall, and cyclones.
2
1.2. Biodiversity shifts and loss in a changing world
Climate change is emerging as one of the major threats to natural communities of the world’s ecosystems. Mid-range climate change scenarios projected for the next decades (IPCC, 2007a) will create new challenges for biodiversity conservation (IPCC, 2007b; Heller and Zavaleta, 2009), and might increase recent human-caused extinction rates (McLaughlin et al., 2002; Thomas et al., 2004; Malcolm et al., 2006; Pounds et al., 2006). Already, changes in climate have provoked responses at all levels from individuals and species through to changes in community structure and composition. There have been numerous shifts in the distribution and abundance of species (Benning et al., 2002; Peterson et al., 2002; Parmesan and Yohe, 2003; Root et al., 2003; Thomas et al., 2004; Loarie et al., 2008), with consequent community fragmentation and species-level extinction (Parmesan, 2006; Ponce-Reyes et al., 2012; Sax et al., 2013). Phenological changes observed in several populations, such as earlier breeding and migration shifts, are disrupting species interactions (Walther et al., 2002; Cotton, 2003; Crick, 2004; Both and Marvelde, 2007), promoting ecosystem instability.
The IPCC report (2007a, 2007b) makes it clear that the changes in climate are very distinctive across the world. In tropical areas, many species may be forced to move to higher elevations, reducing their distribution range and population size (Peh, 2007; Seimon et al., 2007; Chen et al., 2009, 2011; Velásquez-Tibatá et al., 2013), and the magnitude of the predicted changes suggest that this will induce the loss of numerous species in fragile habitats (Araújo et al., 2004).
1.3. Adapting protected areas
Natural reserves located in higher latitudes and altitudes, coastal and oceanic islands, and protected areas surrounded by unsuitable anthropogenic habitats are at high risk just because there is no scope for the habitats and the species they contain to move in response to changes in the climate system (Shafer, 1999; Sala et al., 2000).
Biodiversity hotspots, with high densities of endemic species which have small range sizes may be particularly vulnerable to climate change (Raxworthy et al., 2008). With the species’ shift due to their adaptation to new environmental variables, existing natural reserves and protected areas will no longer accommodate all designated species (Araújo
et al., 2004, 2011; Lemieux and Scott, 2005; Thuiller et al., 2006; Heller and Zavaleta,
3
protection strategies (Hannah et al., 2002). These require a widening of the temporal and spatial perspective in which such strategies are conceived. Climate change scenarios must be factored into such plans (Peters and Darling, 1985; Ferrier and Guisan, 2006; Rounsevell et al., 2006), and require, in addition, the better understanding of species responses to climate change (physiological, behavioural and demographic) (Peters and Darling, 1985; Thomas et al., 2004; Sekercioglu et al., 2007). The creation of buffer zones to increase connectivity among protected areas and to provide space for adaptive shift (Shafer, 1999; Hughes et al., 2003; Chambers et al., 2005; Millar et al., 2007) is one of the main recommendations for climate change adaptation strategies for biodiversity. This in turn requires increased coordination among all stakeholders in the region (Araújo
et al., 2004; Heller and Zavaleta, 2009).
1.4. Species distribution models as a conservation tool
The effective conservation of biodiversity depends on a very specific set of skills related to analysis of the distribution of species (Araújo and Williams, 2000), and the identification and understanding of the underlying causes of their trends (Teixeira, 2009). In this context, predictive models of species distribution coupled with the use of GIS and climate change scenarios have become crucial to identify threats, and to inform actions to limit loss (Dangermond and Artz, 2010). They have been developed and debated by many workers (e.g. Peters and Darling , 1985; Mulholland et al., 1997; Huang et al. 1998; Chornesky et al., 2005; Da Fonseca et al., 2005; Guisan and Thuiller, 2005; Brown, 2006; Ferrier and Guisan, 2006; Rounsevell et al., 2006; Elith and Leathwick, 2009; Heller and Zavaleta, 2009).
4
Because large presence/absence data sets are frequently unavailable and unreliable (Corsi
et al., 2000; Elith, 2000; Guisan and Zimmerman, 2000; Scott et al., 2002), a number of
recent analyses have used presence-only data (e.g. museum collections; Elith et al., 2011), producing large extent and fine-resolution maps that summarize many of the interactions between species and environment (Bellamy et al., 2013). One of the most popular techniques and best predictive tools (Elith et al., 2006) for modelling species, based on presence-only data, is the algorithm of maximum entropy, available at MaxEnt software (Phillips et al., 2006; Phillips and Dudik, 2008). Launched in 2004, this software has been widely used by a broad panel of researchers, enabling the establishment of correlations between the occurrence of species, mapping and predicting their future distributions under hypothetical climate scenarios (Phillips et al., 2006; Kharouba et al., 2009; Williams et al., 2009; Yates et al., 2010).
There are some difficulties associated with this approach (Webster et al., 2002), and several authors claim that these models generally ignore inter-specific interactions (Davis
et al., 1998; Pearson and Dawson, 2003; Araújo and Luoto, 2007); do not consider
long-term population viability (Keith et al., 2008); use global circulation models to predict future climate conditions (Thuiller, 2004; Pearson et al., 2006; Beaumont et al., 2008) and often demonstrate residual spatial autocorrelation in data, sampling bias and inadequate testing with independent data (Phillips et al. 2009; Veloz, 2009; Merckx et al., 2011).
Nevertheless, these models are able to make reasonable predictions about the consequences of climate change (Araújo et al., 2005a; Huntley et al., 2008), and they can be used with very simple location data. They can be applied to large numbers of species in the same region. They can therefore be applied to assess potential changes in regions where data are not extensive but environments are diverse. They form the basis of the analytical procedures used in this study.
1.5. Oceanic islands under pressure
5
2001; Gillespie et al., 2008). Many extinctions have already occurred on such islands as a result of land use changes and the introduction of predators and competitors (Reid and Miller, 1989; Sadler, 1999; Sala et al., 2000; Duncan and Blackburn, 2007; Butchart et al., 2010; Cardoso et al., 2010).
1.6. Madeira geology and climate
Madeira is typical of an oceanic island with unique biodiversity under increasing pressure. Together with other Macaronesian archipelagos (Canaries, Selvagens, Azores), it is placed in the Mediterranean Basin biogeographical region, itself defined as a biodiversity hotspot with many endemic species (Médail and Quézel, 1999; Myers et al., 2000; Mittermeier et al., 2005). Even within this rich area, the Macaronesian archipelagos are notable for the high levels of endemism associated with their oceanic origin.
The Madeiran archipelago lies in the Atlantic Ocean about 1000 km from mainland Portugal, and about 500 km from the African coast. There are three major groups of islands, Madeira itself, Porto Santo, and the Desertas, with a combined land area of c. 740 km2. It formed over an ocean floor “hotspot”, with several episodes of violent volcanic activity starting 10-15 million years ago (Geldmacher et al., 2000; Prada and Serralheiro, 2000). With a geological age of about 5.2 million years (Geldmacher et al., 2000), Madeira island is 40 km from the older island of Porto Santo (and its offshore islets), separated by deep ocean. The Desertas Islands are closer to Madeira, and are linked to it by a shallow submarine ridge.
The same hotspot that originated the archipelago was also responsible for the creation of what are now seamounts between Portugal and Madeira (Fernández-Palacios et al., 2011). These were once islands or archipelagos, and provided the opportunity for a stepping stone pattern of colonisation over shorter distances than those now separating Madeira from the mainland.
6
According to the Climate Atlas of the Archipelagos of the Canary Islands, Madeira and the Azores (IMP and DPAEME, 2011), Madeira’s archipelago has a mild oceanic climate both in winter and summer. Lying in the subtropical region, the climate is influenced by winds from NE and the Canary Islands current, resulting in two major climate types, Temperate and Mediterranean (Capelo et al., 2004, 2007). The complex topography and high altitude of the peaks create many differing microclimatic regimes. Cliffs and ravines provide extremes of exposure to sunlight. The average annual temperature ranges from 8 ºC in the highest peaks, and 18-19 ºC in lower altitudes. Precipitation occurs throughout the year and the average annual accumulated precipitation is greatest at higher altitudes (up to 3400 mm) and minimal in Funchal and on the low eastern peninsula of Ponta de São Lourenço (less than 600 mm) (Santos and Aguiar, 2006). Precipitation is more seasonal on the south coast, with drier summers reflecting the prevalence of northerly winds and the orographic effect of the high mountains in the interior (Santos and Aguiar, 2006). It is here that the climate approaches that of the Mediterranean.
Regional models of climate change, customized to Madeira Island (Azevedo, 1996), indicate a decrease in precipitation of between 5% and 30% throughout the island by the period 2040-2069, and reduction between 20% and 40% by the end of the century. Regions at higher altitude will be most affected by rainfall reduction (Cruz et al., 2009; Figueira et al., 2013). As expected at a global scale (IPCC, 2007a), local climate scenarios also suggest that the average annual temperature will increase by the end of the century. While the low emission scenario (B2) predicts a 1.4 ºC to 2.2 ºC rise, the high emission scenario (A2) forecasts a 2.2 ºC to 3.2 ºC increase in temperature (Santos and Aguiar, 2006).
1.7. Madeiran biodiversity
The Macaronesian biogeographical region, including Madeira, contains about 5000 species and subspecies of endemic terrestrial organisms, with Madeira and Selvagens archipelagos contributing 1419 taxa (1128 taxa from Madeira island) (Izquierdo et al., 2004; Arechavaleta et al., 2005; Borges et al., 2008). Many of these endemics are threatened, given their restricted distributions and the fragility of the habitat in which they occur.
7
large diversity of habitat types. Six climatophilous vegetation complexes and three edaphilous vegetation complexes have been identified (Capelo et al., 2004). The endemic flora of Madeira island (most notably the Laurel Forest, also known as Laurissilva) has a palaeoendemic origin, and consists of a surviving portion of the continental vegetation present in Europe in the late Tertiary, matched now only by an equivalent refuge in the Caucasus (Sjögren, 1972; Capelo et al. 2004). The largest area of pristine forest (
Clethro-Ocoteetum-foetentis), with approximately 16143 ha (47% of the total forest area;
SRARN, 2008), occurs in higher altitudes, particularly in the northern side of the island (Capelo et al., 2004). This area of Laurel forest (SPA/SAC Laurissilva da Madeira) and the higher central peaks of Madeira Island (SAC Maciço Montanhoso Central) are crucial centres of endemic diversity, including several species of endemic terrestrial snails. These areas are very vulnerable either to climate change as well as human disturbance.
1.8. The Madeiran land snail fauna
8
In addition, there are suites of species adapted to particular habitats. Within the Laurel forest, there is little sign of any geographical pattern, but many species are known only from a few localities. In the drier coastal areas, and particularly in the south, the fauna is different from that of the Laurel forest, more influenced by non-endemic species, and with a clear geographical differentiation (Cook et al., 1990; Cameron and Cook, 1992, 1997; Cook, 1996).
As in other islands, this fauna is very vulnerable to extinction; oceanic island land snails have the highest number of documented extinctions of any major taxonomic group (Van Bruggen, 1995; Lydeard et al., 2004). Like other invertebrates with low dispersal abilities, molluscs are, in many cases, the first to become extinct in response to habitat loss and disturbance, and this is often perceived as the major threat, although on some islands other than Madeira the activities of introduced predators are equally severe (Lydeard et al., 2004). Evidence from elsewhere shows that snails are particularly sensitive indicators of refugia in which favourable environments for wildlife have persisted for long periods (Moritz et al., 2001). Despite losses from earlier human activity, the endemic snail fauna of Madeira has survived better than those on many other oceanic islands (Cameron and Cook, 2001; Lydeard et al., 2004).
Nevertheless, the effects of habitat destruction on Madeira can be seen both in the fossil record spanning the first human colonisation of Madeira (Goodfriend et al., 1994) and in the disappearance of species from localities around Funchal known to 19th century observers (Wollaston, 1878; Seddon, 2008). In August 2010, much of the highest-altitude Laurissilva was devastated by fires. These have extended the effects of this destruction. Conservation policies have therefore concentrated on the protection of native habitats. Climate change can present an additional threat. The lack of information about the real impacts of climate changes on this group (neglected by IUCN assessments and the European Red List of Non-marine Molluscs (Cuttelod et al., 2011)), in addition to their exclusion from conservation efforts and biodiversity monitoring, presents a challenge for conservation planning.
1.9. The conservation of Madeiran snails
9
of plant and animal species at risk of extinction (Lamoreux et al., 2003; IUCN, 2013). With a number of objective criteria, the IUCN Red List was meant to be applicable to the majority of the described species, although this has been questioned (Cardoso et al., 2011). However, the quality of available information for invertebrates is generally lower than for vertebrates (IUCN, 2013), neglecting small species with restricted distribution and low dispersal abilities, which constitute the vast majority of the planet’s biota. In particular, data relating to the monitoring of population size and fluctuations is not usually available, and would, in most cases, be impossible to obtain within feasible costs. Therefore, the most threatened invertebrate species are commonly excluded from conservation efforts and biodiversity monitoring (Martín et al., 2010; Cardoso et al., 2011).
The conservation status of endemic Madeiran molluscs has not been evaluated, according to IUCN Red List guidelines, since 2011 (IUCN, 2013). The list includes assessments of 132 species of terrestrial land snails from the Madeiran archipelago, almost half being threatened (19 as Critically Endangered (CR), 11 as Endangered (EN), 27 as Vulnerable
(VU), 12 as Near Threatened (NT), as 54 Least Concern (LC), 7 as Data Deficient (DD) and 2 as Extinct (EX)), invariably with unknown population trends.
In general, the effects of future climate change are neglected in IUCN assessments, as the time-frame for IUCN assessments is usually of 10 years into the past or future while climate change projections are made up to 100 years. These are likely to be greatest where the ranges of species are smallest, and associated with habitats at the climatic limits in the region. Studies concerning the impacts of climate change on global biodiversity have increased in recent years, and the evidence suggests that the biological and ecological responses of a wide range of life forms are complex and require progressively more advanced tools in the creation of action plans and other conservation strategies (IPCC, 2007a). This information can be used to determine biodiversity vulnerability as a basis for prioritizing species and defining management strategies (Kareiva et al., 2008).
10
dominated by thin-shelled or small species suited to the cool, damp and often calcium-deficient environment within the forests (Sjögren, 1972; Cameron and Cook, 1997), and many are known from only a handful of sites.
1.10. Main objectives
The proposed study aims firstly to re-evaluate the conservation status and population trends of several mollusc species, assembling data from bibliographic research, expert consulting, in loco sampling and habitat suitability modelling.
In order to properly understand the impact of climate on these vulnerable taxa and provide preliminary data for future studies concerning the archipelago’s malacofauna, this thesis aims to conduct a preliminary analysis of the climatic tolerance of these species and their possible responses to future climatic change. This analysis will evaluate the predicted trends of various native species of terrestrial molluscs facing a changing climate scenario for Madeira Island.
In the present study we aim to:
1. Map the current distribution of selected Laurel forest land snail species and to evaluate their present conservation status;
2. Identify the potential distribution areas of the selected species using predictive models, and to compare them with known distributions, according to their habitat and niche preferences;
11
2.
MATERIALS AND METHODS
2.1. Study area
The Madeira archipelago is located in the Atlantic Ocean, approximately 1000 km from Sagres, on the Portuguese coast, and 500 km from Africa, between 32º24’ and 33º07’ north and 16º16’ and 17º16’ west. It is composed of three main groups of islands: Madeira, Porto Santo and the Desertas, occupying a total area of 740 km2 (Figure 1).
Figure 1: Map of the Madeira Island and Desertas, with Natura 2000 network and Madeira Natural Park areas.
On the island of Madeira itself, 75% of the island is subject to some degree of legal protection; and seven Special Areas of Conservation (SAC) and two Special Protection
Areas (SPA) are designated within the Natura 2000 framework (Figure 2). Protection of
threatened species and habitats is also provided for by European Union Species and
Habitats Directive (EUSHD) (together with the Birds Directive), which requires member
states to monitor and maintain favourable conservation status for listed species.
12
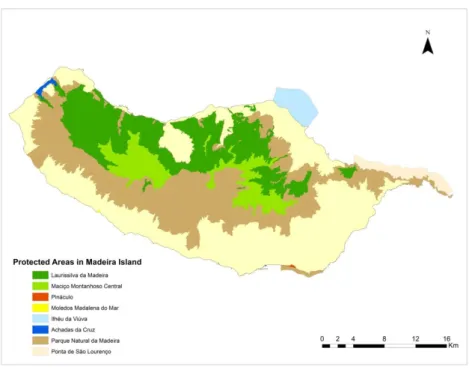
Figure 2: Map of Protected Areas in Madeira Island.
2.2. Preliminary data compilation
Thirty-six taxa of endemic snails are recorded exclusively in the target areas (Table 1, Annex 1). Their distribution data were collected from Madeira’s Biodiversity Database (BIOBASE), a powerful and updated database, designed to provide coherent information, validated and georeferenced, for managers and policy makers in the field of conservation and biodiversity. Species’ distribution records, referenced to the UTM grid of 500x500 m, were exported to an ESRI shapefile.
2.3. Sampling
Although Madeira´s Biodiversity Database (BIOBASE) comprises a significant fraction of information about the distribution of Madeira Island’s malacofauna, some areas have a very small amount of recorded data. In order to complement the information about the distribution and current conservation status of Madeira’s land snails, the first stage of this work comprised the identification and sampling of 15 sites in Laurel forest and alpine habitats.
13
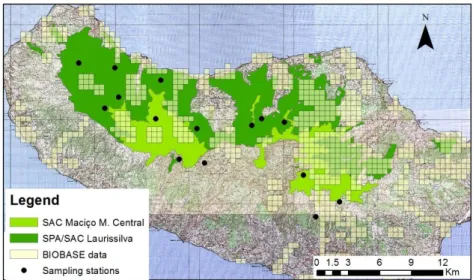
Figure 3: BIOBASE data distribution and sampling stations within the study area.
These stations stretched from near Porto Moniz, in the western part of the island, to central peaks in Maciço Montanhoso Central. Fieldwork was done between October and June, when the weather is more suitable (cool and moist), increasing the probability of detecting living animals. To evaluate the presence of the target species in the area, land snails and semi-slugs were surveyed on squares of 30x30m (one square for each station), by two people, for about one hour (Cameron and Cook, 1997).
Species identification was made based on external characters of the shell and follows the nomenclature of Bank et al. (2002).
2.4. Climate data and scenarios
Oceanic islands
often have limited meteorological information, and global circulation models (GCM), are not enough to understand the regional scale of the impact of climate change on biodiversity. To model species’ distributions under present and future climate, we used climate data produced within project CLIMAAT II (Santos and Aguiar, 2006), based on the regionalization of the global circulation Hadley Centre Coupled Model (HadCM3), using a simple thermodynamic model, CIELO (Portuguese acronym for “Insular Climate at Local Scale”; Azevedo, 1996; Miranda et al., 2006).14
(Cruz et al., 2008). CLIMAAT II data are currently available at a resolution of 1 km2 (Santos and Aguiar, 2006).
For each species, we considered the A2 and B2 emission scenarios. The A2 emission scenario describes a very heterogeneous world with continuously increasing global population and regionally oriented economic growth that is more fragmented and slower than in other storylines with a fourfold increase in CO2 levels with respect to their 1990 levels by the year 2100. The B2 scenario is based on a world in which the emphasis is on local solutions to economic, social, and environmental sustainability, with continuously increasing population (lower than A2) and intermediate economic development, assuming a doubling in CO2 emission by the year 2100 (IPCC, 2007a).
Ten bioclimatic/geographic variables were selected on a first step, in order to represent biologically meaningful measures for characterizing species distributions: annual mean, maximum and minimum temperature, precipitation, relative humidity and altimetry (Table 2, Annex 1).
Correlation between variables was analysed using ENM Tools (www.ENMTools.com; Warren et al., 2010). Annual maximum temperature, annual minimum precipitation and annual minimum relative humidity were the selected variables to run the model, for each period. These were thought a priori to be the limiting factors to the distribution of snails, highly vulnerable to high temperatures and low humidity levels and because these are thought to be the factors that will change to values outside their current ranges in the future. All other variables were highly correlated with these and were removed from the model (in all cases r > 0.67). All the environmental data were converted to 1000x1000m grid cells and then into ASCII files, with ArcGIS 10.0 geoprocessing tools.
2.5. Habitat data and future changes
Besides suitable climate, land snail distribution is influenced by many other variables. Although there is no clear information about niche requirements, target species ranges are clearly dependent on Laurel forest or alpine areas.
Future projections regarding land use changes are missing for Madeira archipelago. In order to add some information on habitat future changes, I have used data for three classes of vegetation: natural forest, natural shrub areas and natural herbaceous vegetation, from COSRAM 2007 (Figure 4).
15
(Table 2, Annex 1), considering that these non-climatic variables would remain constant until the end of the century.
Figure 4: Distribution of natural forest, natural shrub areas and natural herbaceous vegetation in Madeira Island, according to land use map COSRAM 2007.
2.6. Species distribution modelling under climate change only
To identify the species’ current potential distribution areas and predict changes in species distributions as a result of climate change only MaxEnt version 3.3.3k was used (see Phillips et al., 2004, 2006; available for free at http://www.cs.princeton.edu/ Schapire~/MaxEnt/). This machine learning method is based on maximum entropy algorithm for predicting species distribution models when only presence data are available (Elith et al., 2006).
16
MaxEnt requires point locality data. Species distribution information was converted into single geographical positions of the selected species’ distribution, by estimation of the centroid of each cell. To prevent points arising in the sea from this process, border grid cells were “clipped” to the Madeira Island coastline shapefile. These operations were performed with Python scripting language and a joint Arc ToolBox was created (Figure 1, Annex 2). Once the centroids were shaped, a second script and a toolbox were created in order to attribute coordinates to each point (Figure 2, Annex 2).
For each species, models were ran using the default settings which have been adjusted to perform well across a multiplicity of organisms and regions (Phillips and Dudik, 2008), except for the iterations set for 1000 (from a default of 5000).
To evaluate model performance, metrics of model fit are needed (Liu et al., 2011). Area under the receiver-operator curve (AUC) has been broadly used for model evaluation and is part of MaxEnt output (Elith et al., 2006). The receiver operating characteristic (ROC) analysis is based in a plot of “sensitivity” (how the data correctly predicts presence) and “1–specificity” (measure of correctly predicted absences; Fielding and Bell, 1997). To develop the ROC plot, 75% of the data were selected for training data and 25% were used for test data (Pearson et al., 2007). AUC is interpreted as the probability that a randomly chosen presence location is ranked higher than a randomly chosen background point (Merow et al., 2013), generating a single measure of model performance, providing information on the efficacy of the model (i.e., AUC: >0.9 = Very good; AUC: 0.7–0.9 = good, AUC: <0.7 = uninformative; Swets, 1988).
Modelling outputs were exported in ASCII file, as a continuous prediction of site suitability for each species, ranging from 0 to 1. Grid cells with values closer to 1 correspond to higher site suitability for species distribution (Phillips et al., 2006).
Although continuous site or habitat suitability maps express more information (Vaughan and Ormerod, 2005), binary output maps, using a probability threshold for conversion to presence/absence have been used in a wide range of studies such as biodiversity assessments, protected areas identification and climate change impact assessments (Lobo
17
According to recent studies on threshold selection with presence-only data (Liu et al., 2013), Max SSS (which is based on maximizing the sum of sensitivity and specificity) produces higher sensitivity in most cases and higher true skill statistic (TSS). This criterion was used in producing the binary maps.
2.7. Habitat distribution modelling
There are no estimates of climate change impacts on land use or vegetation for Madeira. To model the species’ current potential distribution areas and predict changes in species distributions as a result of both climate and habitat change, we first had to model the future distribution of the different habitat types, assuming that they currently occupy their entire historical climatic range (even if the spatial distribution is reduced in relation with the original). In order to understand and overview the major trends of these natural habitats as a result of climate change, we again used MaxEnt. Three classes of vegetation available in shapefile format were converted to equidistant points (500 m). Single geographical positions of vegetation classes were extracted and exported as CSV format. For each class, we ran the model using the default settings (10 replicates), except for the iterations (1000) and applying threshold rule Max SSS. The model outputs were processed according to the description in “Post-modelling processing” section (Annex 3, Figures 1-3), and then converted to ASCII files.
2.8. Species distribution modelling under climate and habitat change
A new analysis was made in order to evaluate changes in species distribution under both climate and habitat/vegetation type change scenarios. In addition to climate (annual maximum temperature, annual minimum precipitation and annual minimum relative humidity) and habitat (natural forest, natural shrub areas and natural herbaceous vegetation), geographical variables (latitude and longitude) were added to the model, so that the orography of the region with consequent barriers to dispersal were taken into account. In fact, complex orography was previously found critical for the distribution of snails (Teixeira, 2009) and other taxa such as beetles (Boieiro et al., 2013).
18
2.9. Post-modelling processingMaxEnt produced ten ASCII continuous maps (replicates), for each species in five modelled scenarios (current (1990), A2 and B2 for both 2040-2069 and 2070-2099), and for each of two models, with and without habitat change (Figure 5). Python scripts converted remaining single species datasets into Raster (Figure 3, Annex 2), and then into single binary maps, using theirMax SSS as threshold.
As particular thresholds are specific to single produced maps, single binary maps were created based in the assumption that where presence is indicated in at least 6 of the 10 replicates, the species was considered as present. On the other hand, if the species was present in 5 or less of the 10 replicates, it was considered as absent. This methodology was performed by scripts for each studied species (Figure 4 and Figure 5, Annex 2).
Figure 5: Flowchart of modelling methodology.
2.10. Changes in biodiversity descriptors
19
through the identification of the relative roles of species replacement and richness differences (beta diversity patterns), amongst different climatic scenarios and temporal periods.
Recently, some authors have introduced this framework in order to evaluate beta diversity as a result of climate change (Dortel et al., 2013).
In nature, processes driving community composition can be combined in an infinite number of ways, leading to complex patterns of community dissimilarity (Carvalho et al., 2013). Therefore, a means of decomposing measures of beta diversity into single fractions of replacement and richness differences is required. In the last years, several authors have discussed different ways of partitioning beta diversity (Koleff et al., 2003); however none of these studies provided a comprehensive and unified framework (Carvalho et al., 2013).
A novel approach to beta diversity partitioning was recently proposed (Carvalho et al., 2012, 2013). This framework is based on partitioning dissimilarity in terms of the Jaccard index (βcc) into two additive fractions dissimilarity due to species replacement, (β-3) plus dissimilarity due to richness differences (βrich):
As suggested by Carvalho et al. (2013), we followed the standard notation (Koleff et al., 2003), where a is the number of species present in both periods, b is the number of species exclusive to the first period and c is the number of species exclusive to the second period (Figure 6).
Figure 6: Matching/mismatching components between two periods: a is the number of species
present in both periods, b is the number of species exclusive to the first period and c is the number of species exclusive to the second period. Adapted from Carvalho et al. (2012).
20
total compositional differences between two periods in relation to the total number of recorded species, and it is expressed by the following function:
Species replacement is taken as the substitution of n species in one period to the same number of species in a second period. Consequently, the number of substitutions between two periods is given by the minimum number of exclusive species ( in relation to the total number of recorded species ( ), as suggested by the measure β-3 of Williams (1996), modified by Cardoso et al. (2009):
Species richness for each period is given by expressions and , in proportion to the total of number of species recorded ( ). The absolute difference between species richness of two periods is given by the following equation:
This new methodology characterizes species replacement and species loss (or gain) processes in an ecologically and mathematically significant approach (Carvalho et al., 2012).
21
3.
RESULTS
3.1. Sampling data
Twenty species of land snails and three semi-slugs were collected during the fieldwork. Twelve of these species were among those chosen for this study (Table 1).
ID Species IUCN
conservation status
Population
trend Sampling
1 Actinella actinophora Vulnerable unknown +
2 Actinella armitageana Vulnerable unknown +
3 Actinella arridens Critically Endangered unknown -
4 Actinella carinofausta Endangered unknown -
5 Actinella fausta Least Concern unknown -
6 Boettgeria crispa Near Threatened stable +
7 Caseolus calvus Endangered unknown -
8 Craspedopoma lyonnetianum Vulnerable unknown -
9 Craspedopoma mucronatum Least Concern stable +
10 Craspedopoma neritoides Least Concern unknown +
11 Craspedopoma trochoideum Least Concern stable +
12 Geomitra delphinuloides Critically Endangered unknown -
13 Geomitra tiarella Endangered unknown -
14 Hemilauria limnaeana Least Concern stable -
15 Lauria fanalensis Least Concern stable -
16 Leiostyla arborea Vulnerable unknown -
17 Leiostyla cassida Critically Endangered decreasing -
18 Leiostyla cassidula Critically Endangered unknown -
19 Leiostyla cheilogona Least Concern stable -
20 Leiostyla colvillei Vulnerable unknown -
21 Leiostyla concinna Endangered unknown -
22 Leiostyla falknerorum Endangered unknown -
23 Leiostyla heterodon Vulnerable unknown -
24 Leiostyla irrigua Least Concern stable -
25 Leiostyla laurinea Vulnerable unknown -
26 Leiostyla loweana Least Concern stable -
27 Leiostyla sphinctostoma Least Concern stable -
28 Leiostyla vincta vincta
Least Concern stable -
29 Leiostyla vincta watsoniana -
30 Leptaxis furva Vulnerable unknown +
31 Leptaxis membranacea Least Concern unknown +
22
33 Plutonia behnii Least Concern stable -
34 Plutonia marcida Least Concern stable +
35 Plutonia nitida Least Concern stable +
36 Plutonia ruivensis Least Concern stable +
Table 1: List of target species, IUCN conservation status, population trend and occurrence within sampling stations.
Twenty seven new records were added to the BIOBASE data. Specimens from Hygromiidae were the most frequent in sampled stations (4 species), followed by Craspedopomatidae and Vitrinidae, with 3 species each. Only one species of Clausiliidae was detected.
Fieldwork provided 19 new records for 11 of the target species. Sampling near Ribeira da Janela identified a new location for Boettgeria crispa, and new locations for
Craspedopoma trochoideum, Craspedopoma neritoides and Craspedopoma mucronatum
were identified in the surroundings of known areas. Leptaxis furva expanded its range to the western part of the island. Leptaxis membranacea, Plutonia marcida, Plutonia nitida
and Plutonia ruivensis were also found in sites near their known distribution.
3.2. Modelling land snails’ distribution under climate and habitat change scenarios
Two datasets were modelled for 31 endemic land snails: a) under current and future climate scenarios (A2 and B2 scenarios); and b) under current and future climate scenarios and changes in vegetation, further considering the current geographical boundaries. Actinella carinofausta, Caseolus calvus, Geomitra delphinuloides,
Hemilauria limnaeana and Leiostyla cassidula, were excluded from our analysis, due to
low number of records (n≤10), making any models most probably unreliable.
23
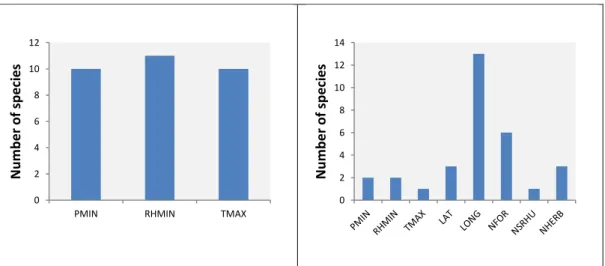
for most species (Figure 8). In this case, climatic variables seem to be less important than habitat and spatial variables.
Figure 7 and 8: Relative importance of environmental variables in species’ distribution, for
modelled scenarios (TMAX – maximum temperature; PMIN – minimum precipitation; RHMIN – minimum relative humidity; NFOR – natural forest; NSHRU – natural shrub; NHERB –
herbaceous vegetation; LAT - latitude; and LONG - longitude).
3.3. Changes in species ranges – future forecasted distributions under climate and habitat change
Important changes in distribution emerged for both scenarios (A2 and B2). Our model projects a multiplicity of potential responses to climate and habitat change, ranging from the loss of suitable areas to a significant increase in areas with appropriate climate conditions. The distribution of current and future suitable climate and vegetation for modelled species is shown ordered by family.
3.3.1.Craspedopomatidae
This is the only group of operculate snails in the Madeiran fauna. The family was present in Europe in the Tertiary, but is now restricted to a palaeoendemic distribution onthe archipelagos of Madeira, Azores and Canaries.
Craspedopoma mucronatum is the only widespread species of the genus in Madeira
Island. All the remaining species are range-restricted, often extremely localised. C.
mucronatum is found in habitats with high humidity, in damp wooded areas near the soil
and amongst mosses and on rocky ledges in ravines. Both climate and climate/habitat/geography models (hereafter full models) identified several potential areas
for C. mucronatum occurrence (Figure 9). According to the climate model, future
projections under both scenarios suggest a decrease in its distribution areas (< 25% of the 0 2 4 6 8 10 12
PMIN RHMIN TMAX
24
current modelled range in A2 scenario and < 5% in B2). The full model suggests that the distribution of Craspedopoma mucronatum is mainly influenced by the presence of forested areas, followed by geographic variables (longitude and latitude). Future projections under both scenarios suggest a decrease in suitable areas (from 10% in B2 up to 30% in A2).
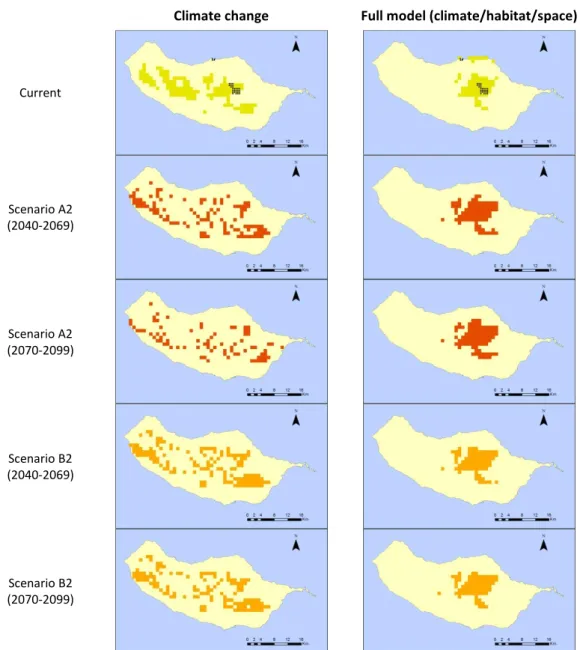
Climate change Full model (climate/habitat/space)
Current
Scenario A2 (2040-2069)
Scenario A2 (2070-2099)
Scenario B2 (2040-2069)
Scenario B2 (2070-2099)
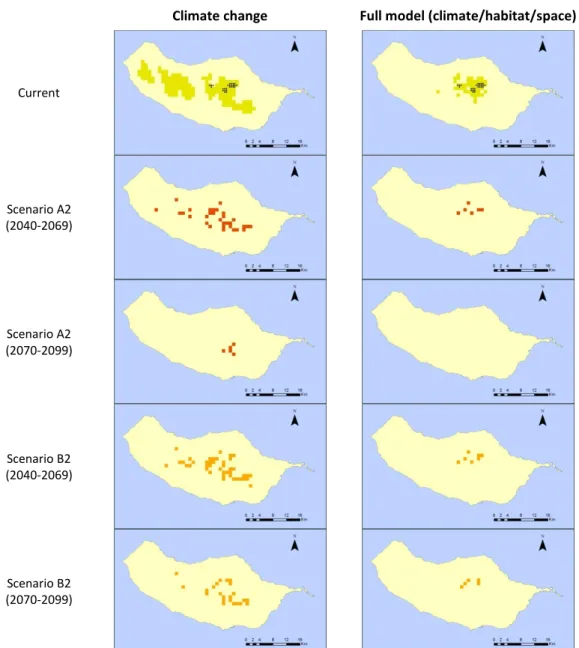
Figure 9: Predictive distribution maps for Craspedopoma mucronatum. On the first row, black points represent occurrence data, and green patches correspond to the predicted distribution in the present. Following rows present the modelled distribution of the species under future climatic
and habitat change scenarios (red for A2 and orange for B2).
With a similar distribution pattern, Craspedopoma neritoides and Craspedopoma
troichoideum occur from low to intermediate elevations, in the north side of the island.
25
and wet grass. Our climate model suggests wider potential areas for C. neritoides (Figure 10) and C. troichoideum (Figure 11), from intermediate elevations to the north coast. Influenced by temperature and relative humidity, both models suggest a clear positive tendency on suitable climate areas for C. neritoides (around 30%) and C. troichoideum
(higher than 100%).
Climate change Full model (climate/habitat/space)
Current
Scenario A2 (2040-2069)
Scenario A2 (2070-2099)
Scenario B2 (2040-2069)
Scenario B2 (2070-2099)
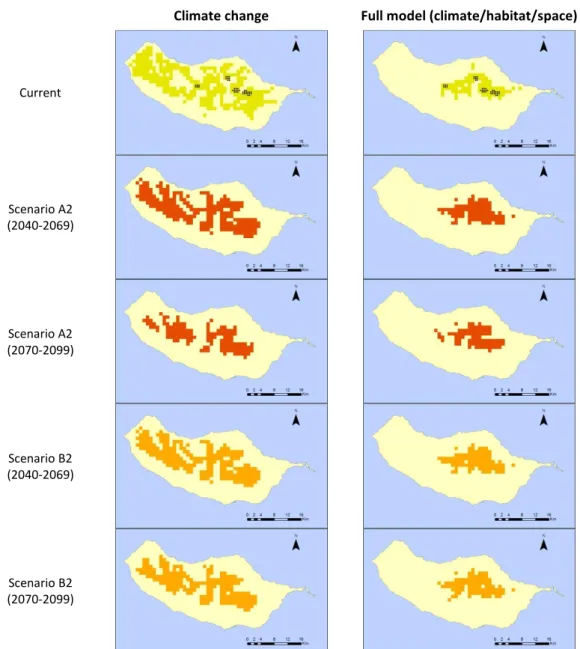
Figure 10: Predictive distribution maps for Craspedopomaneritoides. On the first row, black points represent occurrence data, and green patches correspond to the predicted distribution in the present. Following rows present the modelled distribution of the species under future climatic
and habitat change scenarios (red for A2 and orange for B2).
As a result of their association to Laurel forest, Craspedopoma neritoides and
Craspedopoma troichoideum range is highly influenced by the presence of forested areas,
26
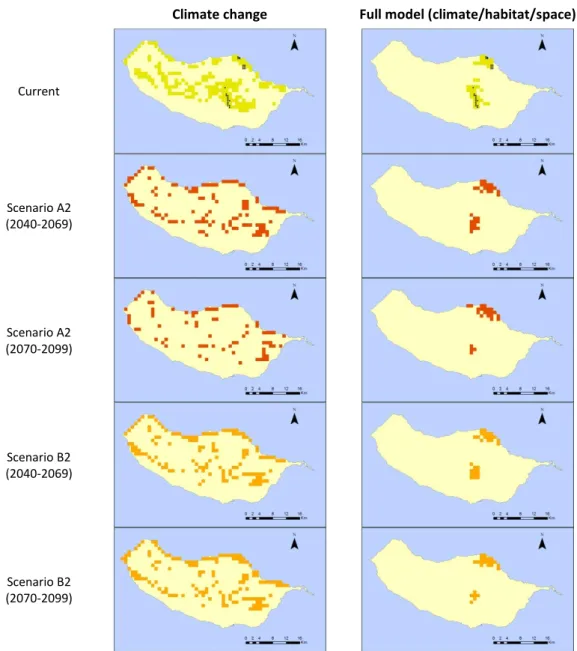
Although both species demonstrate similar habitat requirements and positive trends, the full model suggest different changes in suitable areas for C. neritoides (expansion up to 10% of the current distribution) and C.troichoideum (expansion between 70% (B2) and 90% (A2) from current suitable areas).
Climate change Full model (climate/habitat/space)
Current
Scenario A2 (2040-2069)
Scenario A2 (2070-2099)
Scenario B2 (2040-2069)
Scenario B2 (2070-2099)
Figure 11: Predictive distribution maps for Craspedopomatrochoideum. On the first row, black
points represent occurrence data, and green patches correspond to the predicted distribution in the present. Following rows present the modelled distribution of the species under future climatic
and habitat change scenarios (red for A2 and orange for B2).
Craspedopoma lyonetianum is mainly found in the Laurel forest in the central part of the
27
new potential distribution sites for C. lyonetianum,mainly in the central part of the island (Figure 12).
Climate change Full model (climate/habitat/space)
Current
Scenario A2 (2040-2069)
Scenario A2 (2070-2099)
Scenario B2 (2040-2069)
Scenario B2 (2070-2099)
Figure 12: Predictive distribution maps for Craspedopoma lyonnetianum. On the first row, black points represent occurrence data, and green patches correspond to the predicted distribution in the present. Following rows present the modelled distribution of the species under future climatic
and habitat change scenarios (red for A2 and orange for B2).
28
scenario, suggesting a slight decrease of suitable areas, both in A2 and B2 storylines, from 10 to 20%.
3.3.2.Lauriidae
On Madeira this family encloses Lauria, Hemilauria and Leiostyla, each genera with different distribution patterns and habitat requirements. Lauria fanalensis is found on ferns, moss and lichens at intermediate elevations within Laurel forest. According to the climate model, species’ distribution is highly influenced by relative humidity and precipitation; and further climatically suitable areas were identified (Figure 13). Both A2 and B2 scenarios suggest a reduction in future suitable area for L. fanalensis (nearly 30% in both scenarios). Our full model identified relative humidity, precipitation and latitude as the main variables that influence L. fanalensis occurrence. New suitable sites were identified in A2 and B2 scenarios, suggesting the potential expansion of species distribution (up to 50% in A2 scenario).
Twelve IUCN listed Leiostylaspecies’ occur in Laurel forest and summit areas. Leiostyla
arborea is an arboreal species living mainly on the trunk of Laurel trees and on mosses.
Mostly found at high elevations in the central area of Madeira, its distribution is very restricted. Climate modelling identified potential areas at intermediate and high elevation, mostly in the western and central part of the island (Figure 14). Future trends suggest a progressive reduction of suitable areas, especially alarming in the A2 scenario, with loss reaching up to 40%. As a result of its narrow distribution and in addition to precipitation, our full model identified longitude as the variable that contributes the most to L. arborea
29
Climate change Full model (climate/habitat/space)
Current
Scenario A2 (2040-2069)
Scenario A2 (2070-2099)
Scenario B2 (2040-2069)
Scenario B2 (2070-2099)
Figure 13: Predictive distribution maps for Lauria fanalensis. On the first row, black points
represent occurrence data, and green patches correspond to the predicted distribution in the present. Following rows present the modelled distribution of the species under future climatic
30
Climate change Full model (climate/habitat/space)
Current
Scenario A2 (2040-2069)
Scenario A2 (2070-2099)
Scenario B2 (2040-2069)
Scenario B2 (2070-2099)
Figure 14: Predictive distribution maps for Leiostyla arborea. On the first row, black points
represent occurrence data, and green patches correspond to the predicted distribution in the present. Following rows present the modelled distribution of the species under future climatic
and habitat change scenarios (red for A2 and orange for B2).
31
As a result of its restriction to high elevations, both species’ distribution is mainly influenced by the presence of native herbaceous areas, longitude and climate variables. Our full model suggests a considerable reduction on suitable habitat for L. colvillei (up to 90% in A2 scenario) and the possible extinction of L. heterodon, as a result of the decrease in suitable areas (100% in both scenarios).
Climate change Full model (climate/habitat/space)
Current
Scenario A2 (2040-2069)
Scenario A2 (2070-2099)
Scenario B2 (2040-2069)
Scenario B2 (2070-2099)
Figure 15: Predictive distribution maps for Leiostyla colvillei. On the first row, black points represent occurrence data, and green patches correspond to the predicted distribution in the present. Following rows present the modelled distribution of the species under future climatic
32
Climate change Full model (climate/habitat/space)
Current
Scenario A2 (2040-2069)
Scenario A2 (2070-2099)
Scenario B2 (2040-2069)
Scenario B2 (2070-2099)
Figure 16: Predictive distribution maps for Leiostyla heterodon. On the first row, black points
represent occurrence data, and green patches correspond to the predicted distribution in the present. Following rows present the modelled distribution of the species under future climatic
and habitat change scenarios (red for A2 and orange for B2).
Leiostyla concinna and Leiostyla laurinea are very rare and only known to occur in the
central summit areas of the island, near Pico do Areeiro and Ribeira de Santa Luzia. L.
concinna is normally associated with the soil, found amongst rock soil and leaf-litter on
33
Climate change Full model (climate/habitat/space)
Current
Scenario A2 (2040-2069)
Scenario A2 (2070-2099)
Scenario B2 (2040-2069)
Scenario B2 (2070-2099)
Figure 17: Predictive distribution maps for Leiostyla concinna. On the first row, black points
represent occurrence data, and green patches correspond to the predicted distribution in the present. Following rows present the modelled distribution of the species under future climatic
and habitat change scenarios (red for A2 and orange for B2).
According to future projections of climate only, suitable areas demonstrate a negative tendency, especially accentuated in the case of L. concinna (roughly less 95% of the current area, in A2 scenario). The presence of shrub areas, precipitation and longitude, in the case of L. concinna, and the presence of forested areas, longitude and latitude, in the case of L. laurinea, were the variables suggested by our full model to explain species distribution. New suitable areas were identified for both species, with a slight increase for
34
Climate change Full model (climate/habitat/space)
Current
Scenario A2 (2040-2069)
Scenario A2 (2070-2099)
Scenario B2 (2040-2069)
Scenario B2 (2070-2099)
Figure 18: Predictive distribution maps for Leiostyla laurinea. On the first row, black points
represent occurrence data, and green patches correspond to the predicted distribution in the present. Following rows present the modelled distribution of the species under future climatic
and habitat change scenarios (red for A2 and orange for B2).
Leiostyla cassida is mainly found at intermediate elevations and in the north coast. Both