Licenciada em Engenharia do Ambiente
Clearing the cloudy crystal balls:
Hybrid modelling for energy and climate change
mitigation scenarios
– A case study for Portugal –
Dissertação para obtenção do Grau de Doutor em Ambiente
Orientador: Maria Júlia Fonseca de Seixas,
Professora Auxiliar da Faculdade de Ciências e
Tecnologia da Universidade Nova de Lisboa
Co-orientador: Francisco Manuel Freire Cardoso Ferreira,
Professor Auxiliar da Faculdade de Ciências e
Tecnologia da Universidade Nova de Lisboa
Júri:
Presidente: Prof. Doutor José Paulo Barbosa Mota Arguentes: Prof. Doutor Brian P. Ó Gallachóir
Prof. Doutora Inês Margarida Lima de Azevedo Vogais: Prof. Doutor Miguel Pedro Brito St. Aubyn
Prof. Doutor Rui Jorge Fernandes Ferreira dos Santos
Prof. Doutora Maria Júlia Fonseca de Seixas
Clearing the cloudy crystal balls: Hybrid modelling for energy and climate change mitigation scenarios – A case study for Portugal
Copyright © Patrícia Alexandra Fortes da Silva, Faculdade de Ciências e Tecnologia e Universidade Nova de Lisboa A Faculdade de Ciências e Tecnologia e a Universidade Nova de Lisboa têm o direito, perpétuo e sem limites geográficos, de arquivar e publicar esta dissertação através de exemplares impressos reproduzidos em papel ou de forma digital, ou por qualquer outro meio conhecido ou que venha a ser inventado, e de a divulgar através de repositórios científicos e de admitir a sua cópia e distribuição com objectivos educacionais ou de investigação, não comerciais, desde que seja dado crédito ao autor e editor.
This work has been made possible by the financial support of the scholarship SFRH/BD/27549/2006 and the research project HybCO2
(PTDC/AAC-CLI/105164/2008) from the Portuguese Foundation for Science and Technology.
During this PhD ‘journey’ there have been many people who crossed my path and who have helped and encouraged me. This is my thank you to them all.
I would like to start to express my gratitude to Prof. Júlia Seixas, my supervisor, for her guidance, and unlimited support during this research. Always friendly and understanding, she has been a wonderful source of knowledge and encouragement.
Furthermore, I am grateful to Prof. Francisco Ferreira, my co-supervisor, for his invitation giving me the opportunity to start this PhD and for always having such as reassuring attitude. A special thanks goes to Prof. Denise van Regemorter, for having accompanied me with her co-supervision until the beginning of 2013 and for having introduced me to computable general equilibrium modelling. Part of this Ph.D. could not have been possible without her help and I hope the use of GEM-E3_PT always dignifies her memory.
I would like to thank Prof. David Mark and Stephen Connors who kindly received me at Massachusetts Institute of Technology (MIT) in the early beginning of my PhD, and to Prof. Mort Webster who challenged me to link TIMES_PT to an economic top-down model giving a new direction to my research. Even short, this visit was an enriching experience both in personal and professional terms.
I also would like to thank all the partners and consulters of HYBCO2 research project for the great collaboration. Department of Foresight and Planning and International Affairs (DPP) for the excellent work in developing socio-economic scenarios for Portugal, in particular António Alvarenga and Sofia Rodrigues my co-authors. Research Unit on Complexity and Economic (UECE/ISEG), principally Sara Proença for our fruitful discussions and for sharing with me the difficulties of building a hybrid model. Also Prof. Alfredo Marvão Pereira and Rui Pereira for their helpful advice, expertise and contribution to the development of HYBTEP.
In addition I am grateful to the TIMES community, whom directly or indirectly has helped me, especially Maurizio Gargiulo and Amit Kanudia who always answered my questions and helped me overcome modelling shortcomings.
Many warm thanks to my former and present colleagues at CENSE (FCT/UNL), for the good times at lunch breaks and for their friendship and support, in particular, Pedro for his permanent availability to listen and jolly me along; Joana for our relaxing and invigorating ‘girl talks’; Ana Cristina for always being so encouraging and positive; and of course my office mates with whom I shared the joys and frustrations of energy modelling. I am especially grateful to Sofia for her priceless advices and feedback on my research, for the motivation and for helping me grow as a researcher. Many thanks to Luís and João Pedro for always being so supportive and helpful about my work, and for all the suggestions and debates. I will not forget our passionate discussions, work
my questions. Thank you for sharing the happiness of my achievements and for cheer me up when things were difficult – doing a PhD without all of you would not be the same.
Last but far from least, I would like to thank my family and close friends for all their love and support. A special thanks goes to António, who encouraged me to embark on this ‘journey’ and for always being so optimistic and understanding – I promise, I will have more free time now. My son Miguel, who has born during this PhD and whose laugh and little hugs gave me the courage to continue in the frustrating moments. I am indebted to my brother Pedro, for always find a solution for my computing problems (and how a PhD with modelling can have a lot) and for always listening me – thank you for being such a great big brother. My most grateful thanks goes to my parents, for their infinite love and support throughout my life and for their huge help, especially in the overworking periods. This thesis is dedicated to them, in particular to my father, who always taught me that ‘knowledge is the greatest wealth that a man can have’.
Energy and greenhouse gas (GHG) emissions scenarios, generated by energy-economy-environment (E3) models, have been used to explore alternative futures and support energy and climate mitigation policy decisions. The uncertainty carried in these scenarios comes from inherent uncertainty of future conditions, reflected in the models input assumptions, and from the models intrinsic features (e.g. technology bottom-up vs. economic top-down models).
The present research aims to improve future scenarios generation for energy and climate policy analysis by advancing on E3 modelling, using the Portuguese energy system as the case study. Main objectives include: (i) the assessment on how uncertainty impacts climate-energy policy decisions, (ii) the integration of storylines with energy modelling, providing a coherent context to modelling assumptions; (iii) the development of an hybrid modelling platform, combining the strengths of bottom-up and top-down models.
Socio-economic driver was identified as a major assumption contributing to overall uncertainty on GHG emissions scenarios. Therefore, the socioeconomic storylines, built by stakeholders from different knowledge fields, were translated directly into energy modelling assumptions, which proved to increase the robustness of scenario development and its comprehensiveness.
Separate use of the bottom-up TIMES_PT and top-down GEM-E3_PT revealed different mitigation options, which have a significant impact on policy design (i.e., low-carbon technologies vs. end-use energy efficiency). In consequence, the hybrid-modelling platform (HYBTEP) was built through the soft-link between TIMES_PT and GEM-E3_PT, combining cost minimizing detailed energy technology choices with sector disaggregated macroeconomic responses, respectively.
The research also provides an empirical understanding of how to enable a low carbon transition for Portugal. According to TIMES_PT, it is technological feasible to reduce, in the long term (2050), the country’s energy-related GHG emissions up to 80% below 1990 emissions, being renewable power generation technologies a key for decarbonisation. However, HYBTEP outcomes suggest that, with a carbon tax in line to what is projected at EU-wide level, the country do not accomplish such mitigation target, reducing just 47% its GHG emissions, associated with loss of gross domestic product (GDP) of around 2% (according to revenue-recycling scheme assumed). On the opposite, a subsidy to renewable energy revealed long-term positive impacts at both environmental and economic level (i.e., emissions reduction by 31% and GDP gains above 2.8%). These results highlights the relevance of addressing the impacts to economy while considering the most cost-effective technologies over the development of low carbon scenarios, which is accomplish by HYBTEP modelling platform.
Cenários de energia e de emissões de gases com efeito estufa (GEE), elaborados através de modelos energia-economia-ambiente, têm vindo a ser utilizados para explorar futuros alternativos e apoiar decisões de política energética e climática. A incerteza associada a estes cenários resulta da incerteza das condições futuras, reflectida nos inputs de modelação, e das diferentes características dos modelos (tecnológicos bottom-up vs. económicos top-down).
A presente investigação pretende melhorar a elaboração de cenários utilizados na análise da política energia-clima, melhorando a modelação energia-economia-ambiente e utilizando o sistema energético Português como caso de estudo. Os seus principais objectivos incluem: (i) avaliação do impacto da incerteza na tomada de decisão das políticas climáticas/energéticas, (ii) integração de narrativas na modelação energética, proporcionando um contexto coerente para os pressupostos de modelação, (iii) desenvolvimento de uma plataforma de modelação hibrida, combinando as mais-valias dos modelos bottom-up e top-down.
A evolução socioeconómica foi identificada como o pressuposto que mais contribui para a incerteza geral nos cenários de emissão de GEE. Deste modo, foram construídas por stakedolders de diferentes áreas de conhecimento, narrativas referentes ao desenvolvimento socioeconómico, as quais foram traduzidas para os pressupostos de modelação, aumentando a robustez e a compreensão dos cenários.
A utilização do modelo bottom-up TIMES_PT e modelo top-down GEM-E3_PT separadamente revelou que os mesmos determinam diferentes opções de mitigação com impacte no desenho de políticas (i.e., tecnologias de baixo carbono vs. eficiência energética) Por conseguinte, foi desenvolvida da plataforma hibrida HYBTEP construída através de ligação dos modelos TIMES_PT e GEM-E3_PT, combinando respectivamente, escolhas tecnológicas detalhadas e associadas a uma minimização dos custos, com uma resposta macroeconómica sectorialmente desagregada.
Esta investigação apresenta também uma análise empírica relativa a uma transição de Portugal para uma economia de baixo carbono. De acordo com o TIMES_PT é tecnologicamente viável reduzir, no longo prazo (2050), as emissões de GEEE relacionadas com energia, até 80% abaixo das emissões de 1990, sendo as tecnologias renováveis de geração de electricidade um elemento chave para a descarbonização. Os resultados do HYBTEP sugerem contudo, que uma taxa de carbono em linha com o que é projectado a nível Europeu, não permite ao país atingir essa meta de mitigação, reduzindo apenas 47% as emissões de GEE associadas a uma redução do produto interno bruto (PIB) em cerca de 2% (de acordo com o sistema de reciclagem da receita considerado). Pelo contrário, um subsídio às energias renováveis revelou impactes positivos no longo prazo quer a nível ambiental, quer a nível económico (i.e., redução das emissões em cerca de 31% e ganhos no PIB acima de 2.8%).
Estes resultados ilustram a importância de determinar os impactos económicos considerando as tecnologias mais custo-eficazes no desenvolvimento de cenários de baixo carbono, o qual é possível através da utilização da plataforma de modelação HYBTEP.
Palavras-Chave:
mitigação das alterações climáticas, sistema energético, emissões de gases com efeito-estufa, narrativas, modelos energia-economia-ambiente, modelação hibrida.L
IST OFF
IGURES...
XVIIL
IST OFT
ABLES...
XIXA
BBREVIATIONS&
U
NITS...
XXIC
HAPTER1
|
I
NTRODUCTION... 1
1.1 The challenge of climate change mitigation ... 4
1.2 Sustainable energy system ... 8
1.3 Scenarios: a decision-support tool for energy and climate change ... 10
1.3.1 Qualitative and quantitative scenarios ... 12
1.3.2 Integrated assessment models ... 15
1.4 The Portuguese case study ... 20
1.5 Research questions and thesis outline ... 24
1.6 References ... 28
C
HAPTER2
|
A
SSESSING EFFECTS OF EXOGENOUS ASSUMPTIONS INGHG
EMISSIONS FORECASTS-
A
2020
SCENARIO STUDY FOR PORTUGAL USING THETIMES
MODEL... 35
2.1 Introduction ... 37
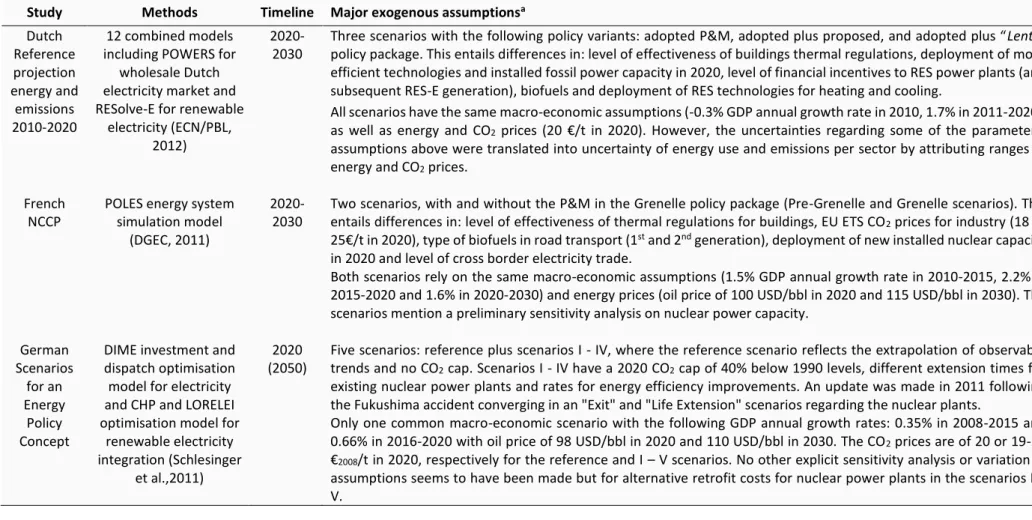
2.2 Overview of exogenous assumptions in GHG emission scenarios across Europe ... 40
2.3 Methods and model ... 45
2.3.1 EFF scenario - Penetration of end-use efficient equipment in the demand sectors .... 46
2.3.2 DEM scenario - Socio-economic scenarios and energy and materials demand projections for 2020 ... 47
2.3.3 Low RES-e scenario - Implementation of infrastructures and incentives for production of renewable electricity ... 48
2.3.4 LowH and HighH scenarios - Availability of hydro resources ... 49
2.3.5 100$/bbl scenario - Primary energy import prices ... 50
2.3.6 Summary of the studied scenarios ... 51
2.4 Results ... 52
2.5 Discussion ... 55
2.6 Conclusions ... 57
2.7 Appendix 2A – Overview of the TIMES_PT model ... 58
2.8 Appendix 2B – Energy services and materials demand assumptions in TIMES_PT ... 59
2.9 References ... 60
C
HAPTER3
|
L
OW CARBON ROADMAP FORP
ORTUGAL:
TECHNOLOGY ANALYSIS... 65
3.1 Introduction ... 67
3.2 Methods ... 68
3.2.1 TIMES_PT model ... 68
3.3 Scenarios Definition ... 70
3.4.1 GHG emissions ... 73
3.4.2 Electricity generation ... 76
3.4.3 Energy demand and technology choices in end-use sectors ... 77
3.4.4 Economic analysis ... 80
3.4.5 Energy demand reduction impacts ... 80
3.5 Conclusions ... 81
3.6 Appendix ... 82
3.7 References ... 83
C
HAPTER4
|
T
OP-
DOWN AND BOTTOM-
UP MODELLING TO SUPPORT LOW CARBON SCENARIOS:
CLIMATE POLICYI
MPLICATIONS... 85
4.1 Introduction ... 87
4.2 Modelling framework ... 89
4.2.1 The GEM-E3_PT model ... 89
4.2.2 The TIMES_PT model ... 90
4.2.3 Calibration methodology for a common baseline scenario ... 91
4.3 Low-carbon scenarios ... 93
4.4 Results ... 94
4.4.1 Baseline scenario ... 94
4.4.2 Low-carbon scenarios ... 94
4.5 Discussion of policy considerations ... 102
4.6 Conclusions ... 104
4.7 Appendix ... 106
4.8 References ... 107
C
HAPTER5
|
B
RIDGING THE GAP BETWEEN SOCIO-
ECONOMIC STORYLINES AND ENERGY MODELLING... 111
5.1 Introduction ... 113
5.2 Methodology ... 116
5.2.1 Participatory process to design socio-economic storylines ... 116
5.2.2 Energy Modelling ... 118
5.2.3 Linking socio-economic storylines to energy modelling ... 122
5.3 Results ... 127
5.3.1 Energy supply and import dependency ... 127
5.3.2 Power sector ... 129
5.3.3 Transport mobility ... 131
5.3.4 Final energy consumption and efficiency ... 132
5.3.5 GHG emissions ... 135
5.4 Discussion ... 136
5.5 Conclusions ... 138
5.6 Appendix ... 140
5.7 References ... 141
C
HAPTER6
|
I
NTEGRATED TECHNOLOGICAL-
ECONOMIC MODELLING PLATFORM FOR ENERGY AND CLIMATE POLICY ANALYSIS... 145
6.1 Introduction ... 147
6.2 Methodology ... 150
6.2.1 TIMES model ... 150
6.2.2 GEM-E3 model ... 151
6.2.3 HYBTEP soft-link methodology ... 153
6.3 Scenarios simulation ... 161
6.4.2 Impact on GHG emissions ... 169
6.4.3 Economic impacts ... 170
6.5 Concluding remarks ... 174
6.6 References ... 176
C
HAPTER7
|
C
ONCLUSIONS ANDF
URTHERD
EVELOPMENTS... 179
7.1 Answers to the methodological research questions ... 182
7.2 Insights for Portugal ... 189
7.3 Further developments ... 192
7.4 Appendix ... 194
Figure 1.1 | Emissions pathways and corresponding “likely” (66%) chance of staying in various
temperature limits. Black box around 2020 indicates the emissions levels consistent with the
current pledges. ... 6
Figure 1.2 | Global temperature change (mean) associated with the RCP scenarios ... 7
Figure 1.3 | Relation between Total Primary Energy Supply (TPES) per capita and Gross Value Added (GDP) per capita by Purchasing Power Parities. Values from 1971 to 2012 (2011 for China, India and Brazil). ... 8
Figure 1.4 | Schematic illustration of hybrid scenario formulations, from narrative storylines that explore diverse contexts to quantitative models that evaluate their plausibility and compliance . 14 Figure 1.5 | Dimensionalities of top-down, bottom-up and hybrid models ... 18
Figure 1.6 | Socio-economic and energy indicators evolution for Portugal ... 22
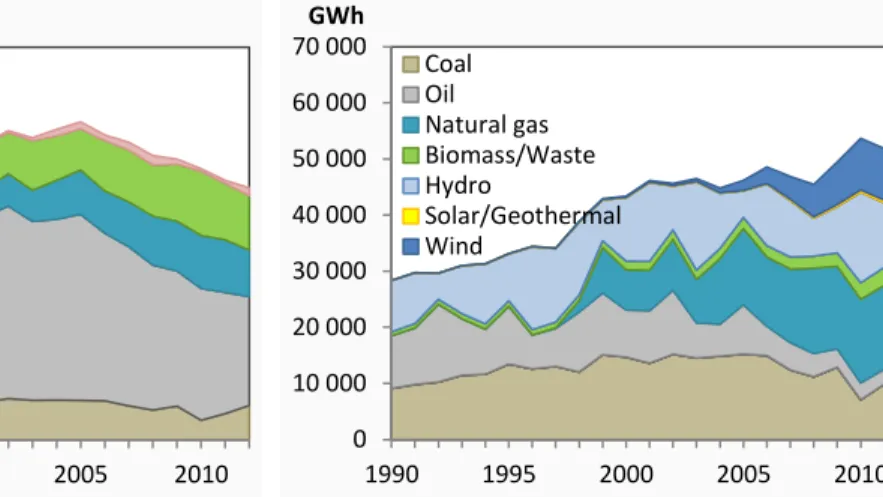
Figure 1.7 | Portuguese primary energy supply pathway per energy source ... 23
Figure 1.8 | Portuguese power generation pathway per energy source ... 23
Figure 1.9 | Portuguese GHG emissions pathway per source category. ... 23
Figure 2.1 | Variation in GHG emissions from 1990 to 2020 for the modelled scenarios. ... 53
Figure 2.2 | ETS and Non-ETS GHG emission estimates for 2020 represented as % variation from the BASE scenario. ... 55
Figure 3.1 | Investment costs (upper charts) and long distance efficiency (lower charts) for some private car technologies in TF and TE scenarios ... 71
Figure 3.2 | Sector GHG emissions (Mt CO2e) over time in the different scenarios. ... 75
Figure 3.3 | Electricity generation (TWh) per technology over time. ... 76
Figure 3.4 | Energy consumption per sector and energy carrier (PJ) for selected years 2010, 2030 and 2050 ... 77
Figure 3.5 | Road transports mobility (vechiles.km) over time... 79
Figure 4.1 | GEM-E3_PT and TIMES_PT calibration framework ... 92
Figure 4.2 | Low carbon scenarios (+27S, -20S, -60S). ... 93
Figure 4.3 | GHG emissions reduction (Gg CO2e and percentage inside the bars) for the low carbon scenarios comparing to Baseline scenario ... 96
Figure 4.4 | Comparison between GHG emissions, energy intensity, carbon intensity and activity level across models and scenarios (Baseline scenario (BS) = 100 over time) ... 99
Figure 4.5 | Final energy consumption by fuel (2005, 2020, 2030 and 2050) under Baseline and Climate Policy scenarios ... 100
Figure 4.6 | Marginal abatement cost curve for the year 2050 ... 102 Figure 5.1 | Scenario approach framework: Link between socio-economic storylines and energy
Figure 5.2 | TIMES_PT inputs and outputs flow. ... 119 Figure 5.3 | Investment costs (€2010/kw) and respective learning rate of some power sector technologies that are considered in each scenario ... 127
Figure 5.4 | Primary energy supply (PJ) per energy source and energy dependence (%) ... 128 Figure 5.5 | Electricity supply per source/technology (GWh) and renewable energy share (%) ... 130 Figure 5.6 | Energy consumption (PJ) in transport sector per energy source and the share of RES
consumption (%) ... 132
Figure 5.7 | Final energy consumption (PJ) per energy source and the share of RES consumption (%)
... 133
Figure 5.8 | Final energy intensity and sector energy intensity evolution (2010 = 100) ... 134 Figure 5.9 | Greenhouse gas emissions evolution (kt CO2e) per sector ... 135
Figure 6.1 | Nesting constant substitution elasticity production structure of standard GEM-E3_PT.
... 152
Figure 6.2 | Nesting constant substitution elasticity production structure of modified GEM-E3_PT
in HYTEP version ... 155
Figure 6.3 | Schematic view of HYBTEP soft-link framework. ... 158 Figure 6.4 | Schematic view of HYBTEP iteration process for the CALIB scenario (grey lines in
iteration 3 represent the initial step of the policy scenarios). ... 162
Figure 6.5 | Final energy consumption pathway per scenario and modelling tooL ... 165 Figure 6.6 | Final energy consumption pathway per energy carrier under TAX and RES scenarios,
modeled by HYBTEP and TIMES_ED(-0.3) ... 166
Figure 6.7 | Final energy consumption pathway per sector and modelling tool under TAX and RES
scenarios. ... 167
Figure 6.8 | Total GHG emissions pathway per scenario and modelling tool. ... 169 Figure 6.9 | Sector energy intensity pathway per modelling tool under TAX and RES scenarios .. 173
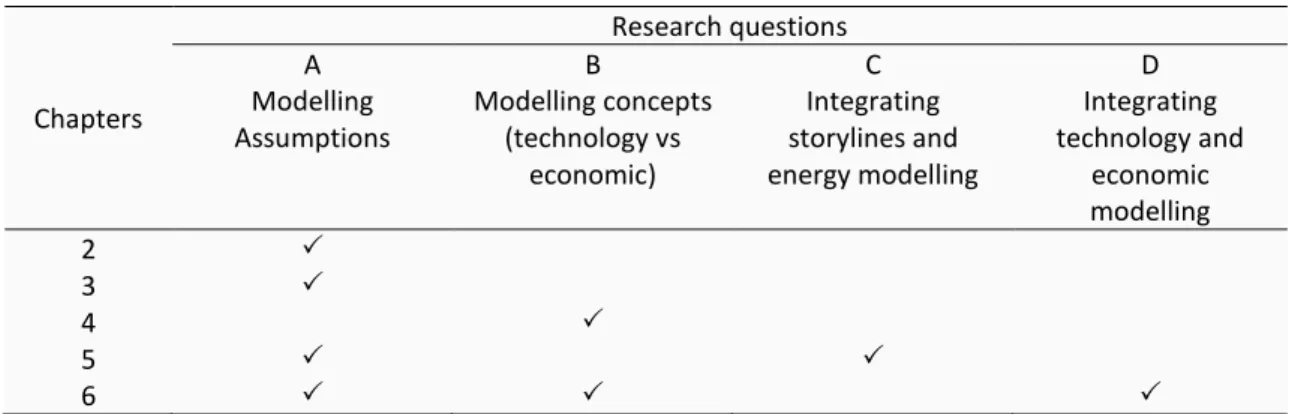
Table 1.1 | Characteristics of qualitative and quantitative scenarios ... 13 Table 1.2 | Main characteristics of top-down and bottom-up models. ... 17 Table 1.3 | Overview of the research questions address in each chapter of this dissertation ... 27 Table 2.1 | Examples of medium term GHG emission scenarios and projections from energy
production and consumption and considered exogenous assumptions. ... 42
Table 2.2 | Differences between scenarios regarding the penetration of end-use efficient
equipment. ... 46
Table 2.3 | Differences between scenarios regarding main macro-economic drivers until 2020. .. 48 Table 2.4 | Differences between scenarios in terms of infrastructure and in incentives for RES-E
reduction. ... 49
Table 2.5 | Major differences between scenarios regarding primary energy import prices. ... 50 Table 2.6 | Synthesis of the modelled scenarios. ... 51 Table 2.7 | Indicative variation in assumptions in 2020 compared to BASE and corresponding
variation in GHG emissions. ... 53
Table 2.8 | GHG emission estimates for 2020 (Gg CO2e). ... 54
Table 2.9 | RES share of final energy consumption in 2020 (PJ) ... 55 Table 2.A | Differences between scenarios regarding demand for end-use energy services until
2020 using the index 2000 = 1000. ... 60
Table 3.1 | Overview of the scenarios assumptions. ... 71 Table 3.2 | Macroeconomic drivers and respective energy services, materials and mobility demand
annual average growth (%). ... 72
Table 3.3 | Sector GHG emissions abatement per scenario and selected years (%). ... 75 Table 3.4 | GHG emissions reduction (Mt CO2e.) compared to 1990 values. ... 81
Table 3.A | Investment, operation and maintenance cost of selected power sector technologies
within TIMES_PT technological database ... 82
Table 3.B | National primary energy potential ... 83 Table 4.1 | Modelling results for Baseline scenario from GEM-E3_PT and TIMES_PT following the
calibration process (renewable energy consumption not included) ... 95
Table 4.2 | Percentage of GHG emissions reduction in 2020 compared to 2005 disaggregated in EU
ETS and non EU-ETS for the Low Carbon scenarios. ... 97
Table 4.A | GEM-E3_PT and TIMES_PT sectors and its respective correspondence in the calibration
process. ... 106
Table 5.2 | Overview of the linkages between selected issues from socio-economic storylines and
energy modelling inputs ... 124
Table 5.3 | Comparison of Portuguese energy system development from qualitative and quantitative scenarios ... 136
Table 5.A | TIMES_PT end-use sectors and the respective socio-economic indicators... 140
Table 6.1 | Correspondence between GEM-E3_PT and TIMES_PT activity sectors and energy commodities in HYBTEP. ... 154
Table 6.2 | Demand for energy services, materials and mobility in selected sectors, in iteration 0 and 3 of CALIB scenario for 2030 and 2050. ... 162
Table 6.3 | CO2 price ((€08/t CO2e) (EC, 2011c)) considered in TAX policy scenario. ... 164
Table 6.4| Economic impacts for 2030 and 2050 modelled by HYBTEP ... 171
Table 7.A| Overview of the scenarios generated in this research – Assumptions. ... 194
BU Bottom-up
CES Constant substitution elasticity CCGT Combined Cycle Gas Turbine CCS Carbon capture and storage CGE Computable General Equilibrium CH4 Methane
CHP Combined heat and power CO2 Carbon dioxide
CO2e Carbon dioxide equivalent
CPV Concentrated photovoltaic CSP Concentrated Solar Power E3 Energy-Economy-Environment EC European Commission ETS Emissions Trading Scheme
ETSAP Energy Technology Systems Analysis Program
EU European Union
FEC Final Energy Consumption
GAMS General Algebraic Modelling System GDP Gross Domestic Product
GEM-E3 General Equilibrium Model for Economy–Energy–Environment GHG Greenhouse Gas(es)
GVA Gross Value Added
IAM Integrated Assessment Model(s) IEA International Energy Agency IPCC Intergovernmental Panel on Climate
Change
MAC Marginal Abatement Cost MCP Mixed Complementarity Problem N2O Nitrous oxide
Non-ETS Emissions not included in the EU Emissions Trading Scheme NEEAP National Energy Efficiency Action
Plan
NREAP National Renewable Energy Action Plan
OECD Organisation for Economic Co-operation and Development ppm parts per million
PV Photovoltaic
RCP Representative Concentration
RES Renewable energy sources RES-E Renewable Energy Sources for
Electricity
RES-H&C Renewable Energy Sources for Heating and Cooling
RES-T Renewable Energy Sources for Transport
SAM Social Accounting Matrix SRES Special Report on Emissions
Scenarios
TD Top-Down
TIMES The Integrated MARKAL-EFOM System model
TFEC Total Final Energy Consumption TPES Total Primary Energy Supply UNFCC United Nations Framework
Convention on Climate Change C degree celsius bbl oil barrel Gg gigagram (109 gram) Gt gigatonne (109 tonne) GW gigawatt (109 watt) GWh gigawatt-hour (109 watt-hours)
Mbtu million British thermal unit Mt Million metric tonnes MW megawatt (106 watt)
p.a. per annum
PJ petajoule (1015 joule)
pkm passenger-kilometre
t tonne
tkm tonne-kilometre toe tonne of oil equivalent
C
HAPTER
1
Limiting climate change will require large and sustained reductions of greenhouse gas emissions. We need to act now, otherwise we will jeopardize the future of our children, grandchildren and many future generations.
Time is not on our side
Michel Jarraud (Secretary-General of World Meteorological Organization) (2013)
Climate change is currently recognized as one of the major challenges of the 21st century. Its long-term impacts can affect the planet in a decisive way, changing the pace of economic activities, human well-being, available resources and ecosystems. The mitigation of greenhouse gases (GHG) emissions in order to avoid dangerous anthropogenic pressure on the climate system is consequently on the top of the political agenda. Several countries and regions have been setting mitigation targets, and defining GHG reduction policies and measures, mostly linked with their energy systems. Due to the uncertainty surrounding socio-economic and technological development, key drivers of GHG emissions, and the complexity of changing a country’s energy system towards a low carbon future, decision makers are supported by scientific knowledge in the form of GHG mitigation and energy scenarios, which are used as inputs in the political debate. How much can we reduce our GHG emissions? What is the most cost-effective configuration of the energy system compatible with such mitigation target? What will be its costs and economic impacts? What is the effect of a particular policy instrument (e.g. carbon tax, renewable subsidy) on GHG emissions, energy system and economy? These are just a few examples of the questions made by country’s decision makers. Mitigation scenarios (frequently generated with mathematical models) are a common tool used for providing replies.
Not surprisingly, model-based scenarios present limitations due to the inherent uncertainty of future conditions translated in the model’s input assumptions, e.g. socio-economic evolution. Moreover, frequently used modelling tools have different structures and characteristics, which can result in different answers. Model-based scenarios do not forecast the future, they only help to understand and explore it as “cloudy crystal balls”.
The core motivation of this thesis is to contribute to the advance of model-based GHG mitigation scenarios by exploring the uncertainties associated with the modelling tools and their assumptions, analysing its relevance within the policy support framework and proposing methodologies to tackle those uncertainties – “clearing the cloudy crystal balls”. Furthermore, by using Portugal as a case
study, this dissertation explores alternative mitigation scenarios, providing insights on how the Portuguese energy system can shift towards to a low carbon configuration.
This chapter lays out the context and motivation of this dissertation, including a brief background information on the Portuguese energy system, used as a case study. Finally it specifies the dissertation objectives and outlines.
1.1 T
HE CHALLENGE OF CLIMATE CHANGE MITIGATION
It has become increasingly evident that the growth of carbon dioxide (CO2) concentrations intensifies the greenhouse effect with the consequent gradual warming of the Earth’s climate system. According to the Intergovernmental Panel for Climate Change (IPCC)1, it is extremely likely (i.e., more than 95% certain) that the dominant cause of global warming since the mid-20th century are the cumulative concentrations of GHG produced by human activities (IPCC, 2013). Since pre-industrial times, anthropogenic GHG emissions have grown, with an increase of 75% between 1970 and 2010 (UNEP, 2012), i.e., 28.7 to 50.1 Gt CO2 equivalent2. As a result, atmospheric carbon
concentrations increased more than 100 parts per million (ppm) in comparison to its pre-industrial level, reaching in the last years the highest levels ever recorded (e.g. 416 ppm CO2e in 2011 (EEA, 2014)).
Data on air temperatures at land and ocean surfaces show an average warming of 0.89 Celsius (C) since the beginning of the 20th century and each of the last three decades has been successively warmer than any preceding decade since 1850 (IPCC, 2013). This has been leading to other changes on natural and human environment, changes in global water cycle, rising of sea levels, acidification of the oceans, reduction of snow and ice and alterations in the weather patterns, with an increase of extreme climate events. Agriculture and the respective food supply, freshwater, biodiversity and human health are just few examples of major systems under threats from climate change (a broad overview of climate change impacts and its effects in Europe, is given by IPCC (2007) and Ciscar et al. (2009), respectively).
1 IPCC is an international body established in 1988 by the United Nations Environment Programme (UNEP) and
the World Meteorological Organization (WMO) and endorsed by the United Nations General Assembly. Its mission is to provide a comprehensive view of the state of knowledge about climate change and its potential environmental and economic impacts trough the compilation of scientific, technical and socio-economic information produced worldwide.
2 Carbon dioxide emission equivalent is a common metric scale used to compare the emissions from various
The impacts of climate change and the global concerns about them led countries to join an international treaty in 1992 – the United Nations Framework Convention on Climate Change (UNFCCC). Currently signed by 195 Parties, the ultimate objective of UNFCCC is to achieve the “stabilization of greenhouse gas concentrations in the atmosphere at a level that would prevent dangerous anthropogenic interference with the climate system (…) within a time frame sufficient to allow ecosystems to adapt naturally to climate change, to ensure that food production is not threatened and to enable economic development to proceed in a sustainable manner.” (Article 2 of (UNFCCC, 1992)).
In 1997, the adoption of the Kyoto Protocol emerged as a first effort to limit global GHG emissions, becoming a milestone in climate change policy. As part of the Protocol, and recognizing that developed countries are the main responsible for the current high levels of GHG emissions, thirty seven industrialized countries and the European Union (EU) have agreed to legally-binding GHG emissions reduction targets. Globally, these represented up to an average of 5% reduction compared to 1990 levels over the first commitment period, 2008 to 2012 (UNFCCC, 2008). In 2012, the Kyoto Protocol was amended – the Doha Amendment – defining the commitment of thirty-eight countries to reduce its global GHG emissions by at least 18% below 1990 levels, in the period 2013-2020 (UNFCCC, 2013). However, due to the changes in the parties composition, this second commitment period covers a smaller share of global emissions (around 14-15%) than the first (EC, 2013). Moreover, the new amendment target does not represent a legally-binding mitigation goal as it is needed the acceptance by at least three fourths of the Parties.
The Kyoto Protocol is not the only instrument addressing specific climate change mitigation. Since the Copenhagen Accord (UNFCCC, 2009) and Cancun Agreements (UNFCCC, 2010), signed by the Parties of UNFCCC, the goal to limit average global temperature rise within 2 C above pre-industrial level, to prevent “dangerous” climate change impacts, has been widely disseminated in the climate policy discourse and used to justify mitigation targets and inform policy making on adaptation (Jordan et al., 2013).
However, recent research suggests that many ecosystems are more sensitive to impacts at 2 C of warming than previously assumed (Smith et al., 2009; Warren et al., 2013). Some parties, particularly the Small Island Development States and Least-Developed Countries, are already concerned about the fact that this threshold might be excessively high, claiming that local and regional impacts associated with 2 C warming, namely sea-level rise, water stress and increased incidence and re-emergence of climate-related diseases, might exceed the adaptive capacity of their societies and actually jeopardize the sovereign existence of many small islands. The UNFCCC
“strengthening the long-term global goal on the basis of the best available scientific knowledge, including in relation to a global average temperature rise of 1.5°C”, in its review by 2015 (UNFCCC, 2010).
As part of the above-mentioned Agreements, countries have been announcing commitments on national and regional emission reductions. According to a wide range of studies, there is an emission gap between the 2020 emissions consistent with a “likely” (>66%) chance of meeting the 2 °C target, around 44 Gt CO2e (41-47 Gt CO2e), and the emissions estimated according to the
national pledges – 55 Gt CO2e within a range of 54-55 Gt CO2e (UNEP, 2012). According to the last
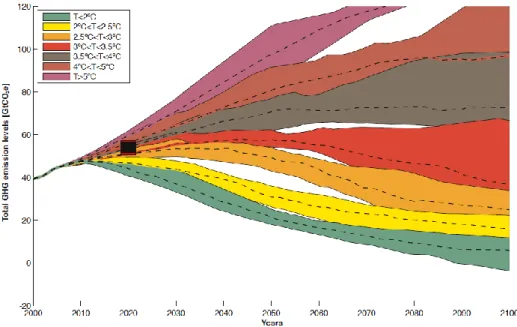
Emissions Gap Report of United Nations Environment Programme (UNEP), the range of 2020 emission levels implied by current pledges is more consistent with pathways limiting global temperature increase (with >66% chance) from 3 to 5°C above pre-industrial levels (UNEP, 2012). Figure 1.1 illustrates the gap between the pledges and the GHG emissions level that are “likely” to keep global warming below 2C.
Figure 1.1 | Emissions pathways and corresponding “likely” (66%) chance of staying in various temperature
limits. Black box around 2020 indicates the emissions levels consistent with the current pledges. Source: UNEP (2012).
New economic developments, emerging technologies and data on environmental factors have motived IPCC to collect and set new emission scenarios (Moss et al., 2008). The Representative Concentration Pathways (RCPs) scenarios are supported by four radiative forcings3 (RCP 8.5, RCP6.0, RCP4.5, RCP2.6) each exploring different levels of climate mitigation. RCP8.5 represents
3 Radiative forcing is a measure of the change (expressed in Wm–2) in the net balance between incoming and
outgoing energy in the climate system. Due to changes in the atmospheric constituents, namely higher concentration of CO2, radioactive forcing has been increasing since pre-industrial levels, leading to the
the 90th percentile of the reference energy and industry CO2 emissions range, while RCP2.6 represents pathways below the 10th percentile of mitigation scenarios, with the use of bio-energy and carbon capture and storage resulting in negative emissions (Moss et al., 2010). At present, emissions are tracking just above RCP8.5 (Sanford et al., 2014). According to IPPC (IPCC, 2013), global surface temperature in 2100 is likely to exceed 1.5°C relative to 1850 to 1900 for all RCP scenarios except RCP2.6 and likely to exceed 2 C for RCP 8.5 and RCP 6.0 (Figure 1.2).
This means, that more ambitious domestic mitigation pledges are necessary in order to achieve the UNFCCC objective – this is valid both for the short term and long term. Global emissions need to peak and decline before the end of this decade to land in the 41-47 GtCO2e window in 2020 and decrease substantially thereafter. Following the RCP2.6 path would require a decrease of global carbon emissions by 50% compared to 1990 levels by mid-century.
Additional policies and measures must be designed and implemented and new low carbon technologies must emerge, otherwise staying below 2 °C during the 21st century will have serious risks of not being feasible.
Figure 1.2 | Global temperature change
(mean) associated with the RCP scenarios. Source: Sanford et al. (2014).
1.2 S
USTAINABLE ENERGY SYSTEM
Climate Change and energy are closely intertwined as the energy sector is currently responsible for more than two-thirds of global GHG emissions (IEA, 2013a). Energy is also one of the main pillars of human society, as it satisfies most of its needs (e.g., cooking, lighting, mobility, communication, industrial production), being a critical factor for economic development. Although in the last decades there has been a decoupling of energy consumption from economic growth, due to structural changes in the economy, energy efficiency and fuel switching, over a century, cheap and abundant fossil energy has been supporting the industrialisation of many countries and increasing the higher standards of living of their inhabitants. Historical trends show that economic development has been deeply associated with energy consumption, with developed countries presenting higher values of energy consumption per capita (Figure 1.3).
A sustainable social and economic development requires a secure and affordable energy system, which has not been compatible with environmental protection up to today. Global energy demand has grown almost 50% from 1990 to 2011, led by fossil fuels, which account more than 81% of the primary energy consumption (IEA, 2013b). If the current global energy trends continue, CO2 emissions will almost double by 2050, paving the way towards a 6 C rise in average global temperature when compared to pre-industrial level (IEA, 2012). Non-sustainable energy systems also led to other problems, such as depletion of natural resources and air pollution with negative effects in public health and economy. Moreover, fossil fuels resources, like oil and gas, are not equally distributed among regions which, besides the negative economic effect on demanding countries, can also result in some vulnerability, namely because of potential political instability of suppliers. 0 1 2 3 4 5 6 7 8 9 0 10 000 20 000 30 000 40 000 50 000 T PE S p e r c a p ita (t o e /p e rs o n )
GDP per capita ($2005/person)
USA Norway Germany Japan Portugal Brazil China India Figure 1.3 | Relation
between Total Primary Energy Supply (TPES) per capita and Gross Value Added (GDP) per capita by Purchasing Power Parities. Values from 1971 to 2012 (2011 for China, India and Brazil). Source:
author’s own
elabouration based on (IEA, 2013c) and (OECD, 2013a, 2013b).
Over the last decade, energy security has re-emerged on the political stage mostly due to the rising energy demand in emerging economies leading to a “demand shock”; high and volatile oil prices; increasing dependence on imported natural gas in Europe and; the vulnerability of energy infrastructure to terrorism, natural disasters and accidents (Jewell, 2013), whose concerns were enlarged after the Fukushima nuclear power plant accident, in 2011, as a consequence of an earthquake and tsunami.
Thus, the decarbonisation of the energy system through low-carbon technologies and the
improvement of energy-efficiency, can simultaneously tackle climate change, improve air quality,
and provide energy security by promoting a more dependable, resilient, and diversified energy
portfolio (McCollum et al., 2013).
Today, policy makers are facing the challenge to decide on new policies and strategies towards a sustainable energy system, across the economic and environmental spheres, i.e., an affordable, cost-effective, secure and low carbon energy system that meets its demand.
Energy-environment-economy (E3) interactions play therefore a crucial role in driving climate change mitigation and energy policies. The integrated EU energy and climate policy is a clear example of the relevance of the E3 interactions and how these three components could be combined. The climate and energy package 2020 (EC, 2008) integrates the reduction of GHG emissions with the reduction of EU’s energy imports dependence, with the goal of improving energy security, supporting growth and increasing competitiveness, innovation and jobs. These objectives are delivered by three key marks up to 2020:
- A reduction of 20% of GHG emissions relative to the level registered in 19904. This goal is associated with two distinct targets and segments of GHG emissions: i) emissions from energy-intensive sectors covered by the EU Emissions Trading Scheme (ETS), which are subject to an EU-wide annual decreasing cap until achieve a reduction of -21% in 2020 comparing with 2005 emissions; and, ii) emissions from the sectors not covered by ETS (non-ETS), which are subject to national pledges embodied in the so-called Effort Sharing Decision (EC, 2009a). Each Member state has differentiated annual targets set on the basis of their relative prosperity. By 2020, these national targets will collectively correspond to a reduction of around 10% in total EU non-ETS emissions compared with 2005 levels.
4 EU has also proposed a conditional commitment to reduce its global GHG emissions to 30% in 2020 if “other
- 20% share for renewable energy sources (RES) of the energy consumed, including 10% in transport. Each Member State has a specific national binding target (EC, 2009b) reflecting its different starting points and potential for increasing renewable consumption.
- 20% savings in energy consumption compared to projections. Although the energy-climate package does not address the energy efficiency target directly, each Member State has to set national energy efficiency objectives under the EU Energy Efficiency Directive (EC, 2012). In parallel, the EU introduced a regulatory framework to drive the creation of an open, integrated and competitive single market for energy to promote the security of energy supplies.
Being on the forefront of international climate negotiations, EU has also proposed post-2020 goals, suggesting a unilateral target to cut its GHG emissions by 40% below 1990 levels by 2030 (EC, 2014), with the ultimate goal of achieving a 80% reduction by the middle of the century (EC, 2011a). These targets are once again integrated with sustainable energy goals, translated as an increase of renewable energy consumption by 45% and a level of energy savings of approximately 25% (in 2030). One question now is how these goals will be delivered in each EU Member State.
1.3 S
CENARIOS
:
A
DECISION
-
SUPPORT TOOL
FOR ENERGY AND CLIMATE
CHANGE
The achievement of low carbon targets requires a transition to sustainable energy systems and medium and long-term perspectives on GHG emissions and energy technology pathways are a crucial key to support decision making. The climate system has a slow response to changes in the GHG concentrations and current emissions will continue to affect the Earth’s temperature over the next century. Structural changes of economy, such as the replacement of fossil-based energy by less carbon-intensive alternatives, are also slow processes. Energy infrastructure takes time to plan, build and usually has a long lifetime, which makes replacement a lengthy process. Additionally, new technologies, more efficient and less carbon intensive, need time to develop and even longer to reach their maximum market share (IEA, 2003; Kramer and Haigh, 2009).
Long-term perspectives are associated with large uncertainty due to the limitations of our knowledge. Basing our decisions on the assumption of continuation of present trends presents risks (IEA, 2003), and many examples of failure in statements on future trends are available(Craig et al., 2002). Thus, decisions about mitigation targets operates within a context of uncertainty which can assume considerable proportions if we consider the uncertain impacts of climate change and the uncertain associated with the future availability and costs of different technologies.
Given the impossibility of knowing what has not yet unfolded, scenarios arise as a suitable tool to tackle the uncertainties of the future through a structured and imaginative process (Rounsevell and Metzger, 2010). They help to explore the what, how and/or if in future pathways and allow to understand how different key driving forces might lead to different outcomes. However, scenarios are not predictions or forecasts but rather are a collection of pictures that sets the limits of plausible futures (Wilson, 2000).
Scenario analysis has been applied for a wide range of disciplines and scopes. Since the 70’s when Shell used it after the oil crisis of 1973, to explore discontinuities in the oil supply path and position the company for different market development (Wack, 1985), the approach was diffused and became a popular and recommended method to address uncertainty and to improve decision making (Varum and Melo, 2010).
When applied in climate change research, scenarios help evaluate the uncertainty about the human contribution to climate change: the response of the climate system to human activities; the impacts of different future climates; the implications of human activity and mitigation approaches in GHG emissions; and the consequences of different actions that facilitate the response to new climate conditions, i.e. the effects of adaption measures (Moss et al., 2010). Scenarios play a central role in this dissertation as a tool for exploring energy systems and GHG emissions pathways, mostly associated with mitigation goals.
“Emission scenarios are descriptions of potential future discharges to the atmosphere of substance that affect the Earth’s radiation balance, such as GHG” (Moss et al., 2010). Because GHG emissions are the result of a complex process between several driving forces as, demographic and economic evolution, environment awareness or technological development, emission scenarios have been traditionally produced by modelling tools based on assumptions about such driving forces. They allow exploring alternative energy and technology futures, understanding the role of each driving force in the GHG emission and inform policy-makers about potential options forward a lower emission path.
The uncertainty in emissions and energy scenarios results from the inherent uncertainty of future socioeconomic, technology and policy conditions, and the differences in representations of processes and relationships across modelling tools (Moss et al., 2010), i.e. the uncertainty associated with different models characteristics. How can these uncertainties influence the GHG emissions scenarios? Which are the most relevant uncertainties regarding the use of scenarios for support policy decision? And, what is the consequence for decision making process? These are
examples of questions that should be answered in order to improve scenarios development and increase the confidence of stakeholders in using them to support decisions.
Two prominent approaches have been applied to deal with uncertainty in energy and GHG emissions scenarios (IPCC, 2005; van Vuuren et al., 2008): i) probabilistic approach (e.g. (Webster et al., 2002, 2003; Labriet et al., 2012)) and, ii) storylines approach (e.g. (Nakicenovic et al., 2000)). The first captures uncertainty by defining probability distributions for the most important model parameters and uses statistical techniques to create a range of results or a hedging outcome, while the latter builds narratives around the scenario driving forces, creating relations between them and getting different possible scenarios. Although complementary, an ongoing debate about the strengths and weakness of these two approaches has been held. Some authors argue that policy and decision-makers need probability estimates to assess the risks of climate change impacts (Schneider, 2001; Webster et al., 2002). Multiple scenarios can place decision-makers in a quandary (Labriet et al., 2012) or make them define their own assumptions about the probability of different outcomes, possibly in ways that the authors did not intend (Schneider, 2002). However, other authors outline that it is not meaningful to assign subjective probability estimates as the ones associated with social systems, i.e., society, economy, technology and policy (Nakicenovic et al., 2000). Socio-economic variables and their alternative future development paths are not freely interchangeable because of their interdependencies. Uncoupled sampling within distribution ranges of these variables may result in inconsistent combinations (Grübler and Nakicenovic, 2001). Focusing attention on a very small number of most-likely futures can negate the benefit of using scenarios, i.e., covering a wide range of possibilities, ignoring the lessons from history (Schnaars and Ziamou, 2001; Grubler et al., 2006; O’ Mahony, 2014). The research work in this dissertation only focuses in this last approach.
1.3.1 Q
UALITATIVE AND QUANTITATIVE SCENARIOSThe scenario literature can be classified into two major categories – qualitative narratives and quantitative modelling (Morita et al., 2001).
Qualitative scenarios (“storylines”) are usually used to analyse complex situations with high levels of uncertainty or when the information cannot be entirely quantified, like human values, emotions, or behaviour (van Notten et al., 2003). They result from stakeholders’ workshops, interviews or other participatory methods. Quantitative scenarios, on other hand, assume a quantitative feature, describing the future with numerical figures, generally obtained by complex modelling tools. Emission scenarios are traditionally quantitative, requiring assumptions and simplifications that
the main characteristics of qualitative and quantitative scenarios, allowing a comparative analysis between them.
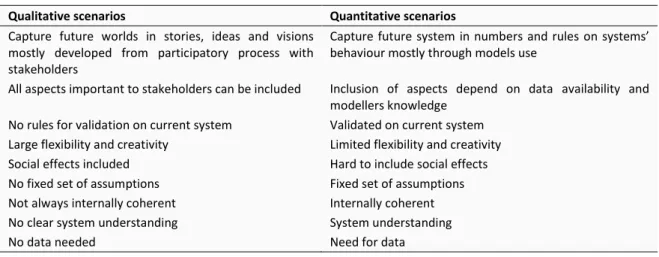
Table 1.1 | Characteristics of qualitative and quantitative scenarios. Source: adapted from Vliet et al. (2010).
Qualitative scenarios Quantitative scenarios
Capture future worlds in stories, ideas and visions mostly developed from participatory process with stakeholders
Capture future system in numbers and rules on systems’ behaviour mostly through models use
All aspects important to stakeholders can be included Inclusion of aspects depend on data availability and modellers knowledge
No rules for validation on current system Validated on current system Large flexibility and creativity Limited flexibility and creativity
Social effects included Hard to include social effects
No fixed set of assumptions Fixed set of assumptions Not always internally coherent Internally coherent
No clear system understanding System understanding
No data needed Need for data
Both approaches have strengths, but also limitations which can be overcome by hybrid combinations, making scenarios more consistent and robust (van Notten et al., 2003) due to their structural and methodological diversity (Morita et al., 2001).
The development of storylines associated with quantitative scenarios, gives a consistent support to the modelling assumptions and/or outcomes, making the scenarios more comprehensible and not just a result of arbitrary modelling choices (O’ Mahony, 2014). Moreover, qualitative scenarios developed from the participation of diverse stakeholders increase the creativity, relevance and legitimacy of scenarios, enhancing also the communicability of numeric data to a broader audience, i.e., transmitting complex information in a comprehensible way.
Likewise, the introduction of quantitative data to qualitative scenarios enables tests of plausibility and coherence (van Notten et al., 2003), particularly when a quantitative goal as a GHG emission pledge or a RES consumption target is being considered, quantitative scenarios can assess their compliance. Moreover, quantitative scenarios from numerical models can ‘‘enrich’’ qualitative scenarios by showing trends and dynamics not anticipated by the storylines (Alcamo, 2008). Figure 1.4 illustrates the improvements of both qualitative storylines and quantitative formulations based on modelling when integrated in “hybrid scenarios” (Alcamo, 2008).
High Storylines Models Hybrid Scenarios Low Low High Amenable to analysis and evaluation Ilustrate ideas Creativity
Figure 1.4 | Schematic illustration of
hybrid scenario formulations, from narrative storylines that explore diverse contexts to quantitative models that evaluate their plausibility and compliance. Source: adapted from (Ghanadan and Koomey, 2005).
One of the most well-known greenhouse gas (GHG) emission scenario exercises, is the Special Report on Emissions Scenarios (SRES) from the IPCC (Nakicenovic et al., 2000). SRES combined qualitative and quantitative scenario approaches to develop a set of emissions scenarios. It illustrated four storylines, representing different pictures of how the world might develop through 2100 in terms of economy, society and technological progress, in an absence of climate change policies. Using six different integrated assessment models the storylines were converted in forty GHG emissions scenarios, six of them used as markers scenarios, i.e., scenarios that “are no more likely than other scenarios”, but are considered as “illustrative of a particular storyline” (Nakicenovic et al., 2000). According to SRES team, besides making it easier to explain the scenarios to the various user communities, the development of narrative storylines helped “to think more coherently about the complex interplay between scenario driving forces within and across alternative scenarios and to enhance the consistency in assumptions for different parameters”, tackling this way the uncertainty regarding the modelling input assumptions.
Although other global environmental assessments, such as the Global Environment Outlook (UNEP, 2007), the World Water Vision scenarios (Cosgrove and Rijsberman, 2000; Alcamo, 2008b) and the Millennium Ecosystem Assessment scenarios (Carpenter et al., 2005) have combined qualitative and quantitative approaches, most developments occurred separately (Wilkinson et al., 2013). There is little evidence of the combination of storylines and modelling on energy and low carbon scenario development (Söderholm et al., 2011). In fact energy and emission scenarios such as the ones developed by the International Energy Agency (IEA, 2012; IEA, 2013b) or the European Commission (EC, 2011a, 2011b) do not comprise any storyline, representing essentially quantitative outputs of models. Most energy modelling studies show great technical details, but neglect the entire interaction between social, economic and technological factors, ignoring aspects as the
interconnection of the economic capability or social behaviour with technological development for example.
The main reason for this is that although storylines and quantitative modelling scenarios are complementary, it is not easy to combine them due to the underlying different communities (modellers versus stakeholders), the time consuming process and the inherent characteristics of each approach as denoted in Table 1.1.
However, in reality, social and technological systems are not constructed independently. Instead, the various systems (social, technological, economic, political) develop in an “iterative and reflexive” manner (Hughes et al., 2009). The absence of storylines and mostly the lack of their inherent participatory building process with stakeholders can result in a blurred picture for the non-modelling community, and tend to reduce the scenarios acceptance, which can assume significant proportions if we consider that those scenarios support energy and climate policy decisions. In short energy and GHG emission scenarios only supported by model outcomes result in scenarios that are too narrow, which is a major drawback.
1.3.2 I
NTEGRATED ASSESSMENT MODELSEmission scenarios are commonly generated through integrated assessment models (IAM), which combine natural science and socio-economic aspects, primarily for the purpose of assessing climate change policy options (Weyant et al., 1996). They represent key features of human systems, such as demography, energy use, technology, economy, agriculture forestry and land use (Moss et al., 2010).
One of the widespread categories of IAM are the so called E3 models. These models illustrate the interactions between these three spheres: energy-environment-economy, setting future energy demands, defining various options to satisfy it, namely energy resources and/or technologies, and computing its respective GHG emissions. E3 models are the core tool in energy and climate mitigation scenarios, exploring different energy futures and inform policy makers about the potential and the costs or economic impacts to reduce GHG emissions.
To obtain a global climate response IAMs are linked to climate models, representing the atmospheric chemistry and atmosphere-ocean interactions, translating GHG emissions in GHG atmospheric concentrations and defining the respective radioactive forcing and temperature change. Moreover, besides the E3 interactions, IAMs can also include land-use, forestry and agriculture components, which enable them to calculate, in addition to the GHG emissions of the
Currently, there is a multiplicity of IAM models as shown by (Nakicenovic et al., 2000; Das et al., 2007; Clarke et al., 2009; Capros et al., 2014). This is a result of their different additional modules, calculation methods, assumptions, disaggregation, among other factors. In particular, the E3 modelling framework, has been traditionally classified in two main approaches: top-down and bottom-up, which differ mainly with respect to the emphasis placed on endogenous economy representation and technology explicitness (IPCC, 2007; Böhringer and Rutherford, 2008).
Top-down (economic) models, focus on the economy as a whole, disaggregating it in several production sectors and consumption categories and incorporating markets interactions. The top-down approach has been dominated by computable general equilibrium (CGE) models (Hourcade et al., 2006) which combine the Arrow-Debreu general equilibrium with realistic economic data to compute the levels of supply, demand and price that support the equilibrium across all the markets (e.g. capital, labour, materials) (Wing, 2004). CGE models have an explicit representation of the micro-economic behaviour of the economic agents (e.g., households, firms and government). However, as a component of the economy, the energy system is represented by aggregated economic functions, which capture substitution possibilities between input factors and energy forms trough historical substitution elasticities (Böhringer and Rutherford, 2008).
On the other hand, bottom-up (engineering) models focus on the energy system, characterizing it with very detailed technology data, including technical and economic information of supply, conversion and end-use technologies (e.g. efficiency, investment and O&M costs). Bottom-up models are typically cast as optimization problems5 (Böhringer and Rutherford, 2008). They define an optimal set of technology choices to satisfy energy services demand at minimum energy system costs and under technical and/or environmental constraints, leaving energy prices and quantities in equilibrium – partial equilibrium6. When technology costs are converted into present value through discount rates, many technologies that provide the same energy service and reduce for example GHG emissions appear as an optimal choice (Bataille et al., 2006). Bottom-up models fail in representing the micro-economic behaviour of economic agents. The greater financial risk of new technologies or the fact that they may not be perfect substitutes to the economic agents is neglected by these models as their technological choices are based on a simple capital and operating financial costs (Jaccard et al., 2003). Additionally, bottom-up models ignore the interrelations and effects of the energy sector on the broader economy, ignoring the
5 Bottom-up models can also assume a simulation character, describing the development of the energy
system with a pre-defined set of rules that do not necessarily assume an optimization.
economic feedbacks of different energy system pathways or accommodating simpler price response trough exogenous energy service-price elasticities. Table 1.2 summarizes the main characteristics of the two approaches.
Table 1.2 | Main characteristics of top-down and bottom-up models. Source: Adapted from (Bryden et al.,
1995; van Beeck, 1999).
Top-down models Bottom-up models
Economic approach Engineering approach
Do not explicitly represent technologies Contain detailed technology description Reflect available technologies adopted by the market Reflect technical potential
Technical change is based on trends rates (usually exogenous)
Technical change is based on a menu of technical options (existent and emergent)
Disregard the technically most efficient technologies available, thus underestimate potential for efficiency improvements
Disregard market thresholds (hidden costs and other constraints), thus overestimate the potential for efficiency improvements - opportunities for no regrets actions identified
Determine energy demand through aggregate economic indices (gross national product, price elasticities), but vary in addressing energy supply
Represent supply technologies in detail using disaggregated data, but vary in addressing energy consumption
Based on observed market behaviour Independent of observed market behaviour Responses of economic groups via income and price
elasticities
Responses of agents via discount rates Endogenize behavioural relationships Assess costs of technological options directly
Assumes no discontinuities in historical trends The interactions between energy sector and other economic sectors is negligible
Due to its own features, top-down and bottom-up modelling approaches have specific strengths and limitations, answering different questions raised within the energy-climate policy debate. Because top-down models represent technological change as an abstract, aggregate form, this approach only helps policy makers to assess economy-wide policy instruments such as taxes and tradable permits, being ineffective in assessing the role of technology (Hourcade, Jaccard et al. 2006). Moreover, the substitution elasticities between energy commodities and energy efficiency parameters are usually set through historical data, with no guarantee that they will remain valid in the future under new energy-climate policy regimes and new technology developments (Grubb et al., 2002). For this reason top-down models tend to suggest that the efforts to move away from a trend scenario would be costly, as the economy’s potential for technological switches is restricted by historically-based elasticities (Jaccard et al., 2003; Hourcade et al., 2006; Rivers and Jaccard, 2006). On the contrary, due to its technological detail, bottom-up models enable modelling technology-orientated policies and assessing the role of technology in GHG mitigation. However, because bottom-up models choices do not reflect the micro-economic behaviour of the economic agents and they lack the macro-economic feedback, they often indicate that the shift to a
that mitigation can yield financial and economic benefits, depending on the adoption of best-available technologies and the development of new technologies (IPCC, 2001). Nevertheless, the impact of energy-climate policies is not restricted to the energy system and should therefore be analysed within an economy-wide framework (Böhringer and Schmid, 1996), including the changes in macro-economic variables such as sector production.
In short, top-down models indicate that mitigation policies have economic costs because markets are assumed to operate efficiently and any policy that damages this efficiency will be costly, while bottom-up models advocate that mitigation can even yield financial and economic benefits, depending on the adoption of best-available technologies and the development of new technologies (Barker et al., 2002).
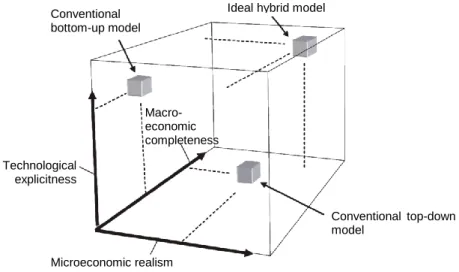
To move towards a low carbon economy, decision makers need clear and consistent information that allow them to answer: What is the real impact of energy and climate policies in the economy and society? What is the cost-effective technology portfolio that should be promoted? Separate use of top-down and bottom-up models does not adequately address all the questions. In this context, some studies argued for the need to bridge the gap between these conventional modelling approaches within an integrated hybrid framework that combine their strengths (Hourcade et al., 2006). Their ultimate goal is to build an hybrid tool that is: technological explicit, behaviourally realistic and economic comprehensive, linking energy supply and demand to the evolution of the economy’s structure and total output (Hourcade et al., 2006). Figure 1.5 shows the comparison between the dimensionalities of conventional bottom-up and top-down models and their respective changes in an ideal hybrid tool.
Figure 1.5 | Dimensionalities of top-down, bottom-up and hybrid models. Source: Hourcade et al., 2006.
Ideal hybrid model
Conventional top-down model Macro-economic completeness Microeconomic realism Technological explicitness Conventional bottom-up model