U
NIVERSIDADE
N
OVA DE
L
ISBOA
F
ACULDADE DE
C
IÊNCIAS E
T
ECNOLOGIA
D
EPARTAMENTO DE
C
IÊNCIAS E
E
NGENHARIA DO
A
MBIENTE
Climate Change Impacts on Portuguese Energy
System in 2050
An assessment with TIMES model
João Cleto
Dissertação apresentada na Faculdade de Ciências e Tecnologia da
Universidade Nova de Lisboa para a obtenção do grau de Mestre em
Engenharia do Ambiente, perfil Gestão e Sistemas Ambientais
Orientador: Profª. Doutora Júlia Seixas
L
ISBOA
A
CKOWLEDGEMENTS
I am deepfully thankful to Júlia Seixas, Sofia Simões, Patrícia Fortes and João Pedro
Nunes for their chalenging thoughts, support and collective work for the last three
years.
I would also like to thank AGENEAL, more specifically the director Carlos Sousa, for
S
UMÁRIO
As alterações climáticas têm merecido extensas avaliações tanto ao nível de
impactes, como de estratégias de mitigação e adaptação, ao nível global e nacional.
Têm sido identificadas possíveis interacções entre estes factores, no entanto, a
avaliação integrada e quantitativa das mesmas peca por defeito. Utilizando o modelo
de optimização TIMES_PT, calibrado e validado para Portugal, avaliam-se nesta
tese as interacções entre alterações climáticas, estratégias de mitigação, adaptação
e o sistema energético nomeadamente em dois sectores em cujo efeito das
alterações climáticas é mais notório: produção hidroeléctrica e procura de energia
útil. Os resultados indicam que é prudente e custo-eficaz adiar a decisão de
construção de grandes barragens hidroeléctricas além de 2020 e que a capacidade
instalada hidroeléctrica poderá baixar até 15% em 2050 face a um cenário sem
alterações climáticas. A entrada de grande potência hídrica pode também
comprometer a penetração de tecnologias de produção de electricidade avançadas.
No global o sistema energético beneficiará com as alterações climáticas por via da
redução da procura de energia útil resultando numa gama entre 4500M€2000 e
6100M€2000 de poupança acumulada entre 2000 e 2050 face a um cenário sem
A
BSTRACT
Significant work has been developed in defining climate change impacts, adaptation
and mitigation measures both on national and worldwide scopes. In the published
literature, strong references are made linking effects of mitigation and adaptation and
how the two can counteract, but there is still a lack of integrated assessment of these
issues. Using the optimization model TIMES_PT, calibrated and validated for
Portugal, interactions between climate change, mitigation strategies, adaptation and
the energy system are evaluated in this thesis. A special focus is addressed on two
sectors where climate change effects are the most noticeable: hydroelectric
production and energy demand. Results indicate that it is wise and cost-effective to
delay the investment in new hydropower infrastructure beyond 2020 and that
hydropower installed capacity could be reduced in 15% in 2050 when compared with
the scenario with no climate change. Furthermore, large hydropower capacity could
compromise the deployment of advanced electricity production technologies. Overall,
the energy system will benefit from climate change due to useful energy demand
reduction, reaching accumulated savings from 4500M€2000 to 6100M€2000 compared
List of Acronyms
IPCC Intergovernmental Panel on Climate Change
EU European Union
IA Portuguese Environment Institute
PNAC National Climate Change Program
DGEG General Energy and Geology Directorate
DPP International Relations, Prospective and Planning Department of the Ministry of Environment, Territorial Management and Regional Development
PNBEPH National Plan for High Potential Hydropower Infrastructures
ETSAP Energy Technology Systems Analysis Programme
IEA International Energy Agency
TIMES The Integrated MARKAL-EFOM system
GAV Gross Added Value
GDP Gross Domestic Product
CHP Combined Heat and Power
NEEDS New Energy Externalities Developments for Sustainability
EDP Energias de Portugal Portuguese Energy Company
REN National Energy Grids
CSP Concentrated Solar Power
IGCC Integrated Gasification Combined Cycle
1.
I
NTRODUCTION
...
I
1.1. Climate Change and Energy Policy... 1
1.2. Problem Definition ... 3
2.
M
ETHODOLOGY
... 6
2.1. TIMES_PT model ... 7
2.1.1. TIMES_PT Model structure ... 8
2.1.2. Energy and materials demand projection ... 10
2.1.3. Technology database (base year and new technologies) ... 12
2.1.4. Endogenous Primary Energy Potentials and Energy Import Prices .. 14
2.2. Baseline assumptions, calibration and validation ... 17
2.3. A zoom on hydropower modelling ... 20
2.4. Scenarios Definition... 25
2.4.1. Hydro Availability Scenarios... 25
2.4.2. Energy Demand Scenarios under Climate Change ... 27
2.4.3. Scenarios for Modelling... 33
3.
R
ESULTS AND
D
ISCUSSION
... 35
3.1. Reference Scenario ... 35
3.1.1. Primary energy supply and final energy consumption ... 35
3.1.2. Final energy consumption in commercial and residential sectors ... 38
3.1.3. CO2 Emissions ... 41
3.1.4. Electricity and heat sector ... 42
3.2. Climate Change Scenarios ... 46
3.2.1. Primary energy supply and final energy consumption ... 46
3.2.2. Final energy consumption in commercial and residential sectors ... 49
3.2.3. CO2 emissions ... 51
3.2.4. Electricity and heat sector ... 51
3.2.5. Electricity price evolution and system costs analysis... 60
4.
C
ONCLUSIONS
... 64
5.
R
EFERENCES
... 69
A.
A
NNEX
I ... 73
F
IGURE
I
NDEX
Figure 1.1 - Cross-effects between climate change, hydropower and energy demand... 4
Figure 2.1 - Generic methodology to assess climate change impacts on the Portuguese energy system ... 7
Figure 2.2 - TIMES_PT schematized model structure ... 9
Figure 2.3 - Aggregated final energy and materials demand growth evolution... 12
Figure 2.4 - Maximum feasible hydro capacity installation... 22
Figure 2.5 – Mean temperature anomaly in the Iberian Peninsula obtained with the Global Circulation Models data available at the IPCC data distribution Centre... 28
Figure 2.6 - Total energy demand for HCW (space heating, space cooling and water heating) for the residential and commercial sectors on REF and climate change scenarios... 30
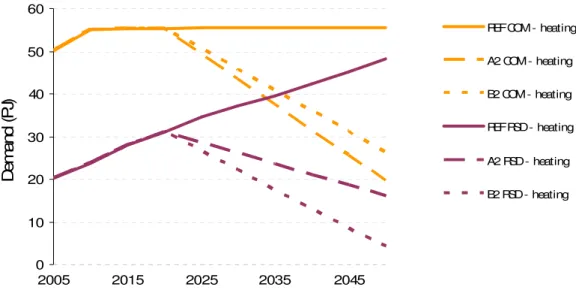
Figure 2.7 - Demand for space heating for the residential and commercial sectors on REF and climate change scenarios ... 31
Figure 2.8 - Demand for cooling for the residential and commercial sectors on REF and climate change scenarios ... 32
Figure 2.9 - Demand for water heating for the residential and commercial sectors on REF and climate change scenarios ... 32
Figure 3.1 - Primary Energy Supply evolution in the REF scenario and primary energy GDP intensity... 36
Figure 3.2 - Final energy consumption evolution in the REF scenario and final energy GDP intensity... 38
Figure 3.3 - Final energy consumption for residential sector in the REF scenario ... 39
Figure 3.4 - Final energy consumption for commercial sector in the REF scenario ... 40
Figure 3.5 - CO2 emissions by sector on the REF scenario... 41
Figure 3.6 - Electricity installed capacity by technology aggregated by fuel type ... 43
Figure 3.7 - Electricity production by technology aggregated by fuel type... 44
Figure 3.8 - Electrical installed capacity of hydropower plants in the REF scenario... 45
Figure 3.9 - Electricity production from hydropower plants in the REF scenario ... 45
Figure 3.10 - Primary energy supply for the five scenarios analysed in 2000, 2020 and 2050 ... 46
Figure 3.12 - Final energy consumption for the five scenarios analysed in 2000, 2020 and 2050 in the residential sector... 49
Figure 3.13 - Final energy consumption for the five scenarios analyzed in 2000, 2020 and 2050 in the commercial sector... 50
Figure 3.14 - CO2 emissions of the scenarios analyzed in 2000, 2020 and 2050 by sector... 51
Figure 3.15 - Electricity installed capacity by technology aggregated by fuel type for the scenarios analyzed in 2000, 2020 and 2050... 52
Figure 3.16 - Electricity produced by technology aggregated by fuel type for the scenarios analyzed in 2000, 2020 and 2050 ... 54
Figure 3.17 - Electricity produced in CHP by technology aggregated by fuel type for the scenarios analyzed in 2000, 2020 and 2050... 54
Figure 3.18 - Seasonal production of electricity and respective trendlines... 56
Figure 3.19 - Electrical installed capacity of hydropower plants for the five scenarios analyzed in 2000,2020 and 2050... 57
Figure 3.20 - Total system costs variations, compared to the REF scenario... 62
T
ABLE
I
NDEX
Table 2.1 – Primary energy endogenous potentials... 15
Table 2.2 – International energy price projections ... 17
Table 2.3 – Tax on energy products, according to energy carriers ... 19
Table 2.4 – Economical and technical data for each hydropower plant ... 24
Table 2.5 - Water runoff variability (%) in 2050 per region and season ... 26
Table 2.6 – Estimated variation (%) to the reference energy demand for the two climate change scenarios (A2 and B2) ... 29
Table 2.7–Scenarios analyzed... 34
Table 3.1 – Energy dependency rate... 37
Table 3.2 – Technology aggregation by fuel type ... 42
1. I
NTRODUCTION
1.1. Climate Change and Energy Policy
Climate change has been a hot topic of discussion in the international arena for the
last 20 years, with increasing importance in the recent years as is proven by
increasing legislative and policy options in this domain. The acknowledgement of
some of the possible impacts of climate change lead the international community to
create, in 1988, the IPCC (Intergovernmental Panel on Climate Change) in order to
provide policymakers with objective and scientific information that guides policy
action. The latest IPCC report (IPCC Fourth Assessment Report: Climate Change
2007) which collects scientific, technical and socio-economic information relevant for
the understanding of human induced climate change, has clearly stated that
observational evidence from all continents and most oceans shows that many natural systems are being affected by regional climate changes, particularly temperature increases and most of the observed increase in global average temperatures since the mid-20th century is very likely due to the observed increase in anthropogenic GHG (Greenhouse Gases) concentrations (IPCC, 2007). One of the main sources of
GHG is the energy sector as a consequence of fossil fuel burning.
Having this in mind, a growing concern has been taken in energy policy planning by
integrating GHG reduction measures (along side with energy security concerns and
energy dependency reduction). A clear example of what has been stated is the,
currently in discussion, EU (European Union) energy policy (Climate and Energy
Package) targeting clear objectives on the use of energy from renewable sources,
GHG reductions and energy efficiency1.
1 The European Council has set two key targets for the EU: a reduction of 20% (relative to 1990 levels
Although climate change strategies have been thoroughly dedicated to mitigation of
climate change by reducing greenhouse gases, significant concern is starting to arise
on the adaptation measures needed to cope with unavoidable climate change
effects2.
In Portugal, evaluating climate change impacts has been a consistent task developed
by the Climate Change Impacts, Adaptation and Mitigation Unit of the Foundation of
the Faculty of Sciences of the University of Lisbon. This group has published two
reports evaluating climate change scenarios, impacts and adaptation measures in
Portugal for the following topics: Water Resources, Coastal Zones, Agriculture,
Human Health, Energy, Forests and Biodiversity and Fisheries. Regarding the
energy sector two main conclusions are highlighted: on the supply side, it was not
clear how hydropower electricity production could be affected with changes in
precipitation and, on the demand side, an increase in global energy demand in
residential and commercial is expected due to increasing cooling needs (despite a
predictable decrease in heating needs) (Santos et al, 2006).
Following the evidences of human induced climate change and subsequent need to
act and also in order to comply with the EU legislation, Portuguese energy sector is
being developed with strong emphasis on mitigation of climate change. A national
climate change program (PNAC – IA, 2006a) is currently in place with a relevant part
of the mitigation measures dedicated to the energy sector; renewable electricity is a
growing sector (53% increase in installed capacity from 2001 to 2007)3; a national
plan on high potential hydroelectric dams (PNBEPH – INAG, 2007) envisages a
steep growth (46% in 2020 relative to 2005) in hydropower installed capacity; and,
2
Mitigation: An anthropogenic intervention to reduce the sources or enhance the sinks of greenhouse gases (IPCC, 2001). Adaptation: Adjustment in natural or human systems in response to actual or expected climatic stimuli or their effects, which moderates harm or exploits beneficial opportunities (IPCC, 2001).
3
most recently, a national action plan on energy efficiency (PNAEE – DGEG, 2008b)
has been legislated. The framework for all these plans is the national energy strategy
(MEI, 2008) which has three main objectives: ensure security of energy supply,
promote competition and ensure the environmental performance of the energy
system.
1.2. Problem Definition
Significant work has been developed in defining climate change impacts, adaptation
and mitigation measures both on national and worldwide scopes. On a global scale
IPCC reports developed and compiled significant literature on all these aspects. On a
national level SIAM project (Santos et al, 2006 and 2002) developed two reports, the
latest one dated from 2006, downscaling IPCC methodologies to Portugal and
developing new ones in order to identify the main issues regarding climate change.
On both the IPCC and SIAM reports, strong references are made linking effects of
mitigation and adaptation and how the two can counteract. In fact, the Fourth
Assessment Report Working Group II included a whole chapter dedicated to this
subject (Klein et al, 2007).
For instance, hydropower is seen as one of the most promising options to increase
renewable electricity production share4 but, as will be demonstrated later, production
potential can be seriously undermined by reduced water availability as a result of
climate change (Sims et al, 2007). Can the latter effect compromise mitigation
potential of this technology? Some assessment has been done in identifying possible
counteractions but there is still a lack of integrated assessment of these issues. The
same is true for energy demand: reducing energy demand is seen as a mitigation
measure but energy demand can be strongly influenced by climate change with
changes in temperatures and consequent shifts in needs for heating and cooling.
4
Which is the most efficient option for reducing CO2 emissions under climate change
scenarios: strong investment on hydropower or investment in other technologies?
How can climate change affect energy demand? Does the projected increase in
cooling demand surpass the reduction in heating demand? How do energy supply
and demand relate under climate change scenarios and a CO2 constrained world?
These are some questions that require a quantitative assessment in order to better
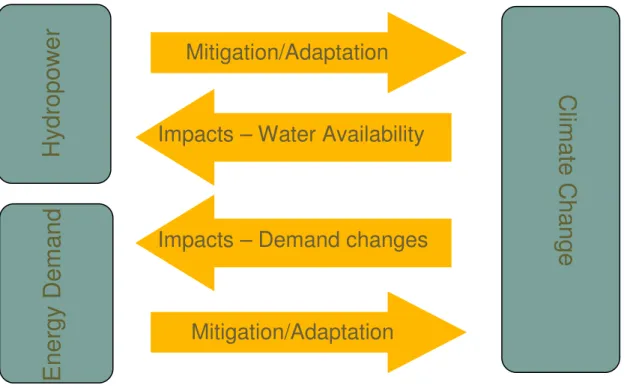
support policy decision in a highly uncertain future. Figure 1.1 represents a scheme
of the interactions between all these factors, which will be subject to evaluation
throughout the remaining of this work.
Figure 1.1 - Cross-effects between climate change, hydropower and energy demand
In order to evaluate these impacts and cross-effects a reasonable timeframe for
modelling has to be defined. On the one hand, long term analysis (2070-2100) is the
best option for evaluating climate change impacts since these are stronger on longer
periods; on the other hand, defining energy demand on the long term is an exercise
that requires defining scenarios that take into account different possibilities of
economical and social organization. In order to have useful results on the medium
Mitigation/Adaptation
Impacts – Water Availability
Impacts – Demand changes
Mitigation/Adaptation
C
lim
ate
C
ha
ng
e
H
yd
ro
po
w
er
E
ne
rg
y
D
em
an
term that could be used for present policy decisions it was decided to set as a target
the year 2050 as a compromise solution. This enables to evaluate some of the
impacts that are already expected for the year 2050 and derive, although with some
uncertainty, a reasonable evolution of useful energy demands (although this would
be far more accurate on the 2020-2030 timeframe).
Two key sectors of the energy system will be evaluated in the present work:
hydropower – since SIAM’s evaluation of impacts on this sector was not conclusive –
and energy demand in residential and commercial sector – since SIAM concluded
that this could be the most affected sector by climate change.
Regarding hydropower, traditionally, its design and policy have been based on the
assumption of stationary hydrology, regarding the principle that the past conditions
will remain to the future. This is confirmed in the PNBEPH which makes no reference
to future hydrological conditions under climate change. This assumption should be
revised, under climate change scenarios knowledge, in order to avoid excessive
costs or poor performance (Kundzewicz et al , 2007).
The ultimate objective of the presented work is the assessment of the impacts on the
Portuguese energy system due to climate change induced water availability
variations, with a special focus on the electricity production sector, coupled with the
evaluation of impacts on useful energy demand requirements under increasing
temperature scenarios. It is also an objective to evaluate the effectiveness of
currently planned hydropower capacity for Portugal and ultimately produce
recommendations that could be useful for policy in the decision-making process of
energy planning. It should be stressed out that it is not a main objective of this work
to present a forecast for 2050, but to define a reference scenario that could be
2. M
ETHODOLOGY
Evaluating the whole of the energy system is an enormous task due to feedbacks
between these system components (supply, demand and transformation). Most of
the evaluation of the EU energy policy targets has been carried out with powerful
modelling tools5 (Russ et al, 2007), which allow a comprehensive and integrated
approach of the impacts of the policy both in the energy system and macroeconomic
behaviour to these targets. One type of models used consistently in evaluating
energy systems, are the top-down models: these use microeconomic theory, under a
partial equilibrium, to assess changes under different scenarios, being exceptionally
detailed regarding the technological database. For the purpose of this work one such
model is used: TIMES_PT6 is a linear optimisation bottom-up technology model
generated with TIMES7 model generator. TIMES was developed by the ETSAP
(Energy Technology Systems Analysis Programme) of the IEA (International Energy
Agency). The generic model structure can be adapted to simulate a particular energy
system, which may be local, national or multi regional. TIMES models are widely
used to evaluate the impact of energy and environment policies and to perform
technological assessments (Tosato, 2006).
The first step of the methodology included the enhancement of the TIMES_PT model
technology database regarding hydropower plants. Inputs for TIMES_PT (availability
factors for hydropower and useful energy demand in residential and commercial
5
For a broader picture on types of models used to assess climate change costs see the third IPCC assessment report, Working Group III: Mitigation – Cost Methodologies
6 The implementation of the TIMES model for Portugal has been undertaken within the several EU research project NEEDS – New Energy Externalities Developments for Sustainability (www.needs-project.org) and RES2020 - Monitoring and evaluation of the RES directives implementation in EU27 and policy recommendations for 2020 (www.res2020.eu) and national funded projects such as E2POL - Integrated Environmental and Energy Policies (http://air.dcea.fct.unl.pt/projects/e2pol/) and PortugalClima2020 – Avaliação do impacto da Proposta Energia-Clima da CE para Portugal [Impact
evaluation of the EU climate and energy package in Portugal] (www.maotdr.gov.pt).
sectors) were then changed accordingly to each climate change scenarios and
ultimately a comprehensive analysis of the different scenarios results was performed.
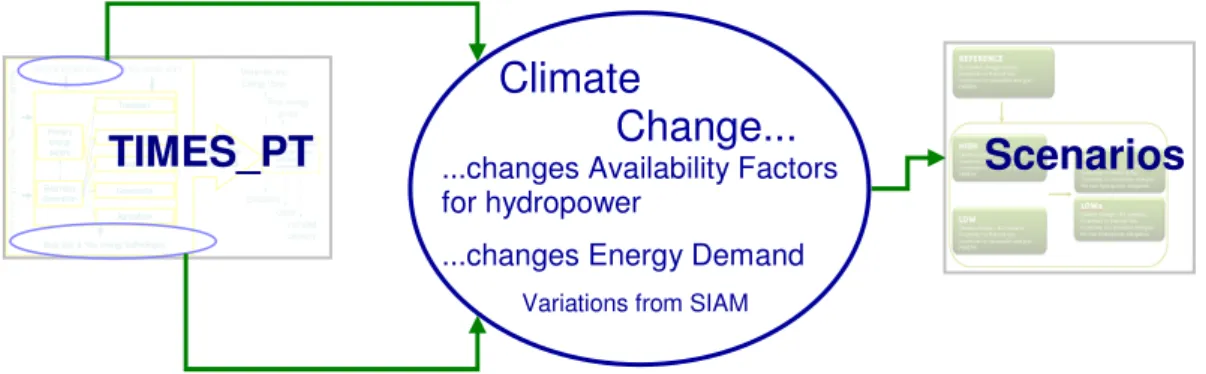
Figure 2.1 shows the wide structure of the methodology. Each step will be carefully
detailed in this section.
Figure 2.1 - Generic methodology to assess climate change impacts on the Portuguese energy system
2.1. TIMES_PT model
The ultimate objective of a TIMES model is the satisfaction of the energy services
demand at the minimum system cost and complying with a series of internal
restrictions which express the physical and logical relationships that must be satisfied
in order to properly depict the associated energy system (e.g. commodity balance -
Gasoline consumed by vehicles plus gasoline exported to other regions must not
exceed gasoline produced from refineries plus gasoline imported from other regions).
Besides the internal restrictions the user can also set the so-called user constraints
that define, for instance, political goals or resources potential (e.g. total emissions of
CO2 must not exceed a certain amount or total installed capacity of hydropower must
not exceed 9 GW). For reaching the objective function (satisfying energy demand at
the minimum system cost) complying with the restrictions, TIMES simultaneously
decides on equipment investment and operation, primary energy supply and energy
trade, according to the equation 1 (Loulou et al, 2005a).
Climate
Change...
Primary energy supply Electricity Generation Transport Industry Residential Commercial Agriculture F u e l im p or t p ri c es Demand project ions
Base year & Newenergy technologies
P ri m ar y en er gy p o te nt ia l
Policy const raints
Minimise total system costs Emissions Costs Final energy prices Materials and Energy flows Optimal combination of energy supply
and demand technologies
Installed capacity
...changes Availability Factors for hydropower
...changes Energy Demand
Variations from SIAM
(1)
NPV: net present value of the total costs ANNCOST: Total annual cost
d: general discount rate r: region
y: years
REFYR: reference year for discounting YEARS: set of years for which there are costs
For each year, the TIMES model computes the discounted sum of the annual costs
minus revenues. In the case of TIMES_PT, both investment costs and fix and
variable operation and maintenance costs of the energy supply and demand
technologies are considered. Energy taxes are also included in the model, namely
the ISP which is the tax on oil products and other energy carriers and is differentiated
by energy carrier. The revenues usually considered within TIMES models include
subsidies, recuperation of sunken material and salvage value. However, these are
not included in TIMES_PT. More information on TIMES development and equations
can be found in Loulou et al (2005a and 2005b).
2.1.1.
TIMES_PT Model structure
TIMES_PT represents the Portuguese energy system from 2000 to 2050. The
following sectors are modelled: primary energy supply; electricity generation;
industry; residential; commercial; agriculture, and transport. Energy, materials and
monetary flows, energy demand and supply technologies are modelled in detail,
including mass balances. The model structure for the Portuguese system, presented
in Figure 1, was adjusted from the model structure developed under the NEEDS8
project.
Primary energy supply Electricity Generation Transport Industry Residential Commercial Agriculture F u e l im po rt p ri c e
s Demand project ions
Base year & Newenergy technologies
P ri m ar y en er gy p o te nt ia l
Policy const raint s
Minimise total
system costs
Emissions Costs Final energy prices Materials and Energy flows Optimal combination of energy supplyand demand technologies
Installed capacity
Figure 2.2 - TIMES_PT scheme of the model structure (Source: Simões et al, 2008)
The implementation of TIMES_PT is supported by a detailed database, with the
following exogenous inputs: (1) end-use energy services and materials demands,
such as residential lighting, machine drive requirements or steel; (2) characteristics of
the existing and future energy related technologies, such as efficiency, stock,
availability, investment costs, operation and maintenance costs, or discount rate; (3)
present and future sources of primary energy supply and their potentials; and (4)
policy constraints, such as emission ceilings or energy taxes.
The TIMES_PT model finds the optimum combination of energy supply and demand
technologies to satisfy the demand, i.e. the model designs an energy system with the
lowest possible total costs. Thus, the main model outputs include the installed
capacity of the different technologies, its greenhouse gas emissions, primary and
final energy and material flows, final energy prices and, as mentioned, overall system
costs.
It should be noted that TIMES_PT is a partial equilibrium model, and thus does not
model the economic interactions outside of the energy sector. Among other
limitations of these types of models, it does not assume technology R&D costs nor
in new, more efficient technologies, such as preferences motivated by aesthetics or
social status. The model assumes that stakeholders have perfect market foresight.
2.1.2.
Energy and materials demand projection
The demand projection of energy and materials is an essential input to the
TIMES_PT model since it is the driving force of the final demand which the model
has to supply. For the purposes of this work, demand evolution was basically
retrieved from the work done in the project PortugalClima2020 - Impact evaluation of
the EU climate and energy package in Portugal (MAOTDR, 2008) and is thoroughly
described in Fortes et al, 2008. Under this framework two different demand scenarios
were built: trend and change. The first has the assumption of moderate economic
growth and the latter assumes a higher economic growth and a more disruptive
economy with strong emphasis on a shift towards innovation and technology. For the
purposes of the work hereby presented, the trend scenario was taken since it
represents more adequately the basis for a reference scenario that could then be
changed in order to include climate change impacts on the energy system.
The broad methodology for calculating energy and materials projections was firstly
based on the macroeconomic scenarios prepared by DPP - International Relations,
Prospective and Planning Department of the Ministry of Environment, Territorial
Management and Regional Development (Ribeiro et al, 2008). From these scenarios
a set of comprehensive economic parameters were taken such as sectoral gross
added value (GAV), private consumption and gross national product. Each sector
had its specific methodology; For example, industry has the associated GAV as a
driver but associated with elasticities and residential sector has population and
household growth coupled with assumptions in increase in thermal comfort.
• Industry: i) quantities of steel, paper, glass, cement, lime, ammonia and
chlorine ii) Useful energy for the remaining industries (ceramics, chemical,
other industry)
• Residential: useful energy demand for hot water, cooling and heating, lighting,
cooking, refrigeration, cloth washing and drying, dish washing and other
electric appliances.
• Commercial: useful energy demand for hot water, cooling and heating,
lighting, public lightning, cooking, refrigeration and other electric appliances.
• Transport: passengers and freight transportation trough road, railway, aviation
and navigation expressed in pkm (passengers.kilometer) and tkm
(ton.kilometer)
The demand generated for PortugalClima2020 was only available until 2030,
therefore it was necessary to extrapolate it until 2050, since only in this period
climate change impacts begin to be noticeable9. The basic methodology to do so was
to apply the macroeconomic growth rate from 2020 – 2030 in the remaining period.
Although this simplified approach can introduce extra uncertainty to the energy
demand, it was out of the scope of the present work to develop new energy demand
from scratch.
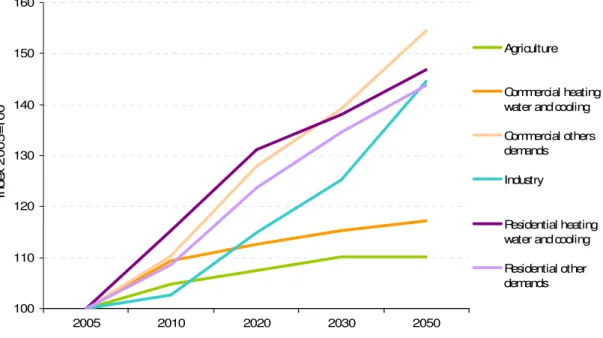
Figure 2.3 shows the aggregated results for demand growth in key sectors for the
scope of this work. Detailed data on final energy and materials demand for all sectors
and subsectors can be found in Annex I.
9
100 110 120 130 140 150 160
2005 2010 2020 2030 2050
In
de
x
2
0
0
5
=1
0
0
Agriculture
Commercial heating water and cooling
Commercial others demands
Industry
Residential heating water and cooling
Residential other demands
Figure 2.3 - Aggregated final energy and materials demand growth evolution (2005=100)
2.1.3.
Technology database (base year and new
technologies)
The energy supply and demand technologies for the base-year (2000) were
characterised considering the energy consumption data from EUROSTAT and the
official DGGE national energy balance to set sector specific energy balances to
which technologies profile must comply. Information on installed capacity, efficiency,
availability factor, and input/output ratio were introduced using diverse national
sources (IA, 2006a; CELPA, 2003; DGGE, 2005; EDP, 2002; EDM, 2005; ERSE,
2001; ERSE, 2006; IGM, 2000; INETI, 2003; INE, 2000; LIPOR, 2005; REN, 2005;
REN, 2006; SEIA, 2000; PEGOP, 2005; Turbogás, 2005; Valorsul, 2005). This was
followed by a bottom-up approach that adjusted the technologies specifications to
achieve coherence with official energy statistics. This bottom-up approach was very
relevant for the residential and commercial sectors, for which there is less detailed
The energy supply and demand technologies beyond the base year are compiled in
an extensive database with detailed technical and economic characteristics of new
energy technologies. Some examples for the electricity and the transport sector of
the available technologies are given to reflect the detail underlying on such a
database:
• Electricity & Heat sector – 89 technologies:
o 34 different CHP (Combined Heat and Power) technologies reflecting
different fuel inputs, capacity sizes and boiler/turbine types (E.g.
hydrogen solid oxide fuel cell, biomass integrated gasification
combined cycle)
o 55 centralized power plants (E.g. combined cycle natural gas,
geothermal hot dry rock, concentrating solar power, coal integrated
gasification combined cycle with CO2 sequestration, wind off-shore,
wave energy)
• Transport sector 83 different technologies (from gasoline engines to hybrid
cars to gaseous or liquid hydrogen fuel cell cars) with specifications on use
(long distance, short distance) and mode (bus, car, motorcycle, truck,
passengers train, freight train, aviation, navigation)
This was developed within the NEEDS project and validated with Portuguese
stakeholders for industry, electricity generation, and solar technologies. The
validation of the database for the Portuguese case implied also significant changes to
the original NEEDS database on new technologies, adding specific technologies that
are quite reasonable on the long term for Portugal (e.g. solar heat for industry) but
were not considered under the NEEDS project due to the European scale and
framework.
TIMES_PT modelling of end-use of energy services and material requires to
data sources were used: data from CIEMAT10, within the NEEDS project (REE, 1998;
MITYC, 2003); National Inventory Report on GHG (IA, 2006b); national studies on
renewables (Gonçalves, et al., 2002a e 2002b) and on electricity end-use (Júlio, S. et
al., 1997; DGGE/IP-3E, 2004); and the PNAC energy demand scenarios. For the
residential sector the load diagram data developed by ADENE the National Energy
Agency was used (Enertech et al., 2002). The Spanish load diagram data (REE,
1998) was adopted for the commercial sector since there is no Portuguese specific
data. Because it was not possible to breakout the energy demand according to the
load diagram for industry and transport due to the lack of information, the model does
not consider seasonal or daily demand variations for these sectors.
2.1.4.
Endogenous Primary Energy Potentials and
Energy Import Prices
For Portugal endogenous primary energy potential solely relate to renewable energy.
No fossil fuel is currently being retrieved and it is not expected that it will happen. For
the modelling exercise this is quite irrelevant since, even if new fossil reserves are to
be found, they should not influence primary energy prices because the contribution
would be insignificant. The same does not apply for renewable energy sources which
have physical, technical, land occupation or environmental constraints. This must
defined in the model to allow for a reasonable use of renewable energy. For instance,
wind energy has strong limitations related to wind speed and land-use. In order to
determine the potential for each technology or resource a large number of studies
were compared. For most resources the potential is given not only having in mind the
technical potential but also possible deployment of technologies in the near future.
For technologies for which the technical potential is virtually unlimited (e.g.
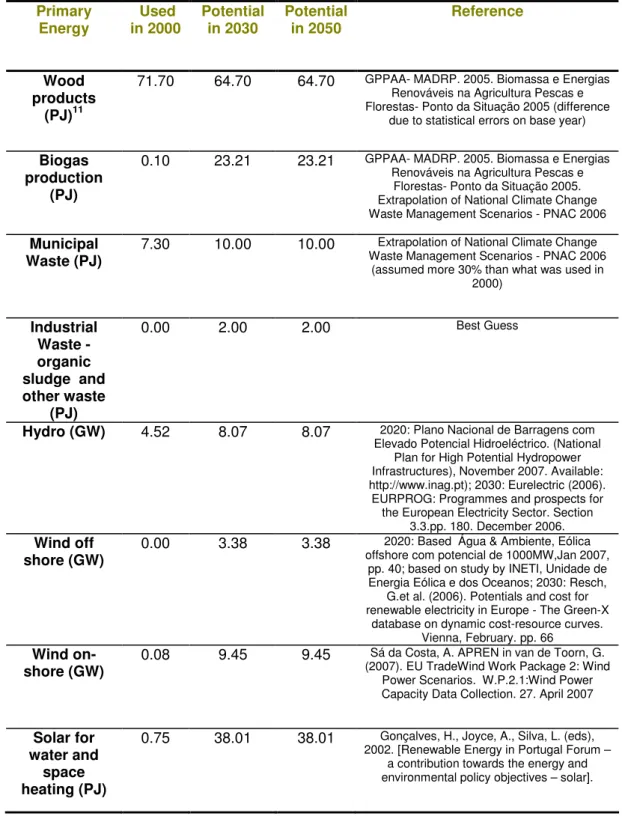
system free to deploy as much as needed. Table 2.1 shows primary energy
endogenous potential for 2030 and 2050 and respective source.
Table 2.1 – Primary energy endogenous potentials
Primary Energy Used in 2000 Potential in 2030 Potential in 2050 Reference Wood products (PJ)11
71.70 64.70 64.70 GPPAA- MADRP. 2005. Biomassa e Energias Renováveis na Agricultura Pescas e Florestas- Ponto da Situação 2005 (difference
due to statistical errors on base year)
Biogas production
(PJ)
0.10 23.21 23.21 GPPAA- MADRP. 2005. Biomassa e Energias Renováveis na Agricultura Pescas e
Florestas- Ponto da Situação 2005. Extrapolation of National Climate Change Waste Management Scenarios - PNAC 2006
Municipal Waste (PJ)
7.30 10.00 10.00 Extrapolation of National Climate Change Waste Management Scenarios - PNAC 2006
(assumed more 30% than what was used in 2000)
Industrial Waste - organic sludge and other waste
(PJ)
0.00 2.00 2.00 Best Guess
Hydro (GW) 4.52 8.07 8.07 2020: Plano Nacional de Barragens com
Elevado Potencial Hidroeléctrico. (National Plan for High Potential Hydropower Infrastructures), November 2007. Available: http://www.inag.pt); 2030: Eurelectric (2006).
EURPROG: Programmes and prospects for the European Electricity Sector. Section
3.3.pp. 180. December 2006. Wind off
shore (GW)
0.00 3.38 3.38 2020: Based Água & Ambiente, Eólica offshore com potencial de 1000MW,Jan 2007,
pp. 40; based on study by INETI, Unidade de Energia Eólica e dos Oceanos; 2030: Resch,
G.et al. (2006). Potentials and cost for renewable electricity in Europe - The Green-X
database on dynamic cost-resource curves. Vienna, February. pp. 66 Wind
on-shore (GW)
0.08 9.45 9.45 Sá da Costa, A. APREN in van de Toorn, G. (2007). EU TradeWind Work Package 2: Wind
Power Scenarios. W.P.2.1:Wind Power Capacity Data Collection. 27. April 2007
Solar for water and
space heating (PJ)
0.75 38.01 38.01 Gonçalves, H., Joyce, A., Silva, L. (eds), 2002. [Renewable Energy in Portugal Forum –
a contribution towards the energy and environmental policy objectives – solar].
11 A supply curve for biomass import was built with the following assumptions: 20 PJ could be imported
Primary Energy Used in 2000 Potential in 2030 Potential in 2050 Reference Solar thermal for electricity generation (GW)
0.00 2.40 Unlimited 2005. (REN, Coimbra University). CISEPI: Caracterização de Soluções de Integração Sustentada de Elevados Níveis de Produção Intermitente [Characterisation of Solutions of High Levels of Intermittent Production woth
Integrated Sustainability]; 2007. (REN, Coimbra University). EFIPRE - Eficiência energética e integração sustentada de PRE. [Energy efficiency and sustainable integration
of special regimen production] Geothermal
(GW)
0.01 0.05 0.05 2010: Extrapolation based on Gonçalves, H., Joyce, A., Silva, L. (eds), 2002. [Renewable
Energy in Portugal Forum – a contribution towards the energy and environmental policy objectives – Geothermal]. 2020 = 2030: Expert
Guess (assumed more 75% from 2010 )
Waves (GW) 0.00 5.00 5.00 2020: 2005. (REN, Coimbra University).
CISEPI: Caracterização de Soluções de Integração Sustentada de Elevados Níveis de
Produção Intermitente [Characterisation of Solutions of High Levels of Intermittent Production woth Integrated Sustainability]; 2007. (REN, Coimbra University). EFIPRE - Eficiência energética e integração sustentada
de PRE. [Energy efficiency and sustainable integration of special regimen production]; 2030: Cruz, J., Sarmento, A. (2004). Energia
das Ondas - Introdução aos aspectos tecnológicos, económicos e ambientais.
Instituto do Ambiente. D.L. 5/2008 Photovoltaic
(GW)
0.00 9.30 Unlimited 2005. (REN, Coimbra University). CISEPI: Caracterização de Soluções de Integração Sustentada de Elevados Níveis de Produção Intermitente [Characterisation of Solutions of High Levels of Intermittent Production woth
Integrated Sustainability]; 2007. (REN, Coimbra University). EFIPRE - Eficiência energética e integração sustentada de PRE. [Energy efficiency and sustainable integration
of special regimen production]
Energy import prices are a crucial input to every regional energy model. The most
up-to-date and consensual data (Table 2.2) comes from IEA in their publication
“World Energy Outlook 2007 - China and India Insights” (IEA, 2007). In this
publication two alternative international fossil fuels prices are assumed: reference
Table 2.2 – International energy price projections
Real Terms (2000 € prices) 2000 2006 2010 2015 2030 2050*
IEA Crude oil imports barrel 30.0 56.9 54.4 52.8 57.2 63.1
Natural Gas European imports m3 0.1 0.2 0.2 0.22 0.2 0.2
R
ef
er
en
ce
Sc
en
ar
io
OECD steam coal imports tonne 36.0 58.1 51.7 52.5 56.4 61.6
IEA Crude oil imports barrel 30.0 56.9 59.4 61.6 80.2 105.0
Natural Gas European imports m3 0.1 0.2 0.2 0.3 0.3 0.4
H
ig
h
G
ro
w
th
Sc
en
ar
io
OECD steam coal imports tonne 36.0 58.0 53.1 56.2 67.0 81.4 Source: World Energy Outlook, 2007 *2050 values extrapolated using 2015-2030 growth rates.
For the purposes of this work it was decided to use as an input the high growth
scenario prices which accounts for a high growth in China’s and India’s gross
domestic product on the time horizon and the introduction of predictable energy and
climate policies. This was considered as the most plausible scenario and the one that
fits with base assumptions made for energy and materials demand (see section
2.1.2)
2.2. Baseline assumptions, calibration and validation
The model was calibrated for the year 2000 and validated for 2000 and 2005, using
the official national energy balances. Model calibration required a set of restrictions:
1. To replicate evolution of electricity imports and exports - affected by
interconnection capacity with Spain - increasing maximum limits (imports +
exports) were set from 2000 to 2050, in tune with national transmission
operator studies (REN, 2008) for increased transmission capacity. Thus,
trade uncertainty under the liberalised Iberian electricity market is not
considered;
2. A maximum growth was set for new CHP plants in industry, based on
expectations. Thus, in 2001, 32% of all electricity consumed in industry was
from CHP, and in 2010 this figure will be 38%, 45% in 2020 and 50% in 2030.
These limitations on maximum CHP reflect real CHP constraints such as
geographical proximity of potential end-users of heat;
3. Following the past evolution of the energy profile of the residential,
commercial and agriculture, there will be no further penetration of coal in
these sectors;
4. Due to resistance to change, imperfect information, and aesthetics or other
subjective preferences it is assumed that the shift of some fuels is delayed in
the residential and commercial sectors by inertia factors. These were defined
a minimum value for the share of fuels on the final energy profile and take into
account: 2000 statistics share of fuels on final energy, lifetime of existing
technologies and increased use of electricity for comfort reasons.
5. The share of electricity has also minimum enforced in the residential and
commercial sectors following the general agreement (Aguiar et al, 2007) that
the convenience of use of this form of energy will increase its share even if
the price is higher than other alternatives.
6. Only 85% of the residential and commercial sector needs can be met with
natural gas, due to geographic and technical limitations (GALP, 2007);
7. No dedicated heat power plants will be implemented – all heat will be
produced with CHP - and all new CHP plants are associated with specific
demand sectors such as refining, industry, commercial or residential. This
follows the current and planned CHP promoting policy.
Besides the above assumptions, the most relevant Portuguese energy policies in
place were introduced as follows:
1. A ban on nuclear power due to the political unacceptability of this option in the
2. Incentives to natural gas combined cycle power plants following the energy
sources diversification policy and support to use of natural gas. This is
modelled as a minimum installed capacity of at least 3200 MW from 2010 to
2030;
3. New coal power plants will only be available from 2015 onwards following
energy sources diversification policy and support to use of natural gas;
4. It is assumed that “conventional” coal power plants without sequestration will
not be implemented from 2015 onwards, following expected GHG control
policies;
5. Electricity generation from wood residues will continue at least until the end of
the lifetime of plants existing in the year 2000 following forest fire control
policies objectives;
6. A minimum of 1.1 GW installed capacity of wind onshore is set up in 2005,
following the existing feed-in-tariffs for renewable electricity, although this is
not included in the costs of renewable electricity generation technologies in
TIMES_PT. This represents 9% of total 2005 installed capacity of 13.55 GW;
7. In 2010 biofuels consumption will be at least 10% of the consumed diesel and
gasoline in transport, following the Directive 2003/30/EC - on the promotion of
the use of biofuels or other renewable fuels for transport and national policy
targets;
8. The tax on energy products, differentiated according to the energy carriers,
Table 2.3 – Tax on energy products, according to energy carriers
Tax on energy products (€/PJ) Energy carriers
2001 2005 2010-2050
Coal – RCA, supply & industry - 0.15 0.16
Coal – electricity & CHP - - -
Oil– residential & commercial 6.68 2.48 3.73
Oil – electricity & CHP - - -
Oil - agriculture 1.63 2.11 2.78
Oil - industry 0.69 0.38 0.38
Gas – RCAa, supply & industry 0.20 - -
Gas – electricity & CHP - - -
Gas - transport 0.20 2.60 2.72
LPG – RCA & industry 0.16 1.58 0.69
LPG - transport 8.70 4.52 6.82
Diesel - agriculture 8.98 11.48 14.22
Diesel - transport 6.68 8.54 10.58
Gasoline - transport 11.46 18.04 20.57
Biofuels12 - transport 8.98 11.48 14.22
Kerosene – transport - - -
Heavy fuel oil - transport - - -
Naphtha - industry - - -
Biomass – all sectors - - -
Electricity – all sectors - - -
2.3. A zoom on hydropower modelling
Technology Specifications
For the purposes of the work here presented, TIMES_PT was enhanced with a better
technological database in what concerns hydropower infrastructure, in order to
ensure a detailed analysis of each of the new hydropower plants. Prior to this work,
TIMES_PT had a simplified approach to this sector assuming installed capacity in
2000 (categorized by run-off-river and dam including mini-hidro). Additional capacity
was possible by investment in new plants for which technical and economical
characteristics were derived from an “average” European hydropower plant as used
in the NEEDS project, adapted with data from existing power plants. For assessing
total energy system evolution this simplified approach could deliver good results but
this no longer applies when the focus is on this specific sector. The projected
hydropower investments included in PNBEPH have technical and economical data
that largely differs from existing ones in Portugal and from a theoretical “average”
European hydropower plant; hence that new data was included.
All the selected dams considered in the PNBEPH were introduced into the model (as
well as projects being implemented) and two extra generic technologies were
introduced:
• Refurbish – this allows for the maintenance of current installed capacity
although providing an associated cost of refurbishment instead of simply
assuming that installed capacity will remain with no extra cost.
• Generical – this allows for the model to achieve, if necessary, the total hydro
potential (as defined in section 2.1.2) since selected PNBEPH investments
plus projects being implemented stay below that potential.
Existing hydro capacity (roughly 4.95 GW in 2007) was kept constant throughout the
modelled time horizon, although assuming some refurbishment as plants reach the
end their useful lifetime. This assumption comes from the fact that, having in mind
past trends and future options, it is not reasonable that existing large hydropower
plants will be decommissioned. Existing capacity also aggregates mini-hydro (<10
MW electrical installed capacity) which was not modelled in detail, and increased
capacity in the period 2000-2010 was included in the refurbishment category. Figure
2.4 represents the maximum full capacity (having in mind that the full potential cannot
be reached in a short term) that the model can chose to implement divided into four
categories: existing capacity (existing+refurbishment); projects being implemented;
0 2 4 6 8
2000 2010 2020 2030 2040 2050
In
st
al
le
d
Ca
pa
ci
ty
(G
W
)
Generical
PNBEPH
Being Implemented
Existing+Refurbished
Existing (2000)
Figure 2.4 - Maximum feasible hydro capacity installation
Technical and Economic Data Sources
TIMES_PT uses, as inputs for economical data of hydro plants, fixed operation and
maintenance costs (O&M) and investment costs. For existing hydropower,
investment costs are redundant information; O&M data was taken from the NEEDS
project and validated by national stakeholders. For projects being implemented, all
the data was taken from EDP (www.edp.pt) and PNBEPH (INAG, 2007) was the
source for all the new dams. Due to lack of data, it was assumed that refurbishing
plants would have an investment cost similar to the cheaper new dam. For the so
called “generic” dam it was assumed that costs associated with this technology are at
least equal to the costs of the most expensive technology selected in PNBEPH. This
assumption reflects the fact that extra dams besides the selected ones in PNBPEH,
should have added costs related to either environmental, land-use, social acceptance
or other constraints.
As for technical data for hydropower plants, one of the critical parameters is the
electricity output and total possible electricity output if the technology ran at full
capacity during a defined timeslice (annual, seasonal, day, night or peak).
Annual availability factors were defined with data from REN - National Energy Grids
(www.centrodeinformacao.ren.pt) for existing hydropower plants. For the new
hydropower plants, availability factor sources are the same as for the economical
data. It was assumed that generical power plants should have an availability factor
equal to one representative element of the new power plants from PNBEPH. Vidago
hydropower was chosen being the one that is nearer to the average value.
As previously mentioned, timeslice definition may be charaterized between
day/night/peak and seasons. For the purpose of hydropower modelling it is crucial to
define different availability factors for each season, since hydroelectric production
strongly depends on water runoff and precipitation and the latter one differs
significantly between annual seasons. Annual availability factor split per season was
defined according to REN statistics (www.centrodeinformacao.ren.pt) on electricity
production and differently split between Run-of-River (RoR) and Dams for existing
power plants. This split share was used as a proxy for all the new power plants also.
Remaining technical parameters are “Lifetime” which reflects useful lifetime of
technologies (data from NEEDS) and “Start Year” which sets the year from which the
technology is available for the model. It does not reflect the year the technology is
implemented but when it can be implemented.
Table 2.4, on the next page, systematizes the data collected and introduced into the
Table 2.4 – Economical and technical data for each hydropower plant
Technology Description
Type Start Lifetime Capacity Fixed
O&M costs
Investment Costs
Maximum Availability Factor Annual
Maximum Availability Factor Fall
Maximum Availability Factor Summer
Maximum Availability Factor Spring
Maximum Availability Factor Winter
Years GW €/kW €/kW
Foz Tua Dam 2015 0.23 9.1 756 0.17 0.13 0.09 0.15 0.27
Padroselos Dam 2015 0.11 9.6 893 0.10 0.08 0.06 0.09 0.17
Vidago Dam 2015 0.09 13.1 1178 0.14 0.12 0.08 0.13 0.24
Daivões Dam 2015 0.11 14.4 1323 0.15 0.12 0.09 0.14 0.25
Fridão Dam 2015 0.16 9.6 821 0.21 0.17 0.12 0.19 0.34
Gouvães Dam 2015 0.11 8.8 922 0.16 0.13 0.09 0.14 0.26
Pinhosão Dam 2015 0.08 13.2 1422 0.16 0.13 0.09 0.14 0.26
Girabolhos Dam 2015 0.07 14.2 1415 0.16 0.13 0.09 0.14 0.26
Almourol RoR 2015 0.08 15.4 1229 0.31 0.26 0.16 0.38 0.44
Alvito Dam 2015 0.05 14.0 1385 0.15 0.12 0.08 0.13 0.24
Picote II Dam 2010 0.23 12.1 584 0.12 0.10 0.07 0.11 0.19
Bemposta II Dam 2010 0.18 12.1 730 0.10 0.08 0.06 0.09 0.17
Alqueva II Dam 2010 0.13 12.1 1154 0.00 0.00 0.00 0.00 0.00
Baixo Sabor Dam 2010 0.17 12.1 2171 0.17 0.13 0.09 0.15 0.27
Ribeiradio Dam 2010 0.07 12.1 1029 0.16 0.13 0.09 0.15 0.27
Generical Dam 2010 N/A 15.4 1422 0.14 0.12 0.08 0.13 0.24
Refurbish Dam/RoR 2001 N/A 9.0 577 0.32 0.27 0.17 0.35 0.50
Existing Dam Dam 2000 1.77 9.0 577 0.32 0.26 0.18 0.29 0.53
Existing RoR RoR 2000
70
2.4. Scenarios Definition
2.4.1.
Hydro Availability Scenarios
The hydro availability scenarios were based on the work published under SIAM
(Climate Change in Portugal: Scenarios, Impacts, and Adaptation Measures) by the
working group on Water Resources (Santos et al, 2002 and 2006). Under this
framework, two contrasted IPCC scenarios were chosen for hydro availability
scenarios evaluation: A2 and B2. Scenario B2 assumes a return to smaller regional
communities, with weaker international links, where the resolution of social problems
takes precedence over economical development. Scenario A2 assumes a world
increasingly global with a strong economical activity and with diminishing
environmental concerns (Cunha et al, 2005). These two scenarios allow assessing
the complete range of predictable effects of climate change on hydro resources, with
special focus on water run-off. For the purpose of this work, the two hydro scenarios
will also be referred as A2 - higher impact of climate change on water availability –
and B2 – lower impact of climate change on water availability.
The climatic model chosen, within SIAM, was the GCM HadCM3 developed by the
Hadley Centre for Climate Prediction and Research. Water runoff was estimated
using the Temez model (Santos et al, 2002 and 2006). Results are disaggregated in
five regions: ND – North of Douro, D – Douro, SD – South of Douro, T – Tejo, G -
Guadiana; and four seasons: Spring, Winter, Summer and Fall. Although TIMES_PT
allows the split across year fractions it does not account for spatial distribution, hence
a weighted national average value was considered. Because hydroelectric installed
capacity is very different between these three regions (Table 2.5), the impact on
hydro availability for electricity production was weighted according to the shares of
Table 2.5-Water runoff variability (%) in 2050 per region and season
Water runoff variability in 2050 (%)
N SD T G Average Water Weighted Runoff Variability
Winter 20 25 27 27 22
Spring -8 0 17 10 -3
Summer -33 -40 -30 -33 -33
S
ce
na
rio
B
2
Fall -25 -7 -3 55 -16
Winter -3 -25 -28 -52 -11
Spring -20 -26 -26 -68 -24
Summer -50 -50 -50 -68 -51
S
ce
na
rio
A
2
Fall -33 -28 -27 -22 -31
Installed Capacity 2961 MW 458 MW 484 MW 240 MW
(ND – North of Douro, D – Douro, SD – South of Douro, T – Tejo, G – Guadiana). Adapted from SIAM (Santos et al, 2002 and 2006)
A simplified approach was adopted by assuming that the share of installed capacity
by region remains the same throughout the modelling horizon. Since this share per
region is roughly similar to the projected investments of the PNBEPH - National Plan
for High Potential Hydropower Infrastructures (INAG, 2007) this simplification will not
introduce significant errors. Using water run-off variations as a proxy, the new data
on water availability was introduced in 2050 and linearly interpolated between 2020
and 2050.
Simply using water run-off variations as a proxy for water availability on hydropower
dams, could introduce significant errors since other factors should be accounted for,
such as competition over the use of water (for irrigation for instance) and specific
characteristics of the water basins. Hence these results were compared with the
ones found on (Lehner et al, 2005). Using a model based analysis of the hydropower
potential in Europe, the authors evaluate impacts of precipitation changes due to
climate change on electricity production from dams including evaluation of impacts
on developed hydropower potential, gross hydropower potential and water
competition with other uses. Results suggest that hydropower electricity production Season
could be reduced from -22% to -40% in 2070, which seems coherent with annual
reduced availability factors of -8% and -29% (on a annual basis) assumed in the
present work for 2050.
2.4.2.
Energy Demand Scenarios under Climate Change
Climate Change can strongly impact demand for heating and cooling in residential
and commercial sectors. Therefore it was necessary to adapt demand projections
referred to in section 2.1.2 in order to have consistency between climate change
scenarios for hydro availability and the demand scenarios. Hence, the same general
procedure was adopted as in the case of hydro availability scenarios, by selecting the
two contrasting scenarios (A2 and B2), for which impacts on energy demand were
also determined within SIAM’s assessment. The variation on the demand due to
climate change was then applied to the demand generated for TIMES_PT.
SIAM’s impacts on energy demand are often referred as “long range” (Santos et al,
2002 and 2006) and, although no specific date is defined, a rise in 3-4ºC is
suggested as a driving force. This could hamper the direct transposition of these
impacts to TIMES_PT for which the time horizon is 2050 if projected impacts in SIAM
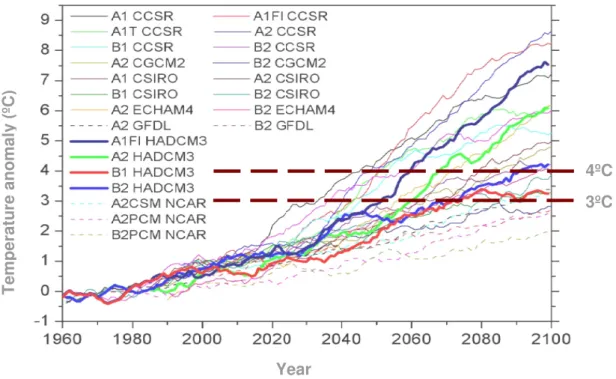
happened long after this time horizon. Looking at mean temperature anomalies in the
Iberian Peninsula obtained with the GCM – Global Circulation Models - data available
at the IPPC DDC - data distribution centre (Figure 2.5), it is possible to observe that
the 3-4ºC range is likely to be reached in 2050 although most models point to values
slightly below 3ºC. Therefore applying the differential SIAM impact to the estimated
demand in TIMES_PT might result in slightly overestimated impacts. Even so, these
data was used since it is the best available, therefore results should be analysed with
caution. It was assumed that only after 2020 climate change impacts start to become
visible since until then if some temperature rise occurs it will be meaningless
compared to the growing needs of useful energy derived from economical expected
Figure 2.5 – Mean temperature anomaly in the Iberian Peninsula obtained with the Global Circulation Models data available at the IPCC data distribution Centre (source: Santos et al,
2006)
It should be noted that methodologies for demand projections used for SIAM are not
fully consistent, as detailed below, with those used for TIMES_PT in absolute terms.
However, it was assumed that the relative impact of Climate Change on the demand
could be used on top of TIMES_PT demand. Furthermore having different demands
has a two-fold objective: firstly, and already mentioned, to consider a consistent
energy demand with the climate change scenario analysed; secondly to provide a
range of energy demands and therefore provide also some sensitivity analysis
(although not fully examined since it will be consistent with the scenario analysed and
not evaluated on an individual basis). A full sensitivity analysis would require
changing only the demand and checking the impacts on results.
SIAM has identified possible impacts of climate change for water heating, space
heating and space cooling both for the residential and commercial sector,
disaggregated for North, South and Centre regions of Portugal.
The broad methodology used in SIAM included the selection of representative
technologies, type of buildings and end-uses, and the calculation of energy
T
e
m
p
e
ra
tu
re
a
n
o
m
a
ly
(
ºC
)
Year
4ºC
consumption to maintain a specific thermal comfort range. Although assumptions
were made, for each socioeconomic scenario, on some parameters like time period
spent in houses, the occupancy rate, insulation level, etc. the results are based on
theoretical energy requirements to achieve comfort and not actual energy used as in
TIMES_PT. The different methodologies lead to different base demands of the
respective reference scenarios to which climate change variations will be applied.
After defining the energy demand for each scenario, changes in temperature
parameters due to climate change were then applied to derive the new energy
demand with climate change impacts. The estimated impacts for each end-use
energy demand for the commercial and residential sectors are presented in Table
2.6.
Table 2.6 – Estimated variation (%) to the reference energy demand for the two climate change scenarios (A2 and B2) – Source – adapted from SIAM (Santos et al, 2002 and 2006)
Unit-% North Centre South Average
Scenario B2 A2 B2 A2 B2 A2 B2 A2
Water Heating -9 -13 -11 -16 -13 -18 -11 -16 Space Heating -75 -52 -100 -67 -100 -81 -92 -67
R
es
id
en
tia
l
Space Cooling +118 +377 +84 +206 +52 +136 +85 +240 Water Heating -9 -13 -11 -16 -13 -18 -11 -16 Space Heating -60 -70 -52 -62 -45 -61 -52 -64
C
om
er
ci
al
Space Cooling +34 +66 +38 +60 +112 +161 +61 +96
It is possible to observe that a strong decrease in heating demand is forecasted
opposed to a strong increase in cooling demand, reflecting the expected rise in
temperatures. In the residential sector it is also possible to see a stronger decrease
in demand in the B2 scenario (-92% versus -67% on A2). This might seem
counterintuitive, since A2 implies a higher increase in temperatures, but there are
other differences between the scenarios that lead to this. In fact, residential demand