Hugo Gonzaga Parente Miguel
A Dissertation presented in partial fulfillment of the Requirements for the Degree of
Master in Telecommunications and Computer Engineering
Supervisor:
Doctor Pedro Nogueira Ramos, Associate Professor ISCTE-IUL
Co-Supervisor:
Doctor Susana da Cruz Martins, Assistant Professor ISCTE-IUL
i
Abstract
One of the most widely researched questions about higher education focuses on exposing paths that lead to academic success. This dissertation provides a tool aligned with the scientific contributions to the concept of success in higher education, as well as the implementation of a system capable of automatic generation of SQL queries based on high level constraints. It includes the use of students' data contained in the ISCTE-IUL University Fénix system in a web application, to assist analyzes and researches. Providing relevant data for consultation can offer a differentiated explanation of the pathways of success in higher education and identify problems and failures to support more effective intervention measures later.
Keywords – Higher education, academic success, information systems, data presentation, web application.
iii
Resumo
Uma das questões mais discutidas sobre ensino superior foca a descoberta de caminhos e padrões que levem ao sucesso académico. Esta dissertação fornece uma ferramenta alinhada com as contribuições científicas em relação ao conceito de sucesso no ensino superior, bem como a implementação de um sistema capaz de gerar automaticamente consultas SQL com base em restrições de alto nível. Inclui o uso dos dados dos alunos contidos no sistema Fénix da Universidade ISCTE-IUL numa aplicação web, de forma a auxiliar análises e investigações. Ao disponibilizar dados relevantes para consulta, pode fornecer uma explicação diferenciada dos caminhos de sucesso no ensino superior, bem como identificar problemas e falhas, para apoiar medidas de intervenção mais eficazes posteriormente.
Palavras-chave – Ensino superior, sucesso académico, sistemas de informação, apresentação de dados, aplicação web.
v
Acknowledgments
First, I would like to thank my Supervisor Doctor Pedro Ramos and my Co-Supervisor Doctor Susana da Cruz Martins, for all the trust and support provided during the thesis, as well as the research project.
Special thanks to ISCTE-IUL, more specifically, to the Rector Maria de Lurdes Rodrigues for the research grant funded for this project.
To the Information Sciences and Technologies and Architecture Research Center (ISTAR-IUL), unit where part of the project was developed.
To all teachers and staff who agreed to cooperate in the interviewing process.
To the ISCTE-IUL Informatics and Communications Infrastructure Service (SIIC), especially to António Casqueiro, who was responsible for providing and framing the imported information system.
And last but not least, a very special thank you to all family, friends and colleagues for all the motivation and support.
vii
Contents
Abstract ... i Resumo ... iii Acknowledgments ... v Contents ... vii List of Figures ... xList of Tables ... xii
List of Acronyms ... xiii
Chapter 1 – Introduction ... 1 1.1. Motivation ... 1 1.2. Context ... 1 1.3. Research Question ... 2 1.4. Objetive ... 3 1.5. Research Method ... 3
Chapter 2 – State of art ... 5
2.1. Theoretical Perspectives, Definitions, Indicators ... 5
2.1.1. What is academic success? ... 5
2.1.2. Indicators ... 6
2.1.2.1. Educational Indicators ... 6
2.1.2.2. Models and Frameworks as guides for indicators systems ... 7
2.1.3. Review of Developed conceptual models ... 8
2.1.3.1. York, Travis et al. (2015) ... 8
2.2. Using Data to Improve Academic Success Studies ... 10
2.2.1. Academic Information systems ... 11
2.2.1. Variables used in academic success case studies ... 13
2.2.2. The Impact of IT’s Application on Academic Success ... 14
2.2.3. Existing platforms of data presentation and analysis ... 15
2.2.3.1. DGEEC ... 15
2.2.3.2. PORDATA ... 17
2.2.3.3. Eurostat ... 19
Chapter 3 – Requirements gathering ... 23
3.1. Interview process ... 23
3.1.1 Interviews' outcomes ... 23
3.1.2. What data is needed? ... 26
3.2. Data selection process ... 27
viii
4.2. Secondary database conception ... 41
4.2.1.1. Final result of Class Diagram ... 41
4.2.1.2. Final result of Relational Model ... 42
4.3. Databases implementation ... 44
Chapter 5 – The platform ... 45
5.1. Requirements analysis ... 45
5.2. System design ... 46
5.2.1. UML Use case diagram ... 46
5.2.1.1. Use case ... 46
5.2.1.2. Actors ... 47
5.2.1.3. Final result of Use Case diagram ... 47
5.2.1.4. Use cases description ... 48
5.2.2. System architecture... 49
5.3. System implementation ... 50
5.3.1. System front-end and back-end ... 50
5.3.2. Before login UI ... 52 5.3.2.1. About page ... 53 5.3.2.2. Mission Page ... 53 5.3.2.3. Team page ... 54 5.3.2.4. Login page ... 54 5.3.2.4.1. Form rules ... 55 5.3.2.4.2. Login submission ... 56 5.3.2.4.2.1. Login failure ... 56 5.3.2.4.2.2. Login successful ... 57 5.3.3. After login UI ... 58 5.3.3.1. Macrodata ... 58 5.3.3.1.1. Macrodata front-end ... 58 5.3.3.1.2. Macrodata back-end ... 60
ix
5.3.3.2. Free query ... 61
5.3.3.2.1. Free query front-end ... 61
5.3.3.2.2. Free query back-end ... 65
5.3.3.3. Metadata ... 67
5.3.3.3.1. Metadata front-end ... 67
5.3.3.3.2. Metadata back-end ... 68
5.3.3.4. Latest search ... 69
5.3.3.4.1. Latest search front-end ... 69
5.3.3.4.2. Latest search back-end ... 70
5.3.3.5. Account settings ... 71
5.3.3.5.1. Account settings front-end ... 72
5.3.3.5.2. Account settings back-end ... 73
5.4. System verification ... 75
5.5. Evolution and maintenance ... 75
Chapter 6 – Results ... 77
Chapter 7 – Conclusions, Limitations and Future Work ... 81
7.1. Conclusions ... 81
7.2. Limitations ... 81
7.3. Future Work ... 82
References... 83
Appendix A – Fénix system in ISCTE-IUL ... 85
Appendix B – Interview Script ... 87
x
Figure 2.9- Example of exporting data, PORDATA ... 18
Figure 2.10- Excel generated by data export, PORDATA ... 19
Figure 2.11- Education and Training, Eurostat database layout... 19
Figure 2.12- Index of Eurostat indicators for education and training ... 20
Figure 2.13- Example of a data query on the Eurostat platform ... 20
Figure 2.14- Example of exporting data, Eurostat... 21
Figure 3.1- Requirements gathering process sequence ... 23
Figure 3.2- What matters to student success (Kuh et al., 2006) ... 25
Figure 3.3- What matters to success according to interviewees ... 25
Figure 4.1- Main platform database design process sequence ... 29
Figure 4.2- Example of a class in the context of this information system ... 30
Figure 4.3- Graphical representation of an association: one to many ... 31
Figure 4.4- Graphical representation of an association: many to many ... 31
Figure 4.5- Graphical representation of an association: one to one ... 31
Figure 4.6- Graphical representation of an association: composition ... 32
Figure 4.7- Graphical representation of a generalization ... 32
Figure 4.8- Class diagram of the platform's main database ... 33
Figure 4.9- Representation in the model and corresponding table ... 34
Figure 4.10- Data crossing between tables ... 35
Figure 4.11- Relational model the platform's main database ... 36
Figure 4.12- Databases comparison... 41
Figure 4.13- Class diagram of the platform's secondary database ... 42
Figure 4.14- Relational model the platform's secondary database ... 42
Figure 4.15- Database management system ... 44
Figure 5.1- Used software development lifecycle model (Waterfall) ... 45
Figure 5.2- UML use case examples ... 47
Figure 5.3- UML use case diagram ... 48
Figure 5.4- System architecture ... 50
Figure 5.5- Front-end and back-end implementation approach ... 51
Figure 5.6- Fénix initial navigation menu ... 52
Figure 5.7- Fénix initial page ... 52
Figure 5.8- UI initial navigation menu ... 52
Figure 5.9- UI about page ... 53
Figure 5.10- UI mission page ... 53
Figure 5.11- UI team page ... 54
Figure 5.12- UI team page (example) ... 54
Figure 5.13- UI login page ... 55
Figure 5.14- before login (username mandatory) ... 55
xi
Figure 5.16- Before login (password mandatory) ... 56
Figure 5.17- Login submission (login failure sequence) ... 56
Figure 5.18- Login submission (failure form) ... 57
Figure 5.19- Login submission (login successful sequence) ... 57
Figure 5.20- login submission (login successful destination page) ... 57
Figure 5.21- UI main menu ... 58
Figure 5.22- UI macrodata... 58
Figure 5.23- UI macrodata established indicators ... 59
Figure 5.24- UI macrodata established indicator subgroups ... 59
Figure 5.25- UI macrodata search example ... 60
Figure 5.26- Macrodata back-end ... 60
Figure 5.27- UI free query ... 61
Figure 5.28- UI free query selection panel ... 61
Figure 5.29- UI free query selection panel (dimension) ... 62
Figure 5.30- UI free query selection panel (variables) ... 62
Figure 5.31- UI free query selection panel (variables help tips) ... 63
Figure 5.32- UI free query selection panel (execution year, locked) ... 63
Figure 5.33- UI free query selection panel (execution year, unlocked) ... 63
Figure 5.34- UI free query selection panel (search button and tool help tip) ... 63
Figure 5.35- UI free query example ... 64
Figure 5.36- Free query back-end... 65
Figure 5.37- Free query back-end (save button)... 66
Figure 5.38- New table in free query scope (queryManagement) ... 66
Figure 5.39- Free query restriction (lower limit) ... 66
Figure 5.40- UI metadata ... 67
Figure 5.41- UI metadata menu ... 67
Figure 5.42- UI metadata example ... 68
Figure 5.43- New table in metadata scope (auxEnum) ... 68
Figure 5.44- New table in metadata scope (auxEnum) ... 69
Figure 5.45- Metadata back-end (save button) ... 69
Figure 5.46- UI latest searches ... 70
Figure 5.47- UI latest searches example ... 70
Figure 5.48- Latest searches back-end (landing) ... 71
Figure 5.49- Latest searches back-end (view search button)... 71
Figure 5.50- UI account settings ... 72
Figure 5.51- UI account settings menu ... 72
Figure 5.52- UI account settings (personal information) ... 72
Figure 5.53- UI account settings (change password) ... 73
Figure 5.54- Account settings back-end (personal information) ... 73
Figure 5.55- Account settings back-end (change password, restrictions) ... 74
Figure 5.56- Account settings back-end (change password, failure) ... 74
Figure 5.57- Account settings back-end (change password, with success) ... 74
Figure 5.58- Account settings back-end (change password sequence) ... 75
Figure 6.1- Example search - selection panel ... 77
Figure 6.2- Example search - result 1/3 ... 78
Figure 6.3- Example search - result 2/3 ... 78
Figure 6.4- Example search - result 3/3 ... 79
Figure 6.5- Example search - export table ... 79
xii
Table 4.2- Descriptions of the classes in the main final diagram ... 34
Table 4.3- Descriptions of the association classes in the main final diagram ... 34
Table 4.4- Attributes description of the platform’s main database ... 40
Table 4.5- Attribute data types of the platform’s main database... 40
Table 4.6- Key attributes denomination present in the platform’s main database ... 40
Table 4.7- Descriptions of the classes in the secondary final diagram... 42
Table 4.8- Attributes description of the platform’s secondary database ... 43
Table 4.9- Attribute data types of the platform’s secondary database ... 43
Table 5.1- Functional and non-functional requirements ... 46
Table 5.2- "Login" Use case description ... 48
Table 5.3- "Logout" Use case description ... 48
Table 5.4- "View account settings" Use case description ... 48
Table 5.5- "Change password" Use case description ... 49
Table 5.6- "Consult metadata" Use case description ... 49
Table 5.7- "View search history" Use case description ... 49
Table 5.8- "Cross indicators freely" Use case description ... 49
Table 5.9- "Save search" Use case description ... 49
Table 5.10- "Export search" Use case description ... 49
Table 5.11- "View predefined indicator sets" Use case description ... 49
Table 5.12- Macrodata established indicators ... 59
xiii
List of Acronyms
CSS – Cascading Style Sheets
DBMS – Database Management System
DGEEC – Direção-Geral de Estatísticas da Educação e Ciência DGES – Direção-Geral do Ensino Superior
FCT – Fundação para a Ciência e a Tecnologia GPA – Grade Point Average
ID – Identification/identity/identifier IT – Information Technology JS – JavaScript
PHP – Hypertext Preprocessor
RDBMS – Relational Database Management System SAS – Serviços de Ação Social
SQL – Structured Query Language UI – User Interface
1 be a key tool to help researchers finding ways to establishing and enrich strategies and policies that promote success at institutional’ bodies through academic data analyzes (Campbell et al., 2007).
Normally, much of the practical studies are usually based on data analysis. Plentiful amount of the information is provided by statistical databases and through surveys.
Although there are international and national statistical platforms that provides data for study, currently there is no exclusive platform for ISCTE-IUL that allows a user to analyze internal academic registries.
The existing academic data from Fénix contains highly relevant student information that can be used as study tools to reveal patterns that lead to academic success/failure.
As there is a core of ISCTE-IUL researchers concerned with reducing school failure and dropout in education, correspondingly, there is also a countless purpose for creating a platform for academic data consultation for better internal study performance.
1.2. Context
According to a study about Portuguese reality (Martins, et al. 2017), the participation of students in Portugal’s higher education has been increasing progressively and therefore, the graduate opportunities have multiplied. One of the most widely research issue on higher education relates to expose paths that lead to academic success (York et al., 2015). Currently, “society requires more and better educated people (to be delivered by higher education systems) as the basic driving force for the further sustainable development of the knowledge society” (Kolster & Kaiser, 2015: p.4). Improving student success is a subject that remains a concern of governments, education policymakers, institutional leaders (rectors and principals), practitioners and researchers (Kahu & Nelson, 2018). The vast amount of studies is connected to the global valuation movement and increasing pressures for institutions to evidence student learning and development (York et al., 2015). The concern is common: “Drop-out rates have to be reduced, time to degree has to be shortened and the quality of the graduates should be maintained, or even improved” (Kolster & Kaiser, 2015: p.4).
Briefly and deduced from some documents (Kuh et al., 2006; York et al., 2015), part of this sort of studies normally consists of: reading relevant bibliographical research and synthesizing content; defining which results and which indicators, duly framed, allow to measure success; Identifying a general concept of academic success or state a position on the term and then design conceptual models/frameworks, in order to establish a wide standpoint.
2 According to what is approach at some studies, to assay a theoretical perspective, it is necessary to require data that correspond to academic success indicators, to measure them and later, and if possible, to reach conclusions (eg. Martins, et al. 2017). Typically, much of the data are usually provided by statistical databases and through surveys. There are multiple platforms that deliver information related to education whose mission is to ensure statistical production and analysis, both nationally as well as internationally. However, there is no system that allows an easy consultation of data at the internal level of the ISCTE-IUL University.
It is well known that information systems have now become an essential part of the education sector in several universities (Campbell et al., 2007; Delavari, 2008). This factor leads to a rise in the capability to assemble, offer, and represent a massive quantity of data about the whole constitution of the institutional body and its interactions with educational systems. So, the responsibility to manage, maintain, integrate large volumes of data has significantly increased for academic institutions (Lotsari et al., 2014; Daud et al., 2017).
The Fénix service typifies a good example of how more and more web technologies represents an integral part of education field and how they have a large positive impact of use. This system grants, through ISCTE-IUL certified users (students, teachers, staff and candidates) a variety of services and features that are present in the daily life of all those who study or work in this institution (Fénix ISCTE-IUL, n.d.). As such, it has the registration of all students who enrolled the ISCTE-IUL university. Which at the eyes of a researcher translates into an invaluable asset of highly relevant student information that can be used as study tools to reveal patterns (Lotsari et al., 2014).
The existence of an academic research domain in ISCTE-IUL that is fairly interested in carrying out studies that reveal responsible factors for student success and failure, validates and justifies the creation of an internal platform that provides academic information. By reusing the content implanted in Fénix database it is possible to establish the provision of an interface that contains information which allows different visions and points of interest in the way of sorting the data. So, at the first place, it is necessary to understand from the researchers’ sights what are the platform requirements.
However, developing a platform whose goal is to create new perspectives for visualizing and analyzing data also means that ethics/privacy issues will raise. Guaranteeing and safeguarding the privacy of all those whose information is collected and exposed is extremely necessary and important (Piety et al., 2014). Therefore, one of the core parts of the conception is to sculpt the data in order to normalize and anonymize them according to the policies in force that establish rules on the processing/treatment of personal data relating to people in EU (GDPR - General Data Protection Regulation, 2016).
1.3. Research Question
The research question of this dissertation is:
• Is it possible to develop a platform that provides data stored in Fénix system and supports different definitions of academic success?
3 methodology process model (Peffers et al., 2007), and is structured as follows:
1. The first procedure seeks to identify the research problem and to establish a motivation for the design of the product.
2. The second step refers to deducing the objectives of the product in response to the problem, and also gather requirements for product design.
3. In the third process, all desired features will be determined, including the system architecture, and the elements that will constitute the final product will be developed and implemented.
4. In the fourth step, a set of tests will be performed in order to simulate the usability of the product in several scenarios of the problem.
5. The fifth process is the phase where is made a product comparison with all initial requirements. In turn, it is the phase in which the product will be evaluated according to the objectives previously stipulated and will be measured its usability
2. Define objectives & requirements gathering
3. Design & development
4. System demonstration & tests 1. Problem identification and motivation
5. Evaluation
6. Communication
4 and effectiveness in resolving the problem. Points 3, 4 and 5 are cyclical and only when all product requirements are met does the process proceed to point 6. 6. In the sixth process, practical work is concluded and will be communicated how
the design and implementation was performed, as well as the usability and efficiency of the product in response to the problem.
5 “What is academic success?” A complex question that many researchers try to answer. However, even “researchers hesitate to define what constitutes student success. The term has been applied with increasing frequency as a catchall phrase encompassing numerous student outcomes” (York et al., 2015: p.1). According to the same study, York et al. (2015), also mentioned that “ambiguity associated with the definition of academic success is partially attributed to its inherently perspectival nature. Varying constituents view success, and thereby academic success, differently” (p.1).
So, is it possible to come up with a single and generic definition of academic success? It is considered as an abstract term, there are multiple views and interpretations about what success is. That’s why some authors attribute the definition of success, in many ways, as subjective. For some people only the above-average results can be considered as success while perhaps for others a bare pass should be sufficient (Nyström et al., 2018).
However, although there is no consensus, it is a field of study that remains in development, and the proof is that the definitions and models related to the term academic success continue to emerge (York et al., 2015).
Perrenoud (2013) affirmed that the idea of school success is currently understood in two senses, in which the first one in a very general way is associated to the performance of students: those who meet the norms of school excellence and progress in the course succeed. Secondly, that school success ends up designating the success of an establishment or a school system. Therefore, Perrenoud (2013) identifies that there is a relationship between these two levels of success. And as far as this view is concerned, R. Levitz and L. Noel (1998) have argued that universities have acknowledged that the success of a student and the success of an institution are attached.
But not all perspectives suggest the same definitions. Kuh et al. (2006: p.5-6), cited that student success can “be defined using traditional measures of academic achievement, such as scores on standardized college entry exams, college grades, and credit hours earned in consecutive terms, which represent progress toward the degree”, and “is also linked with a plethora of desired student and personal development outcomes that confer benefits on individuals and society.
However, one of the most used conceptions is based on the principle that the decisive indicator of student success is the achievement of the degree (Kuh et al., 2006; Tinto & Pusser, 2006).
Kuh et al. (2006) aimed to summarize relevant literature and submit a general definition of student success. The report appropriately recognizes that students arrive at their university experiences with a background of prior characteristics and at the same time there are experiences, pedagogies, and contexts that may have measurable effects on student’s academic success. Within the scope of the report’s objective the authors synthesize the definition of student success as: “academic achievement, engagement in
6 educationally purposeful activities, satisfaction, acquisition of desired knowledge, skills and competencies, persistence, attainment of educational objectives, and post-college performance” (Kuh et al., 2006: p.7). York et al., (2015) based on the literature review, found the student success and academic success concepts used interchangeably. York et al. (2015) stated that the term academic success works as a vague concept that incorporates a wide-ranging educational outcome and then suggested a model of academic success and a “theoretically grounded definition of academic success that is made up of six components: academic achievement, satisfaction, acquisition of skills and competencies, persistence, attainment of learning objectives, and career success” (p.9).
In the absence of agreement, the wide use of the term ends up limiting intervention actions by educational systems, which are intended to increase institutional effectiveness. Since researchers and administrators do not have the capacity to clearly examine academic success, they are unable to provide any kind of resources and actions (York et al., 2015). Tinto & Pusser (2006: p.8), about this cloudy and wide term, have stated that: “our discussion leaves open, for the moment, the definition of success other than to imply that without learning there is no success and, at a minimum, success implies successful learning in the classroom”.
Improving the efficiency of higher education institutions and consequently improving student success remains a concern of education policymakers and all those involved in the education system (York et al., 2015; Kuh et al., 2006; Kolster & Kaiser, 2015; Kahu & Nelson, 2018). The large number of attempts related to the search for models that lead to the success of the student is in turn linked to the pressures for institutions to evidence better students’ learning. However, based on literary review it is possible to verify that many of the studies carried out are not generalizable to a single definition of success because the only relate to a part of a rather vast construct (York et al., 2015).
The study must be carried out and the needs must be fulfilled. That’s why over the time, deduced from some reports, many authors have been presenting or stating the definition of success based of relevant indicators to measure it. Which in general translates into associate indicators and represent them in the shape of a conceptual model framed in a theoretical perspective (Tinto, 1975; Kuh et al., 2006; York et al., 2015).
2.1.2. Indicators
There is an extensive literature problematic about indicators, which lies in defining the term itself. It is easy to find several definitions but not a consensus among interpretations (Johnstone, 1976).
2.1.2.1. Educational Indicators
From the meaning of indicator, it is possible to suggest at least, that the indicators are information corresponding to measurement scales that identifies quantifiable relations or state, of the characteristic that it is intended to study (Johnstone, 1981).
In turn, further deepening the meaning, an educational indicator points to the extension of some identified aspects of education. In other words, educational indicators can be defined as features which the goal resides in pointing to general aspects of an educational system (Johnstone, 1981).
The concept of indicator framed in the educational field outcomes in the definition of an educational indicator as a statistic that discloses the accomplishment performance
7 The educational indicator term in the scope of academic success, such as the indicator definition, is an element that reveal the performance of the appropriated aspects to the study of academic success. Gradually have emerged additional aspects of student success, which represents new dimensions and changes on ordinary success indicators (Kuh et al., 2006). As previously mentioned, according to what Kuh et al., (2006) and Tinto & Pusser, (2006) cited, various consider the accomplishment of the degree as the decisive indicator of student success. However, there are more settled success indicators based up on authors opinion’s, a few examples are: academic achievement (e.g. Grades/GPA), persistence (e.g. Retention and completion rate), pre-college experiences (e.g. Gender, race and ethnicity), post college performance (e.g. Employment rates), satisfaction, etc. (Kuh et al., 2006, York et al. 2015).
Normally, when evaluating the body of higher education institutions, an indicator does not come as isolated measure, but rather in systems of indicators that represent a relationship between different aspects. Simply put, indicators are settled for each element and the indicator system permits to establish relations between distinct elements (Oakes, 1986). The assortment of indicators represents the indicator system (Ogawa & Collom, 1998). Summarizing, “as a whole, indicator systems can be considered as a representation of educational systems which enables data presentation, the monitoring of key components, and recommendations for policy modifications” (Ogawa & Collom, 1998: p.9).
2.1.2.2. Models and Frameworks as guides for indicators systems
Based upon literature review, quite often, indicator systems are grounded on a conceptual models or frameworks, in order to realize which indicators are relevant to the study (Oakes, 1986; Ogawa & Collom, 1998).
Assuming that education systems are clear and measurable, a model allows researchers to identify which major components to measure in education, as well as to include theoretical relationships among the elements. Generally, the approach of the model is denser, complex, and aims to expose/highlight areas that require intervention or provide evidences into the targeted study’s range (Ogawa & Collom, 1998).
The models are widely used and consistent, however, many researchers suggest, alternatively, to construct indicator systems through frameworks. Which are represented as simple structures to form educational areas of interest (Ogawa & Collom, 1998).
While implementing a framework, similarly to the models, it is still able to establish the key elements of interest. The difference lies on the simplicity of the structures, because frameworks do not typically infer relations between the distinct elements and
8 also are not as likely to request contributory use of the outcomes (Ogawa & Collom, 1998). “Since frameworks are not attempts to build a comprehensive map of the educational system, the data derived from them are more likely to inform discussion rather than prescribe a remedy” (Ogawa & Collom, 1998).
2.1.3. Review of Developed conceptual models
As has been previously mentioned, throughout the times, associated with the attempts to promote better conditions that leads to academic success, several researchers have carried out reports approaching measures, and conceived theoretical perspectives (Kuh et al. 2006; Tinto & Pusser, 2006; York et al. 2015; Kahu & Nelson, 2018).
A conception will be exposed in the follow-up of the report, not as the main one, but instead, as a good approach that not only constitutes a well-founded example of a theoretical frame that highlights the significant elements to measure success according to the author’s view but is also easily moldable to real scenarios.
2.1.3.1. York, Travis et al. (2015)
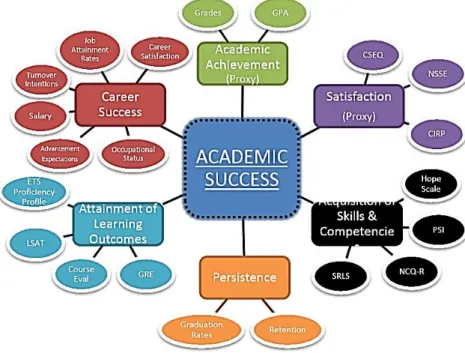
Going to the heart of the matter, Travis York, Charles Gibson, and Susan Rankin (2015), suggest an overall broad definition of the term academic success. The authors carried out extensive bibliographic research, to realize the usage of the term in higher education. The definitions, considered by the authors as the main ones, were conceptually judged using Alexander Astin's model Inputs-Environment-Outcomes (1991), which ultimately lead to the submission of a revised wide-range meaning and a new conceptual model of academic success.
York et al. (2015) considered I-E-O as the theoretical basis of this study, since it allows the identification of academic success as an outcome and establishes the definition of academic success composed by aspects entitled as inputs or environment.
Therefore, an initial structure emerges (figure 2.1), based on Astin's I-E-O model and literature review prior to this research, which represents, in part, the changes that occurred during the proposal of the term.
This initial framework of academic success is comprised of persistence and retention, attainment of skills/knowledge/competencies and academic achievement. Persistence and Retention are contained as a measure of students’ academic progress, where persistence states to degree completion, and retention refers to the capacity of an
9 success model (figure 2.2), not only demonstrative in the literature, but also suitable for educational research.
According to the authors’ interpretation, the definition of academic success lies in the set of academic achievement, satisfaction, acquisition of skills and competencies, persistence, attainment of learning outcomes, and post-university performance (more specifically, career success). In the figure 2.2, it is possible to perceive the whole models’ structure, the different branches and corresponding measurement elements.
York et al. (2015), included academic achievements as an indicator of students’ academic performance, and distinguished this parameter from attainment of learning and acquisition of skills and competencies. Although the authors have assumed that both are related, in the sense that academic performance should be a direct result of learning and acquiring skills and abilities, academic achievement does not inevitably capture students' learning. Therefore, it makes sense to have three distinct branches, in which each presents the respective measurements. The measures presented by the authors to academic achievement are the grades or GPA.
10 In the following, York et al. (2015) notice that there are also quite considerable resemblances between attainment of learning outcomes and acquisition of skills and competencies, making it difficult to distinguish contextually between these two branches in this model. The authors argue that both can be measured over the course and institutional level, and normally, course tasks and assessments are the primary incomes of measuring these elements at the course level.
Although according to the authors, the literature reviewed on the theoretical distinction between these two indicators is scarce, York et al. (2015) consider that it is still better to split them. Regarding to attainment learning outcomes, embedded elements tend to represent cognitive skills and knowledge. And, in the case of the acquisition of skills and competencies, the incorporated measures are directed on capturing the affective development.
Another indicator presented in this model is satisfaction, although the authors argue that it is not a component of academic success, it is an indicator that captures perceptions of institutional adequacy, acclimatization to the learning environment or achievement of students' goals. In other words, it refers to important aspects of the student's condition within the institutional context, which in turn affect his ability to succeed academically.
Thus, satisfaction offers a measure for contextual aspects, which fit as necessary for the learning environment, as well as, requirements for academic success. According to the literature the authors disclose satisfaction measurements through nationally available institutional surveys or course evaluation (e.g. Course experience questionnaire).
Persistence is another suggested indicator because it aims to represent the ongoing progression of students in an academic degree and can capture students' individual academic goals in various study programs and in various institutional contexts. In summary, it is included in this model of academic success by York et al. (2015), to capture the motivation, focus and progression needed to enable students to complete a study plan. Therefore, the measurements used for persistence are retention between years of university, and degree attainment rates.
Finally, the last indicator is related to post-university performance and is called career success. As the name suggests, it aims to provide information on student performance after attending higher education. The authors, based on other documents, argue that this is divided into two forms of measurement: extrinsic and intrinsic. In which first, respectively, concerns aspects such as job acquisition rates, salaries. While the second, provides measures of career satisfaction, and achievement of professional goals. In conclusion, despite knowing that the definition of the term academic success is inevitably broad and quite complex, the authors have succeeded in forming a theoretically substantiated definition of academic success. As previously mentioned, after the contextualization of all terms and respective measurement elements introduced in this model suggested by York et al. (2015), it is clear that this model is demonstrative in the literature, as well as, suitable for educational research.
2.2. Using Data to Improve Academic Success Studies
There were times in education, where data did not usually have a position in relation to analysis and decision-making (Earl, 2005). Not only the data related to educational institutions were few, but the ones that existed were difficult to manage, change, and to enable meaningful cohorts between datasets (Matters, 2006).
11 2.2.1. Academic Information systems
Presently, information systems represent a crucial part of the education area in quite a lot of universities. In the sense that academic systems have produced an extensive data collection that correspond to almost the entire of institution’s information (Campbell et al., 2007; Delavari et al., 2008; Voorhees & Cooper, 2014).
The massive increase of data that pertains to the whole composition of the institutional body and its interactions with the educational systems, promotes accordingly, a significantly increase of the responsibility to manage and integrate huge volumes of data for academic institutions (Lotsari et al., 2014; Daud et al., 2017).
It also happens that in the scope of investigation this abundance of data translates into a priceless asset of highly relevant student information, that can be used as study tools to reveal patterns (Lotsari et al., 2014).
According to Earl (2005), although having data is a great start, this is not enough. Under these circumstances, higher education institutions need to go beyond “data-rich to being information-rich and knowledge-rich as well” (p.8). The process of knowledge formation results from the organization and contextualization of information. In turn, relating and giving meaning to information generates knowledge to act properly (Earl, 2005).
However, initially, it is essential to recognize that for universities it is not a common practice to use own data in such ways. Neither all applicable data are collected by institutions, and the existing ones are often not collected for specific study purposes (González, 2009). Therefore, “in the colleges’ efforts to increase student success, it became clear that it was necessary for everyone to understand the types of data needed and exactly how such data was to be used” (González, 2009: p.2).
According to Lorna Earl (2005: p.9), “The challenges come in deciding what data are appropriate and useful for their purposes, ensuring the quality of the data and doing the kinds of analyzes and interpretations that will help them make sense of the data”. Implicitly associated with the value that the data can possess, lies a judgment in the selection of data according to its quality, the organization of the information, as well as, reflection on the results and application of measures with knowledge (Earl, 2005).
In order to establish where to find data, it is important to match planning goals to indicators categories and, subsequently, from indicators sorts to potential data sources (Earl, 2005).
Lorna Earl (2005), listed nine indicators categories (table 2.1), through a conference with PowerPoint slides, which might be used as a path to data sources.
12
Table 2.1- Indicators categories, Lorna Earl (2005)
Gabrielle Matters (2006), based on Earl’s (2005) classification, proposed a table (table 2.2) where is jointed links between sources of data and locations of datasets (according to the input-process-output model in the student-learning environment). Which in turn, in the author's perspective, after having established a purpose of study, it’s an asset to help in the decision of which data to collect.
Data source Potential source of data Data point
Student demographics
Attendance Input
Enrollment Input
Grade level Input
Ethnicity Input
Sex Input
Firs language Input
Health Issues Input
Socioeconomic status Input
Student achievement
Standardized, norm-referenced, criterion-referenced tests Output
Questioning in class Output
Performance and standards-based assessments Output
Teacher-made tests, projects, quizzes Output
Teachers’ observations Output
Grades and grade-point-averages Output
Student work Output
Teaching and assessment
practices
Instructional and learning strategies Student-learning process
Instructional time and environment Student-learning process
Organization of instructional components Student-learning process
Assessment practices Student-learning process
Classroom management philosophies Student-learning process
Item banks Student-learning process
Parent opinions and behaviors
Parent perceptions Output
Parent involvement in the school Student-learning process
Parent support of student learning Student-learning process
School culture
Relationship between educators Student-learning process
Relationship between students and educators Student-learning process
Beliefs about learning and teaching Student-learning process
Professional development Student-learning process
Staff demographics Background Input Interests Input Qualifications Input Sex Input Ethnicity Input Programs
Program descriptions Student-learning process
Course outlines Student-learning process
Special programs Student-learning process
Indicators Categories Student/community Demographics
Physical Plant Student Achievement School and Teacher Demographics
School Culture
Teaching and Assessment Practices Programs
Student attitudes Parent Involvement and Support
13 2.2.1. Variables used in academic success case studies
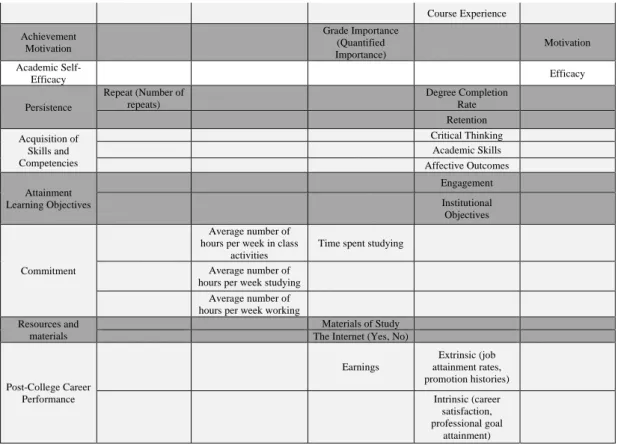
Using some documents as reference, performed by Qasem A. Al-Radaideh et al. (2006), Martins et al. (2017), Edin Osmanbegović & Mirza Suljić (2012), T. York et al. (2015), and Aboma Olani (2009), in which the analysis of certain variables was achieved to measure or predict academic success, it was conceivable to establish a synthesized list.
Even though that there are more variables contained in other studies, and suitable to other authors' prospects, this table does not have the function of representing all the variables that can be applied, as well as, does not aim to make a direct comparison, due to the different insights in the origin of the variables. But instead, for exposing, according to several studies, which of the variables have been used, to measure or predict academic success. Dimensions / Authors Qasem A. Al-Radaideh et al. (2006)
Martins et al. (2017) Edin Osmanbegović
& Mirza Suljić (2012) T. York et al. (2015)
Aboma Olani (2009)
Socio-demographic characterization
Sex Sex Sex Sex
Age Age Family (Number of
household members) Place of Residency (Family, Friends, Alone) Distance (From residence to college) Social origins Socio-Occupational Categories (socials classes) Parents Years of schooling Previous education
High School Major (Science, Arts,
Math’s., …)
Earlier failure (year
repeated) High School Major
High School Grade Route of access to higher
education Entrance exam
University Entrance Scores Sector in secondary education (Public, Private) Preparatory Grade Point Average (PGPA) Characterization of Educational Institutions in HE Student Department Sector of educational institution (Public, Private) Aptitude Test Scores
Study Type Education subsystem
(University, Polytechnic)
Field of Study
Financial Support Funding (Private,
Scholarship, Local) Scholarships
Academic Achievement
Grade Point Average
(GPA)
Grade Point Average (GPA) Grade Point Average (GPA) Grades Grades Academic Satisfaction Overall College Experience
14 Course Experience Achievement Motivation Grade Importance (Quantified Importance) Motivation Academic Self-Efficacy Efficacy Persistence Repeat (Number of repeats) Degree Completion Rate Retention Acquisition of Skills and Competencies Critical Thinking Academic Skills Affective Outcomes Attainment Learning Objectives Engagement Institutional Objectives Commitment Average number of hours per week in class
activities
Time spent studying
Average number of
hours per week studying
Average number of
hours per week working
Resources and materials
Materials of Study
The Internet (Yes, No)
Post-College Career Performance Earnings Extrinsic (job attainment rates, promotion histories) Intrinsic (career satisfaction, professional goal attainment)
Table 2.3- Variables used in some practical studies of academic success
But, subsequently the selection and collection of the potential data sources, how to transform the data into knowledge? In other words, how to use the data?
2.2.2. The Impact of IT’s Application on Academic Success
Many authors share the idea that IT is seen as a key element of research because through the data presentation, data analysis or data mining it is possible to face some challenges imposed in higher education. More specifically, in the areas where the goal is to promote enrich educational policies at institutional’ bodies and improving student learning outcomes (Luan, 2002; Campbell et al., 2007; Delavari et al., 2008; González, 2009; Voorhees & Cooper, 2014). According to Campbell et al. (2007), “analytics marries large data sets, statistical techniques, and predictive modeling. It could be thought of as the practice of mining institutional data to produce actionable intelligence” (p.44).
Currently, despite the use of data analysis in higher education is centered for higher-level organizational decision, it is expected that the use of analytics raise in areas such as academic success. Since, academic analytics has a remarkable potential to produce actionable knowledge in order to improve learning, teaching and student success (Campbell et al., 2007, Voorhees & Cooper, 2014).
Data settled in specific forms, provides information aimed at the stakeholder’s intentions, to support judgements and decisions (Axworthy, 2005).
15 An example of a national digital educational statistics platform that provides data in Education area, is the DGEEC – Direção-Geral de Estatisticas da Educação e Ciência, which is a body of the Ministry of Education and Science. In accordance to the information outlined in the mission description, this platform aims to ensure the education and science statistical production and analysis, providing procedural support to policy formulation, as well as, strategic planning and operational (DGEEC).
Through this platform it is possible to access a broad set of educational indicators, faster and interactively. These are structured as in accordance with the following tables.
Pointing specifically to higher education indicators, correspondingly based on the information provided by the DGEEC interface, the following indicators are obtained (table 2.5):
As it is visible in the images below, this platform allows the navigation, indicators selection, data exploration and export to different formats (Excel and ODS).
Higher Education
Vacancies in Higher Education New Enrolled Students
Enrolled Students Graduates Academic Staff
Table 2.4- Educational indicators included in the DGEEC platform
Educational Indicators
General Education Indicators Indicators of Right to Education
General Data Universal Primary Education
Pre-School Education Accessibility to Secondary and Higher Education Basic Education Curricula and Educational Resources
High School Educational Opportunity and Freedom Higher Education
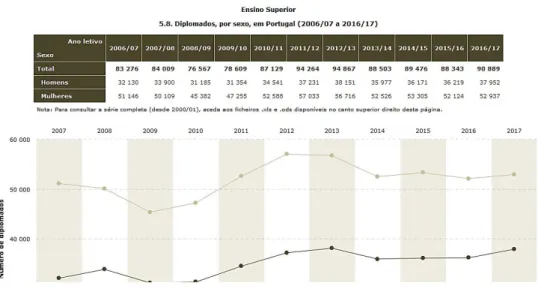
16 As an example of consultation, the selected indicator was "graduates, by sex, in Portugal", and the solution offered corresponds to the following figure.
After the query example, below is an example to represent the ease of exporting data, in this interface.
Figure 2.3- Index of DGEEC indicators for higher education
17 2.2.3.2. PORDATA
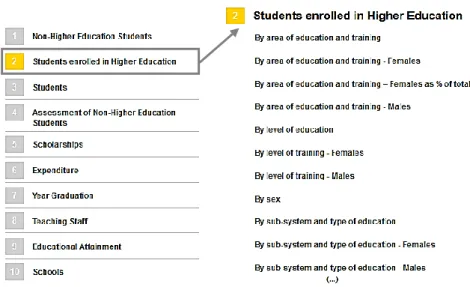
According to what is labelled in the platform description, PORDATA supports the collection, systematization and dissemination of data on multiple areas of society, on Portugal and its municipalities, and on the European countries. The reported statistics derive from official and certified sources, with data production skills in the respective areas (PORDATA). Regarding education in higher education, several aspects that might be consulted as presented in the following image are present on this platform. Although, the image does not refer all, it suggests how the consultation can be done.
While choosing some of the indicators, besides the chart and graph in the platform, several functionalities are provided, such as description of the data (metadata), options of graphs, filters in the data and export methods (excel and pdf).
Figure 2.5- Example of exporting data, DGEEC
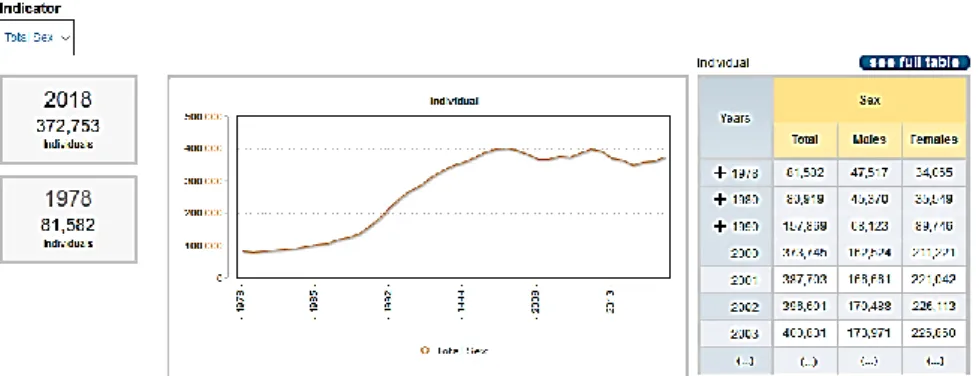
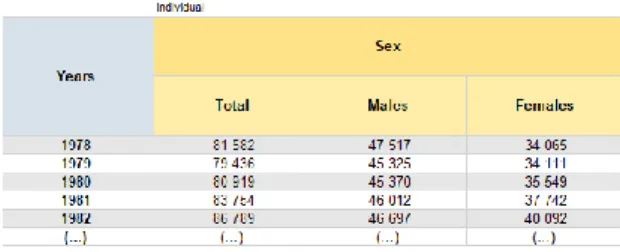
18 For example, in the case of consultation "Students enrolled in Higher Education: By sex" the following information is provided:
If desired to export this data in Excel format for different views, the procedure and result are as follows:
Figure 2.7- Set of options provided by the PORDATA platform
Figure 2.8- Example of a data query on the PORDATA platform
19 2.2.3.3. Eurostat
Eurostat is the statistical office of the European Union, whose key role is to provide statistics for Europe so that it is possible to define, implement and analyze improvement policies in various sectors (Eurostat).
The platform allows several alternatives to query data that is contained in the database, and where one of the methods specifically allows to browse statistics by topics. The following table sets out, according to Eurostat, which categories are available.
As seen through the table 2.6, Eurostat has an extensive collection of indicators from different sectors. Shifting the focus to aspects relevant to education, included in the topic “Population & Social conditions” lies elements related to “Education and Training”, as mentioned in the following image, which exposes the database layout.
Indicators Categories General and regional statistics Economy and finance Population and social conditions Industry, trade and services Agriculture and fisheries International trade Transport Environment and energy Science, technology, digital society Education and Training
Table 2.6- Indicators categories included in the Eurostat platform Figure 2.10- Excel generated by data export, PORDATA
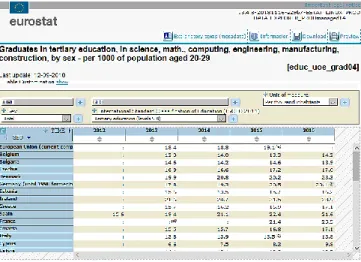
Figure 2.11- Education and Training, Eurostat database layout
20 In the case of a search, this platform has a lot of features. All indicators have metadata, with detailed descriptions, each branch enables data exploration, as well as, exportation in many formats (Excel, CSV, HTML, PC-AXIS, SPSS, TSV and PDF).
The following images represent an example query, which results in the exploration and visualization of data, and lastly, the export. This query starts with the navigation in the database tree, where the selected branch is called "Education and training outcomes" and then is selected, within this branch, "Graduates in tertiary education, in science, math. computing, engineering, manufacturing, consultation, by sex - per 1000 of population aged 20-29".
Figure 2.12- Index of Eurostat indicators for education and training
21
23 3.1. Interview process
The process prior to the creation and design of the platform consisted of a set of interviews with a qualitative purpose in order to collect different perspectives regarding to the academic success topic, as well as to identify the main needs of potential users with regard to the type of data on the which there will be more interest in consulting.
The interviews were guided by a script (Appendix B) composed of five questions: 1. What is your definition of academic success?
2. What factors are most involved or condition academic success? 3. Which segments of students may be more vulnerable to failure?
4. Given the universe of the Fénix system, what are the data that seem to be most relevant to establishing indicators of academic success? Or others that with this concept may be related or implied in its explanation?
5. Comment on the possible usefulness of having a platform that allow to consult and download academic data related to academic success.
To establish a more wide-ranging view, teachers with qualifications in different areas were interviewed. The interviewed set was composed by a total of six ISCTE-IUL teachers. Including the President of the Pedagogical Council, the School of Technology and Architecture director, the director of the Sociology department, the director of Sociology Degree, the director of Computer Engineering Degree, and a psychologist from the student counseling office.
As expected, the difference between areas of training eventually reflected certain discrepancies in the definitions of success. However, academic success measured through student performance throughout the course frequency was recorded in all interviews.
3.1.1 Interviews' outcomes
24 Some perspectives cover the definition of academic success as obtaining the degree for the stipulated time, depending on the statute of the student (part time, full time, student worker, international student). Others tend to distinguish multiple success levels based on the number of completed courses per year versus the stipulated, at the time the student is approved for the next curricular year. There are perspectives that refer to a definition of success where the set of skills and knowledge (theoretical / practical) acquired throughout the course predominates. Some visions highlight academic success such as the combination of student performance, acquisition of knowledge, continuity of studies or pursuit of a professional career in the technical area of training. Finally, some argue success as the result of a very comprehensive enriching experience in the academic context that includes overcoming a set of academic goals (complete the courses of the respective academic years, acquiring a degree) as well as the acquisition of features regarding to the personal (personal development), social and intellectual skills, and that ultimately allow a student update or form a potential.
In addition to the general definitions of the term success in higher education, a number of factors that may influence academic success have been collected through this process, as well as segments of students that may be vulnerable to failure. The first being respectively:
• Satisfaction of the student with the frequency of the degree; • Demographics factors;
• Enrollment choices;
• Integration in the university environment (student involvement in the institution, social relations with teachers and students);
• Family background (parents' education and profession); • Student training framework (previous course);
• Student work methodology (planning and time management, study habits, autonomous and group work capacity);
• Student motivation;
• Aptitude for the training area;
• Institutional factors (evaluation methods, teaching approaches, methods and good pedagogical practices, provision of suitable spaces for study, content repository); • Course (difficulty and requirement of the course)
• Teachers (ability to transmit knowledge, agility and availability to clarify doubts); • Socioeconomic factors.
And the seconds being respectively:
• International Students (Portuguese language barrier, different assessment and teaching methods);
• Displaced students;
• Students with a vulnerable socio-family background; • Students with low schooling family background; • Students with economic shortages;
• Students with low motivation; • Students who do not attend classes;
• Students with low previous education preparation;
• Students with difficulties in adapting not only to assessment methods, but also to teaching methods and practices;
• Students with integration difficulties;
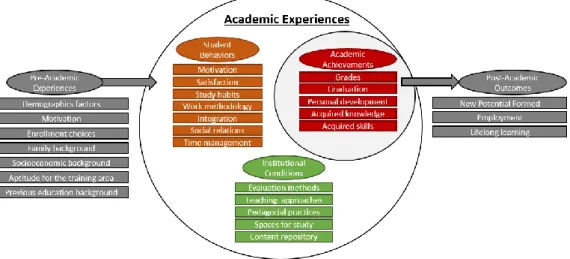
25 The figure bellow appears in the attempt to create a possible framework, minimally comparable to the scenario presented by Kuh et al. (2006), where the sum of the definitions and factors described by the interviewees, relevant to academic success, were presented.
In the following of the interview, subsequent to the collection of definitions and factors measured as important to the term academic success, and considering the universe
Figure 3.2- What matters to student success (Kuh et al., 2006)
26 of the Fénix system, it was asked which data would be most relevant to establish indicators of academic success or which information could be implicated with this concept. The answers were as follows:
• Age; • Sex;
• Nationality and second nationality; • Place of residence;
• Parents' education and profession;
• Specifics related to previous education (Public / Private, specificity area); • Number corresponding to the ingression degree preference;
• Higher education ingression grade; • Enrollment;
• Registration in courses; • Grades in courses;
• Degree grade point average; • Approval rates to courses; • Attendance;
• Number of courses completed per year;
• Access to higher education (normal, post-work);
• Student statute (Worker student, international student, displaced student, scholarship student);
• Erasmus students;
• Course’s content repository.
3.1.2. What data is needed?
By grouping the proposed indicators into blocks of dimensions, it ends up reflecting an easier and structured analysis.
Dimensions Indicators Additional Information
Pre-Academic Experiences Socio-demographic characterization Sex Age Place of Residency Nationality and second nationality Family
background Parents' education and profession
Previous education
Precedent degree designation and conclusion year
Previous education sector Public, private or both
Specificity of study' area or field of study (Ex: Economy, arts, etc.)
Candidacy preferences
Access Type Normal regime, post-work
regime Higher education ingression grade
Academic
Experiences Students' profile
Working student Partial time student
Dislocated student International student
27 When it was questioned about the usefulness of the platform, the majority of the interviewees considered quite interesting the idea of having an interface that allows to consult and export institutional data related to academic success. In the sense that the Fénix system contains huge volume of information, and by taking advantage of it to provide an easy access in order to consult institutional data by looking for solutions that are not available through the regular use of Fénix, can enable to establish wide-ranging visions, which subsequently could introduce more effective measures to combat school failure and drop out in higher education.
3.2. Data selection process
3.2.1. What data is available?
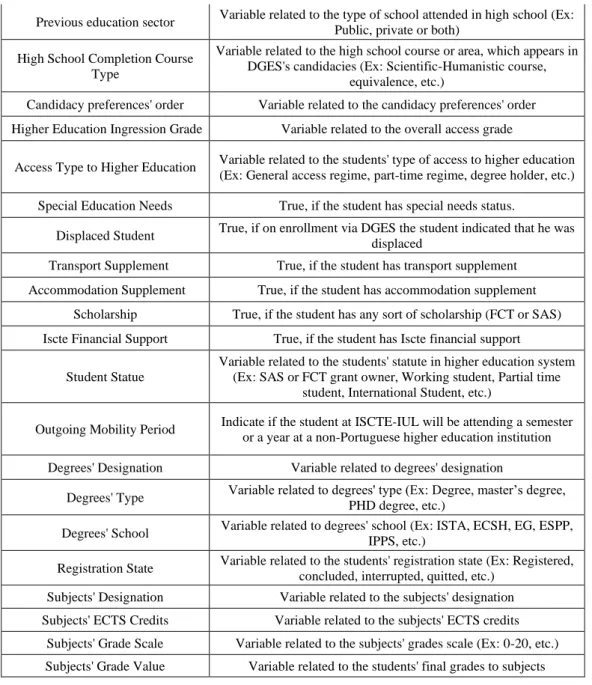
After gathering definitions, indicators and potential sources of information correlated with academic success, it is necessary to form the following question so that the following steps can be taken in the development and design of the data consultation platform. What data do Fénix system database has that is related to the proposals exposed during the interviews? In answer to the question follows table 4.2, that shows which variables and data types are in the Fénix system database related to what was asked.
Variables Additional information
Sex Variable related to students' gender
Place of Residency Variable related to students' place of residency
Year of Birth variable related to students' year of birth
Nationality Variable related to students' nationality
Second Nationality Variable related to students' second nationality
Parents' Profession Variables related to the profession of the students' parents
Parents' Education Variables related to the education of the students' parents
Marital Status Variable related to students' marital status
Precedent degree designation Variable related to the designation of the students' previous degree
Precedent degree conclusion year Variable related to the conclusion year of the students' previous
28
Previous education sector Variable related to the type of school attended in high school (Ex:
Public, private or both) High School Completion Course
Type
Variable related to the high school course or area, which appears in DGES's candidacies (Ex: Scientific-Humanistic course,
equivalence, etc.)
Candidacy preferences' order Variable related to the candidacy preferences' order
Higher Education Ingression Grade Variable related to the overall access grade
Access Type to Higher Education Variable related to the students' type of access to higher education
(Ex: General access regime, part-time regime, degree holder, etc.)
Special Education Needs True, if the student has special needs status.
Displaced Student True, if on enrollment via DGES the student indicated that he was
displaced
Transport Supplement True, if the student has transport supplement
Accommodation Supplement True, if the student has accommodation supplement
Scholarship True, if the student has any sort of scholarship (FCT or SAS)
Iscte Financial Support True, if the student has Iscte financial support
Student Statue
Variable related to the students' statute in higher education system (Ex: SAS or FCT grant owner, Working student, Partial time
student, International Student, etc.)
Outgoing Mobility Period Indicate if the student at ISCTE-IUL will be attending a semester
or a year at a non-Portuguese higher education institution
Degrees' Designation Variable related to degrees' designation
Degrees' Type Variable related to degrees' type (Ex: Degree, master’s degree,
PHD degree, etc.)
Degrees' School Variable related to degrees' school (Ex: ISTA, ECSH, EG, ESPP,
IPPS, etc.)
Registration State Variable related to the students' registration state (Ex: Registered,
concluded, interrupted, quitted, etc.)
Subjects' Designation Variable related to the subjects' designation
Subjects' ECTS Credits Variable related to the subjects' ECTS credits
Subjects' Grade Scale Variable related to the subjects' grades scale (Ex: 0-20, etc.)
Subjects' Grade Value Variable related to the students' final grades to subjects
Table 3.2- Some of the variables available in Fénix system database
Considering the variables mentioned in the interviews and correlating with some of the variables in the Fénix database (table 3.1, 3.2), it is possible to verify in advance that even though Fénix is not a platform for the purpose of an academic success-focused tool, it collects a lot of information from the students that in the eyes of an interested person, can have a lot of potential in the ambit of academic success.
29 For a good performance of any information system, it is an essential condition that the information be properly structured. Because, through a good structure, it becomes easier and more intuitive to ensure its maintenance and consultation (Ramos, 2008).
Over the years, various languages have been developed and used to help structure and organize information. Being the relational model one of the most privileged methods, as it is supported by the vast majority of information systems development tools (Ramos, 2008). In addition, the UML (Unified Modeling Language), as an aid to relational model design, has been widely used because it fits within the framework of conceptual modeling languages and consequently allows to manipulate semantically richer concepts than those that describe database models (Ramos, 2008).
Thus, throughout this chapter are presented the UML class diagrams, as well as the relational model diagram, both proposed for the design of this platform database.
4.1.1. UML Class diagram
Of the UML set of diagrams, only the class diagram was used, since to represent the specifications needed to design a database is the best suited. During the design of the class diagram was used the BOUML software, which is a free tool for designing and modeling UML diagrams (classes, use case, sequence, among others).
Class diagrams are intended to represent the systems structural component and allow the design of a relational database using concepts closer to a non-computer professional (Ramos, 2008). Not going much deeper theoretically, for the design of a diagram concepts such as objects, classes and relations are used. Prior to the final drawing of the class diagram, these terms will be contextualized in order to make it reasonably understandable.
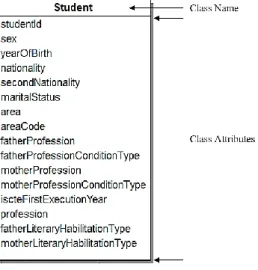
30 4.1.1.1. Objects and Classes
Briefly, an object is considered as something that is distinct, characterized by a set of attributes and relevant to the scope of the information system (Ramos, 2008).
When sketching an information structure, it is not practicable to represent all objects in the system. The notion of class in UML allows you to represent and define objects in aggregate form. Being a class, a description of a set of objects that share the same attributes, represent the same semantic reality, and over which the same operations can be performed (Ramos, 2008).
In the following figure, the graphical representation of a class is presented. In this scenario, the student class appears as an example and, in turn, represents all students (objects).
4.1.1.2. Relations between classes
In an information system, objects are not isolated, they relate to other objects, including objects from other classes. UML provides some types of relationships specific to different contexts. Contemplating thus two types of relations: associations and generalizations (Ramos, 2008).
Not all relations in UML will be theoretically contextualized since the purpose is only to explain the logic of all relations contained in the final class diagram model.
Starting with associations, these are one of the main ways to embody the relations between class objects. An association that joins two classes represents all the existing links between the objects of both classes. At each end of the associations, ranges of values are indicated, where each value can diverge from 0 to infinity (symbol, *), in order to represent the cardinality (lower and upper limit) of an association (Ramos, 2008).
Multiplicity Option Cardinality
0..1 No instances or one instance
1..1 1 Exactly one instance
0.. * * Zero or more instances
Table 4.1- Multiplicity values used on the final class diagram Figure 4.2- Example of a class in the context of this information system
31 Subsequently, is presented an association whose classification according to upper bounds is defined by "many to many" and reads as follows: A registration may have many years of execution and, in a year of execution, there may be many registrations. In this example, there is also the association class called "RegistrationByExecutionYear" which consists of an association that assumes some characteristics of the classes, specifically the fact that it might be characterized by attributes but remains an association.
The following is an illustration corresponding to the graphical representation of an association classified according to the upper limits as "one to one". And it reads as follows: A registration can only relate to one candidacy, and a candidacy cannot give rise to more than one registration.
Figure 4.3- Graphical representation of an association: one to many
Figure 4.4- Graphical representation of an association: many to many