IN DYSTROPHIC RED LATOSOL (OXISOL) USED FOR
FARMING AND CATTLE RAISING ACTIVITIES IN A
SUB-BASIN IN THE SOUTH OF MINAS GERAIS
Modelagem espacial e temporal da erosão hídrica em Latossolo vermelho distrófico com uso agropecuário numa sub-bacia hidrográfica do sul de Minas Gerais
Diogo Olivetti1, Ronaldo Luiz Mincato2, Joaquim Ernesto Bernardes Ayer1,
Marx Leandro Naves Silva3, Nilton Curi3
ABSTRACT
Water erosion is one of the most important soil degradation processes and it can be intensified by land use and vegetal covering changes. Thus, water erosion modeling studies associated to multi temporal analyses of land use are effective in assessing how changes in land cover affects sediment yield. Therefore, considering the modifications in the land use from 1986 to 2011, the aim of this study ranged to estimate water erosion rates and compare them to the soil loss tolerance (SLT) limit in the Latosols (Oxisols) at Ribeirão Caçús sub-basin, in the South of Minas Gerais State, Southeast Brazil, by means of the Revised Universal Soil Loss Equation (RUSLE) in association with the geographic information system (GIS), and geostatistical techniques. So, for each year mapped, soil loss averages were compared by t test at 5% significance to assess the soil degradation stage. The results indicated that, in the period, the soil loss average rate was from 2.4 to 2.6 Mg ha-1 year-1 and the areas with soil loss above the limit
of SLT were around 8.0%. The t test demonstrated there was no considerable difference among the soil loss averages (p = 0.18). In consequence, the area of degraded soils did not increase. Thus, the RUSLE model in GIS is a simple and useful tool to estimate the soil loss and help define soil conservation and recovery measures.
Index terms: Land use changes, RUSLE, soil loss prediction, soil degradation.
RESUMO
A erosão hídrica é um dos principais processos de degradação do solo e pode ser intensificada pelas alterações de sua cobertura. Assim, estudos de modelagem da erosão hídrica associados às análises multitemporais do uso do solo são eficazes para avaliar os efeitos de tais alterações na produção de sedimentos. Portanto, diante das alterações no uso solo de 1986 a 2011, objetivou-se, neste trabalho, estimar as taxas de erosão hídrica e comparar com o limite de tolerância de perda de solo (TPS) nos Latossolos da sub-bacia hidrográfica do Ribeirão Caçús, sul do Estado de Minas Gerais, Sudeste do Brasil, a partir da Revised Universal Soil Loss Equation (RUSLE) associada às técnicas de sistemas de informação geográfica (SIG) e de geostatística. Assim, para cada ano
mapeado, foram comparadas as médias de perda de solo pelo teste t, com 5% de significância, para avaliar o estágio de degradação do solo. Os resultados apontam que, no período, a taxa média de perda de solo foi de 2,4 para 2,6 Mg ha-1 ano-1 e as áreas com perda
de solo acima do limite da TPS foram de cerca de 8,0%. No teste t não houve diferença considerável entre as médias de perda de solo (p = 0,18). Assim, não ocorreu aumento da área de solos degradados. O modelo RUSLE em SIG é uma ferramenta útil e simples para estimar a perda de solo e auxiliar na definição de medidas de conservação e recuperação do solo.
Termos para indexação: Alterações no uso do solo, RUSLE, predição de perdas de solo, degradação do solo.
1Universidade Federal de Alfenas/UNIFAL – Alfenas – MG – Brasil
2Universidade Federal de Alfenas/UNIFAL – Instituto de Ciências da Natureza/ICN – Rua Gabriel Monteiro da Silva – 700 – Centro – 37130-000 – Alfenas
– MG – Brasil – [email protected]
3Universidade Federal de Lavras/UFLA – Departamento de Ciência do Solo/DCS – Lavras – MG – Brasil
Received in july 29, 2014 and approved in september 22, 2014 INTRODUCTION
Soil is one of the most important environmental resources on Earth. It holds a peculiar position in the hydrological and nutritional cycles and has influence on several forms of terrestrial life, besides storing and releasing greenhouse gases, and filtering and remediating pollutants. However, many of the ecosystem functions of the soil are lost due to its degradation. Thus, soil conservation and recovery are
some of the great challenges for humanity in the XXI century. In this scenery, water erosion accelerated by anthropic activities is one of the main soil degrading processes, with impacts on farming and cattle raising productivity and on natural resources, since recovery rates is not fast enough to compensate for soil loss associated to erosion (Needelman, 2013).
This way, studies on water erosion in different types of land use and management are essential for land use planning, soil and water conservation, and recovery of degraded areas (Avanzi et al., 2013).
Thus, water erosion modeling is an important and consistent tool to defining areas more susceptible to soil loss, which considers spatial and temporal variability of characteristics that interfere in the eroding process (Bhattarai; Dutta, 2007).
Empirical predictive models have been applied to estimate water erosion in basins using the Revised Universal Soil Loss Equation (RUSLE) (Renard et al., 1997). The RUSLE presents the same formulation as the Universal Soil Loss Equation (USLE) (Wischmeier; Smith, 1978). Both models are the most applied to estimate water erosion due to simplicity and availability of information (Oliveira et al., 2013) and include such factors as rainfall erosivity (R); soil erodibility (K); topographic (LS); cover and management (C), and, support practice (P). In addition, by RUSLE model these factors are calculated with adjustments to seasonal variations and geographic information system (GIS) techniques (Renard et al., 1997; Beskow et al., 2009; Morgan; Nearing, 2011).
The increased demand for farm products is one of the main reasons for changes in land cover which may intensify water erosion (Martinelli; Filoso, 2008). Therefore, in water erosion modeling studies, multi temporal analyses of land use have served as a tool to evaluate such changes and their consequences in the yield and transportation of sediments, in the long term (Jordan et al., 2005). Therefore, the aim of this study was to evaluate the effect of changes in land use from 1986 to 2011 to estimate water erosion by RUSLE and compare the results to soil loss tolerance (SLT) in dystrophic Red Latosol at a sub-basin in the Southeastern region in Brazil.
MATERIAL AND METHODS
Study Area And Soil Description
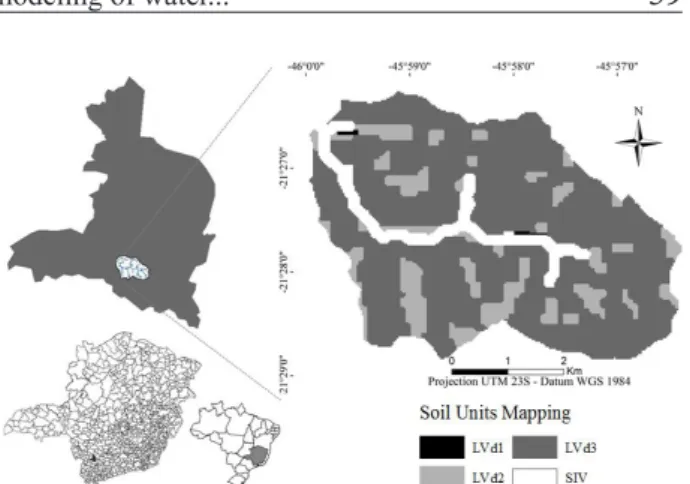
The Ribeirão Caçús sub-basin is located at Alfenas municipality, South of Minas Gerais state, Southeastern Brazil (Figure 1). It has 2,080 ha, within the coordinates 21° 26’ to 21° 29’ S and 45° 56’ to 46° 00’ W with altimetric variation of 780 to 960 m. It belongs to the Rio Grande basin and is a direct tributary of the Furnas Hydroelectric Power Plant Reservoir. Climate, in accordance with Köppen, is the tropical mesothermal (CwB) (Sparovek et al., 2007) with average annual rainfall of 1,500 mm.
Digital soil classification was carried out with ArcGIS 10.0 software using the State of Minas Gerais Soil Map (UFV et al., 2010) and the classes of relief obtained from the declivity map starting with digital elevation models (DEM) derived from the Shuttle Radar Topography Mission (SRTM) according to procedures by EMBRAPA (2006). The mapping units defined were: dystrophic Red Latosol in the following classes of relief: plain (LVd1), slight undulating (LVd2) and undulating (LVd3) and Undifferentiated Floodplain Soils (SIV) (Figure 1).
Revised Universal Soil Loss Equation (RUSLE) The RUSLE model with GIS technique and with remote sensing, in association with field work, soil physical analyses and data found in literature were applied to estimate water erosion. However, it is worth highlighting that floodplain areas were not taken in consideration since they are subject to sediment accumulation (Mitasova et al., 1996).
The RUSLE is composed of 5 factors (Equation 1) (Renard et al., 1997).
Figure 1 – Location and soil map at Ribeirão Caçús sub-basin, Alfenas, MG.
A = R*K* LS*C*P (1)
Where: A = average annual soil loss (Mg ha-1 year-1);
R = rainfall erosivity factor (MJ mm ha-1 h-1 year-1);
K = soil erodibility factor (Mg h MJ-1 mm-1); LS =
Rainfall erosivity factor (R) was obtained from the rainfall erosivity map in the South of Minas Gerais by Aquino et al. (2012), who determined the values of R considering fifty-four pluviometric stations by using Fournier Index adjusted for Lavras - MG (Val et al., 1986), the kriging method being used as interpolator.
For the K factor, the number 1 indirect model by Silva et al. (1999), proposed to estimate erodibility of Brazilian Latosols, was applied. According to the authors, number 1 model showed the highest determination coefficient (r2).
The number 1 model is expressed in equation 2.
were in accordance with Silva et al. (1999). Variables X22 to X27 and X31 and X32 were obtained from texture
analyses by the hydrometer method (Gee; Bauder, 1986). For that purpose, a sample was collected from the surface layer (0 – 20 cm) under native vegetation of each Latosol unit (Figure 2) according to procedures by Lemos et al. (2005). Variable X34 was obtained in
accordance with EMBRAPA (2011).
LS factor was estimated by applying the RUSLE 3D model (Mitasova et al., 1996) represented in equation 3.
Y = 4,77 x 10⁻² – 9,66 x 10-3 X
14 + 1,63 x 10-2 X16
– 1,12 x 10-2 X
17 + 1,85 x 10-2 X18 – 1,51 x 10-2
X19 – 2,46 x 10-4 X22 – 3,58 x 10-4 X23 + 1,47 x
10-4 X
24 – 1,43 x 10-4 X25 + 3,26 x 10-3 X26- 1,26 x
10-3 X
27 – 2,29 x 10-4 X31 + 1,07 x 10-4 X32 + 2,69
x 10-4 X 34
(2)
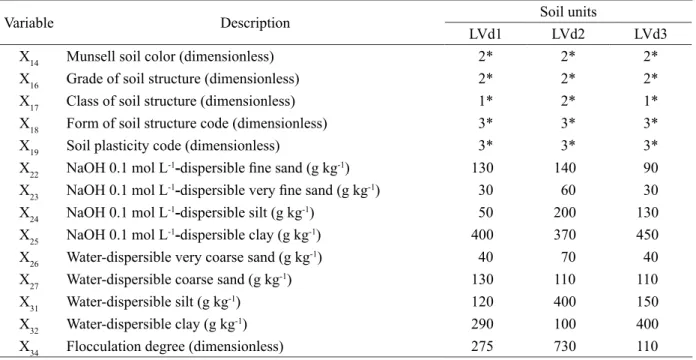
Table 1 – Variables value in number 1 model by Silva et al. (1999).
Variable Description Soil units
LVd1 LVd2 LVd3
X14 Munsell soil color (dimensionless) 2* 2* 2*
X16 Grade of soil structure (dimensionless) 2* 2* 2*
X17 Class of soil structure (dimensionless) 1* 2* 1*
X18 Form of soil structure code (dimensionless) 3* 3* 3*
X19 Soil plasticity code (dimensionless) 3* 3* 3*
X22 NaOH 0.1 mol L-1-dispersible fine sand (g kg-1) 130 140 90
X23 NaOH 0.1 mol L-1-dispersible very fine sand (g kg-1) 30 60 30
X24 NaOH 0.1 mol L-1-dispersible silt (g kg-1) 50 200 130 X25 NaOH 0.1 mol L-1-dispersible clay (g kg-1) 400 370 450
X26 Water-dispersible very coarse sand (g kg-1) 40 70 40
X27 Water-dispersible coarse sand (g kg-1) 130 110 110
X31 Water-dispersible silt (g kg-1) 120 400 150
X32 Water-dispersible clay (g kg-1) 290 100 400
X34 Flocculation degree (dimensionless) 275 730 110
*Values codified as per Silva et al. (1999). LVd: dystrophic Red Latosol.
m n
LS = (m + 1) (A x B / 22,13) x (sen /0,0896) θ (3)
Were: LS = topographic factor; A = contribution area upstream by unit of cell length (m2) for a DEM; B = DEM
cell size; = slope gradient, and, m and n = constants that depend on type of surface runoff flow and of soil properties.
DEM Topodata, obtained from Instituto Nacional de Pesquisas Espaciais (INPE), with pixel resolution of approximately 30 m, corresponding to orbit/point 21s465ZN, was used. The adoption of this DEM was based on Bhattarai e Dutta (2007), who obtained more accurate water erosion estimate with Where: Y = erodibility (Mg h MJ-1 mm-1) and other
variables described in table 1.
Variable X14 was based on recognition of soil in
the region under influence of Furnas Reservoir (Brasil, 1962). Variables X16 to X19 were obtained locally from
DEM of 30 m resolution and pointed that accuracy would be related to similarity between the resolution and the 22.13 m slope length originally used by the USLE.
Starting from the DEM, the contribution area and declivity parameters were obtained with the ArcGIS 10.1 software and in the extension TauDEM 5.1.1 (Tarboton; Mohammed, 2013). First, the DEM was corrected by filtering anomalous altitude values pixels. Next, the direction flow was obtained by D (deterministic infinity) method (Tarboton, 1997) which, automatically, gave the slope degree(Figure 2A) and the contribution area (Figure 2B). Oliveira et al. (2012) pointed out that the D method is the most efficient in simulating surface runoff.
∞
∞
In equation 3, m and n values were 0.4 and 1.0, respectively, designated to represent laminar and concentrated flows in areas with high spatial variability of land use and soil properties, and, therefore, considered the most fit for complex reliefs such as hydrographic basins (Mitasova et al., 2001; Oliveira et al., 2013).
In this study, the P factor was not considered since it is the least found in literature and collecting the data empirically is time-consuming and expensive. This decision is supported by Bahadur (2009) who points out that several scientific publications disregard this factor in the water erosion estimate by the USLE/RUSLE.
The C factor was obtained from multi temporal mapping of land use attributing values in accordance with literature. For mapping satellite images Landsat-5 Thematic Mapper (TM), in TM2, TM4 and TM5 bands, corresponding to orbit 219 point 74, were obtained from INPE. Dates selected were 05/02/1986, 08/17/1996, 09/14/2006 and 08/27/2011, due to favorable weather conditions and to the dry season, which favors discrimination between pasture and cultivated land in the images.
Images treatment was carried out with ENVI 4.5 and ArcGIS 10.1 softwares. First, the images were geometrically corrected by control points with reference to WGS-84 (World Geodetic System). At this stage, images can be overlapped concerning the same site at the piece of land in study and to integrate information extracted from images with other plans of cartographic information: drainage, roads, contour lines, soil maps, etc. In order to classify land use, the visual interpretation of images technique was adopted based on TM4, TM5 and TM2 color composition, in RGB (Red, Green and Blue). The land use class map was based on color, texture, pattern and context analyses, besides works of field verification.
Discriminated land use classes and respective values of C factor adopted were: native forest 0.002 and eucalyptus: 0.30 (Martins et al., 2010); pasture: 0.1 (Roose, 1977); coffee: 0.088 (Prochnow et al., 2005); corn: 0.122 (De Maria; Lombardi Neto, 1997); sugarcane: 0.1 (Nilo et al., 2011) and bare soil: 1.0.
To assess whether land use changes degraded the soil of the area, the soil loss averages were compared by t test at 5% of significance for each year mapped. The soil loss average and standard deviation values were obtained from ArcGIS 10.1 software and the t test was accomplished on SISVAR statistic software (Ferreira, 2014).
Soil Loss Tolerance
The limit values for SLT were determined by the method proposed by Bertol and Almeida (2000) (Equation 4). In accordance with Oliveira et al. (2011), this method is the most used for SLT calculation in Brazil.
Where: SLT = soil loss tolerance (Mg ha-1 year-1); h =
effective depth of soil (mm), limited to 1,000 mm; ra = relation that expresses at the same time the effect of texture relation between horizons B and A and of the clay content in horizon A; m = factor that expresses the effect of organic matter in the 0 - 20 cm soil layer; p = factor that expresses the effect of soil permeability and 1,000 = constant that expresses the period of time necessary to erode a 1,000 mm thick soil layer.
Variables h, r e ra were obtained from Brasil (1962), the clay content in horizon A was obtained by the method of variable X25 (Table 1), variable m was obtained from EMBRAPA (2011) and variable p was determined at field by a constant permeameter method (Lima et al., 1990) with three repetitions in each Latosol unit under native forest. SLT values were correlated to soil loss map, where SLT was discriminated for each Latosol unit.
RESULTS AND DISCUSSION
From the RUSLE parameters, the erosivity value for the study area is of 6,500 MJ mm ha-1 h-1 year-1
(Aquino et al., 2012). For those authors, such erosivity with inadequate use and management may lead to relevant soil losses caused by water erosion linked to the intensity, frequency and quantity of rainfall in the region.
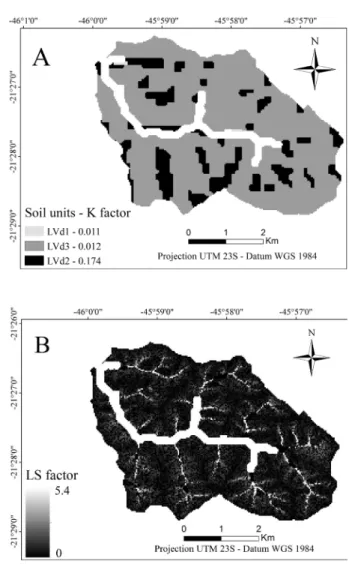
From variables in equation 2, listed in table 1, the erodibility of each Latosol unit mapped was estimated and the values are presented in figure 3A.
The values of X26 and X34 variables in table 1and of
the erodibility in unit LVd2 (Figure 3A) were discrepant in relation to Brazilian Latossols (Silva et al., 1999). In fact, the erodibility is complex and from combination of various soils attributes. But, these differences are related to heterogeneous behavior of tropical soils attributes, especially in water-dispersible analysis. The presence of iron oxide, aluminum and silt contributed for the elevation of granulometric fractions due to water-dispersible clay.
SLT = h ra m p 1,000-1 (4)
Figure 3 – Soil erodibility (A) and topographic factor (B) of the Ribeirão Caçús sub-basin, Alfenas, MG.
LS values obtained from equation 3 varied spatially from 0 to 5.4 (Figure 3B), which show the RUSLE-3D model suitability (Mitasova et al., 1996) concerning estimates of water erosion at basins, due the highest LS values were concentrated where accumulation of the surface runoff flow was more intense. Oliveira et al. (2013) pointed out that soil loss estimate by applying the RUSLE 3D model does not differ statistically from empirical determination.
Multitemporal map of land use is shown in figure 4, and variation in the land use, in the period is described in table 2.
Table 2 – Spatial and temporal distribution of land use from 1986 a 2011 at the Ribeirão Caçús sub-basin, Alfenas, MG.
Land use Area (1986) Area (1996) Area (2006) Area (2011)
ha % ha % ha % ha %
Native Forest 329.8 13.8 295.9 11.4 261.2 11.0 251.6 11.0 Pasture 1,384.5 67.9 1,290.5 69.5 1,131.6 66.7 1,183.3 62.1
Coffee 175.6 8.8 183.9 9.7 251.3 12.6 223.8 12.4
Corn 73.3 3.8 120.8 2.9 214.7 4.6 243.1 8.7
Sugarcane 90.8 4.5 154.4 4.8 196.6 3.9 153.0 3.4
Bare soil 16.0 0.5 22.2 1.0 24.6 1.2 25.2 2.4
Eucalyptus 10.0 0.7 12.3 0.7 - - -
-Total 2,080 100 2,080 100 2,080 100 2,080 100
Figure 5 – Estimates of soil loss by water erosion from 1986 to 2011 of the Ribeirão Caçús sub-basin, Alfenas, MG.
Table 3 – Areal distribution of soil loss in the studied area and soil loss qualitative classes, adapted from Beskow et al. (2009).
Soil loss rate Mg ha-1 year-1 Area % Soil loss classes qualitative
1986 1996 2006 2011
0 - 2.5 78.7 78.4 78.3 78.1 Slight
2.5 - 5 4.3 4.1 4.1 4.2 Slight/moderate
5 - 10 4.1 4.2 4.0 4.1 Moderate
10 - 15 2.2 2.2 2.3 2.4 Moderate/High
15 - 25 1.8 2.1 2.1 2.2 High
25 - 100 1.1 1.1 1.1 1.1 Very high
> 100 0.3 0.3 0.4 0.4 Extremely high
Considering table 3, the percentage of areas with slight, slight/moderate and moderate classes decreased and the areas with moderate/high, high, very high classes increased in small extent. The soil loss average value was of 2.41, 2.47, 2.65 and 2.65 Mg ha-1 year-1, respectively.
Thus according to t test there was no significant difference among the average values (p = 0.18). Therefore, the land use changes did not degrade the water and soil resources.
Variable values in equation 4 and SLT values for Latosol units are presented in table 4.
Areas at Ribeirão Caçús sub-basin with soil loss above SLT are shown in figure 6.
Table 4 – Variable values of Equation 4, and of SLT for Latosols in the study area, according with Bertol and Almeida (2000).
Soil Unit Equation 4 variables SLT (Mg ha-1 year-1)
h ra m p
LVd1 1000 1 0.7 0.7 5.4
LVd2 1000 0.9 1 0.7 6.9
LVd3 1000 1 0.85 0.7 6.5
h = Limited, at maximum, to 1,000. LVd: dystrophic Red Latosol.
Figure 6 – Soil loss tolerance by water erosion estimated for the period from 1986 to 2011 for the Ribeirão Caçús sub-basin, Alfenas, MG.
Changes in land cover influence soil loss by water erosion and may cause environmental and socio-economical impacts. Therefore, monitoring this dynamics is essential to implementing measures for management and planning of natural and economic resources, aiming the mitigating of degradation processes such as those observed at Ribeirão Caçús sub-basin, which is reference in the reservoir system of Furnas Hydroelectric Power Plant and presents a history of consistent use along several years.
CONCLUSIONS
The obtained data demonstrate that the land use changes did not degrade the soils of sub-basin in the study period.
ACKNOWLEDGEMENTS
The authors acknowledge Fundação de Amparo à Pesquisa do Estado de Minas Gerais (FAPEMIG – PPM 00422-13), Conselho Nacional de Desenvolvimento Científico e Tecnológico (CNPq – 471522/2012-0 and 305010/2013-1) and Coordenação de Aperfeiçoamento de Pessoal de Nível Superior (CAPES), for financial support and scholarships.
REFERENCES
AQUINO, R.F. et al. Variabilidade espacial da erosividade da chuva na região Sul de Minas Gerais, Brasil. Ciência e Agrotecnologia. 36(5):533-542, 2012.
AVANZI, J.C. et al. Spatial distribution of water erosion risk in a watershed with eucalyptus and Atlantic Forest. Ciência e Agrotecnologia. 37(5):427-434, 2013.
BAHADUR, K.C.K. Mapping soil erosion susceptibility using remote sensing and GIS: A case of the Upper Name Wa Watershed, Nan Province, Thailand. Environmental Geology. 57(3):695-705, 2009.
BERTOL, I.; ALMEIDA, J.A. Tolerância de perda de solo por erosão para os principais solos do Estado de Santa Catarina. Revista Brasileira de Ciência do Solo. 24(3):657-668, 2000.
BESKOW, S. et al. Soil erosion prediction in the Grande River Basin, Brazil using distributed modeling. Catena. 79(1):49-59, 2009.
BHATTARAI, R.; DUTTA, D. Estimation of soil erosion and sediment yield using GIS at catchment scale. Water Resources Management. 21(10):1635-1647, 2007.
BRASIL. Ministério da Agricultura. Levantamento de reconhecimento dos solos da região sob Influência do Reservatório de Furnas. Rio de Janeiro: Boletim Técnico n° 13 do Serviço Nacional de Conservação dos Solos, 1962. 462p.
DE MARIA, I.C.; LOMBARDI NETO, F. Razão de perdas de terra e fator C para sistemas de manejo da cultura do milho. Revista Brasileira de Ciência do Solo. 21:263-270, 1997.
EMBRAPA - EMPRESA BRASILEIRA DE
PESQUISAS AGROPECUÁRIA. Sistema Brasileiro
De Classificação De Solos. 2.ed. Rio de Janeiro: EMBRAPA Solos, 2006. 306p
EMBRAPA - EMPRESA BRASILEIRA DE PESQUISA AGROPECUÁRIA. Manual de métodos de análise de solos. 2. ed. Rio de Janeiro: EMBRAPA Solos, 2011. 230p.
FERREIRA, D.F. SISVAR: A guide for its bootstrap procedures in multiple comparisons. Ciência e Agrotecnolgia. 38(2):109-112, 2014.
GEE, G.W; BAUDER, J.W. Particle size analysis. In: KLUTE, A. (ed.). Methods of soil analysis: part 1. Madison: American Society of Agronomy, 1986. p. 383-411.
JORDAN, G. et al. Historical land use changes and their impact on sediment fluxes in the Balatom basin (Hungary). Agriculture, Ecosystems & Environment. 108(2):119-133, 2005.
LEMOS, R.C. et al. Manual de descrição e coleta de solos no campo. 5.ed. Viçosa: SBCS, 2005. 52p.
LIMA, J.M. et al. Dispersão do material de solo em água para avaliação indireta da erodibilidade de latossolos. Revista Brasileira de Ciência do Solo.14:85-90, 1990.
MARTINELLI, L.A.; FILOSO, S. Expansion of sugarcane ethanol production in Brazil: environmental and social challenges. Ecological Applications.18(4):885-898, 2008.
MARTINS, S.G. et al. Fator cobertura e manejo do solo e perdas de solo e água em cultivo de eucalipto e em Mata Atlântica nos Tabuleiros Costeiros do Estado do Espírito Santo. Scientia Forestalis. 38(87):517-526, 2010.
MITASOVA, H. et al. Modelling topographic potential for erosion and deposition using GIS. International Journal of Geographical Information System.10(5):629- 641, 1996.
MITASOVA, H. et al. Terrain modeling and soil erosion simulation: applications for Ft. Hood Report for USA CERL. Urbana-Champaign: University of
MORGAN, R.P.C.; NEARING, M.A. Handbook of erosion modeling. West Sussex: Wiley - Blackwell, 2011. 352p.
NEEDELMAN, B. A. What are soils? Nature
Education Knowledge.4(3), 2013. Available in http:// www.nature.com/scitable/knowledge/library/what-are-soils-67647639. Acesso em: junho de 2013.
NILO, S.F. A. de . et al. Impacto técnico e econômico das perdas de solo e nutrientes por erosão no cultivo da cana-de-açúcar. Engenharia Agrícola. 31(3):539-550, 2011.
OLIVEIRA, A.H. et al. Consistência hidrológica de modelos digitais de elevação (MDE) para definição da rede de drenagem na sub-bacia do horto florestal terra dura, Eldorado do Sul , RS. Revista Brasileira de Ciência do Solo. 36(4):1259-1267, 2012.
_____________. et al. Development of topographic factor modeling for application in soil erosion models. In: SORIANO, M. C. H. Soil processes and current trends in quality assessment. Rijeka: InTech, 2013. p. 111-138.
OLIVEIRA, P.T.S. et al. Erosion risk mapping applied to environmental zoning. Water Resources Management. 25(3):1021-1036, 2011.
PROCHNOW, D. et al. Razão de perdas de terra e fator C da cultura do cafeeiro em cinco espaçamentos, em Pindorama (SP). Revista Brasileira de Ciência do Solo. 29(1):91-98, 2005.
PRUSKI, F.F. Prejuízos decorrentes da erosão hídrica e tolerância de perdas de solo. In: PRUSKI, F.F. Conservação do Solo e da Água. 2.ed. Viçosa: Editora UFV, 2006. cap. 2, p. 24-39.
RENARD K.G. et al. Predicting soil erosion by water: a guide to conservation planning with the revised
universal soil loss equation (RUSLE). Washington, DC: USDA, Agriculture Handbook. (703):384, 1997.
ROOSE, E.J. Application of the universal soil loss equation of Wischmeier and Smith in West Africa. In: GREENLAND, D.J.; LAL, R. Soil conservation and management in the humid tropics. New Jersey: Jophn Wiley & Sons, 1977. p.177-187.
SILVA, M.L.N. et al. Proposição de modelos para estimativa da erodibilidade de latossolos brasileiros. Pesquisa Agropecuária Brasileira. 34(12):2287-2298, 1999.
SPAROVEK, G. et al. Computer assisted Köppen climate classification: case study for Brazil.
International Journal of Climatology. 27(2):257-266, 2007.
TARBOTON, D.G. A new method for the determination of flow directions and upslope areas in the grid digital elevation models. Water Resources Research. 33(2):309-319, 1997.
TARBOTON, D.G.; MOHAMMED, I. N. TauDem 5.1.1: terrain analysis using digital elevation models. Available in: http://hydrology.usu.edu/taudem/taudem5/ downloads.html. Access on: 23 ago. de 2013.
UFV. et al. Mapa de solos do Estado de Minas Gerais. Belo Horizonte, Fundação Estadual do Meio Ambiente, 2010. 49p. Disponível em: <http:// www.feam.br/ noticias/1/949-mapas-de-solo-do-estado-deminas-gerais> Acesso em: 03 de out. de 2012.
VAL, L.A. et al. Erosividade das chuvas em Lavras, MG. Ciência e prática. 10(2):199-209, 1986.