ISSN 1557-4989
© 2009 Science Publications
Corresponding Author: Sedigheh Lotfi, Department of Geography, University of Mazandaran, P.O. Box 416, Babolsar, Iran
Soil Erosion Prediction Based on Land Use Changes (A Case in Neka Watershed)
1
Karim Solaimani,
2Saeid Modallaldoust and
3Sedigheh Lotfi
1Remote Sensing Center, University of Agricultural and Natural Resources,
P.O. Box 737, Sari, Iran
2
Department of Watershed Management,
University of Agricultural and Natural Resources, P.O. Box 737, Sari, Iran
3Department of Geography, University of Mazandaran, P.O. Box 416, Babolsar, Iran
Abstract: Problem statement: Land use change has transformed a vast part of the natural landscapes of the developing world for the last 50 years. Land is a fundamental factor of production and though much of the course of human history, it has been tightly coupled with economic growth. Soil erosion by water is one of the most important land degradation processes in the Mediterranean basins. The unplanned land use change within and near a fast growing agricultural land in Neka River Basin, led to an accelerated erosion of soil in the area. Approach: This study aims to find the relationships between land use pattern, erosion and the sediment yield in the study area. The land use coefficient (Xa) has applied in the model of Erosion Potential Method (EPM) to forecast the effect of the land type to reduce the erosion. Land cover and land use change was projected for the next decade using topography, geology, land use maps and remote sensing data of the study area. Results: The results of this study indicated that the total sediment yield of the study area has notably decreased to 89.24% after an appropriate land use/cover alteration. The estimated special erosion for the Southern Neka Basin is about 144465.1 m3 km−2 where after management policy is predicted 15542.9 m3 km−2 year−1, therefore the total difference for the study area has estimated about 128922.2 m3 km−2 year−1.
Conclusion: The land use changes assessed among the different land cover classes. It is important to mention that conducting of the present study a very severe land cover changes taken place as the result of agricultural land development. These changes in land cover led to the forest degradation of the study area. Relationship between land-use changes and agricultural growth offered a more robust prediction of soil erosion in Neka watershed.3
Key words: Land-cover, change detection, Erosion Potential Method (EPM), Iran
INTRODUCTION
Intensive use of natural resources calls for increasingly detailed inventories of its components and an investigation of the changes which took place in the past[1]. This is particularly important in fast, usually unplanned, changing areas, such as agricultural land expansion in Northern part of Iran. At present, physical expansion of urban areas and extensive use of land for agricultural purposes are the main causes of land use change in the developing countries. Land cover change directly affects ecological landscape functions and processes with far-reaching consequences for biodiversity and natural resources[2,3]. The potential for surface runoff and soil erosion has mostly affected by land use and cultivation[4]. Erosion is one of the most significant forms of land degradation (soil truncation, loss of fertility, slope instability), greatly influenced by
land use and management[5,6]. Soil forming environments and erosion processes is a much-debated question when studying the relationship between human impact and environment change[7,8]. Agricultural land use is one of the most important factors that have shaped historic landscapes in Europe[9-18]. Bandar et al.[19] in a study entitled ex-post evaluation of erosion control in Southern Mali, compared the erosion situation in a rural area. Fanetti and Vezzoli[20] were calculated sediment input using different magnitude equations for the Alpine watershed and the Erosion Potential Method (EPM) in GIS environment.
spatially distributed input data (geology, soil and land use) in a Geographic Information Systems (GIS) environment[20,22,23]. Using GIS technique is based on calibrated values of four basic factors which influence erosion rate: (a) Climate (precipitation and temperature), (b) Vegetation (type and distribution), (c) Relief (difference in elevation; slope angle) and (d) Soil and rocks properties (erodibility and porosity). To calibrate of these factors we need to prepare some data such as field survey, map digitization, extensive data processing and model validation. The process of erosion estimation and sediment transport would be significantly simpler by using aerial photographs and satellite data, digital and thematic maps. This study applied GIS as a priority technique in watershed management to identify and quantitative classification for an extensive area with a similar pattern of erosion. This would require to produce a Digital Elevation Model (DEM) and identifying the area with a similar conditions such as geological and vegetation characteristics. The final creation would be a multi-layer map to identify area with a similar erosion patterns. The EPM gives an efficient combination of physical parameters such as geology (y coefficient), soil dynamics (Ψ coefficient) and vegetation (Xa
coefficient) contribution. In this study, EPM model and analytical GIS tools used for the land management in order to erosion reduction in the study area. Land use changes related to the slop factor is capable to reduce the rate of erosion up to 89.24%.
MATERIALS AND METHODS
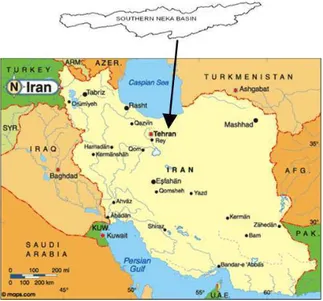
Neka river basin one of the largest watershed in Mazandaran Province is draining the northern flank of Alborz range to the Caspian Sea which divides Neka city as eastern and western parts. The tributaries of this watershed originated from mountainous and forest upland and geologically covered by Shemshak and Quaternary materials. Climate is temperate and seasonal; original land-cover was temperate hyrcanian mixed forest. Major land-uses in the area are rain-fed agriculture and cattle-grazing. The geographical location of the Southern Neka basin is indicate 530,07/,57// E.-540,09/,03//E. and 360,19/,50//N.-360,32/,42//N., based on Neka topography map published by the Iranian Geographical Organization (Fig. 1).
To quantify land cover-land-use change land-cover patterns were interpreted on sequential black and white panchromatic aerial photographs (1955, 1965 and 1994), corresponding to the Southern Neka basin and the surrounding area. Aerial photography approximate scales were, respectively, 1:55,000, 1:50,000 and 1:20,000.
Fig. 1: Geographic location of Southern Neka Basin
used by EPM model in GIS environment[25]. The following sections describe the used techniques to generate the data layers and to evaluate the erosion factors for EPM model based on geographic information system.
Data base generation: Field-established, interpreted aerial photographs for both land-cover (1955s, 1965s and 1994s) and landforms were digitized in a standard digitizing tablet. Geometric correction was accomplished in the GIS through monoploting, a compensation approach for inner photo orientation that requires the metric coordinates of a set of at least nine control points from every photo and corresponding base map and altitude form a digital elevation model (DEM)[26]. Thus, geometrically corrected mosaics of land-cover and relief were obtained and labeled. Accuracy for both position and labeling was controlled thoroughly following Bocco and Riemann[27]. Geological data was extracted from interpreted aerial photographs at 1:50,000 scale, as well as filed observations (Fig. 2). Rock exposures in the study area consist of limestone, marl, shale, sandstone and conglomerate, with different erodibility. Lithological units were reclassified to 10 categories based on their sensitivity to erosion. Soil types were classified and assigned according to experimental data from field observation and sampling, using the Approximate Seventh Soil Taxonomy[28]. Data for estimating the coefficient of rock and soil resistance to erosion (y-factor) were obtained by examining rock and soils from 300 test sites, representative of the major rock and soil map units. The test sites were subjectively examined and evaluated based on the type of lithology, thickness of beds, degree of cementation and density of fractures and joints. The coefficients of rock and soil resistance to erosion (y-factor) were assigned for each map class
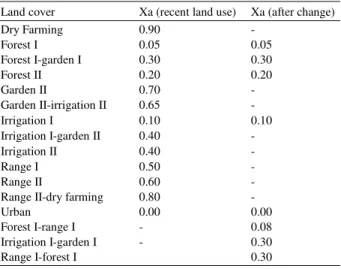
using the methodology thoroughly following Feyznia[29]. To determine the Xa-factor value utilized by the EPM method, land use map was generated using Indian Remote Sensing (IRS) data acquired in 2006 (Fig. 3). Several enhancements and classification techniques were used, related to ground truth data from field excursions in 2006 and 2007, to delineate training areas of identified land cover categories for the Southern Neka Roud Basin. Some ignorable land use changes were occurred between the time of satellite data collection and the field surveys. The land use coefficient (Xa) related to each land use class was estimated from EPM Guide Table[25]. This model classifies land uses in 10 categories and evaluates the coefficient Xa from 0.1 (for high-density woodland) to 1.0 (for badlands). The study area was classified to 16 categories and the land use coefficient was evaluated for each map class (Table 1).
Table 1: Land use coefficient (Xa) used in EPM model
Land cover Xa (recent land use) Xa (after change)
Dry Farming 0.90 -
Forest I 0.05 0.05
Forest I-garden I 0.30 0.30
Forest II 0.20 0.20
Garden II 0.70 -
Garden II-irrigation II 0.65 -
Irrigation I 0.10 0.10
Irrigation I-garden II 0.40 -
Irrigation II 0.40 -
Range I 0.50 -
Range II 0.60 -
Range II-dry farming 0.80 -
Urban 0.00 0.00
Forest I-range I - 0.08 Irrigation I-garden I - 0.30
Range I-forest I 0.30
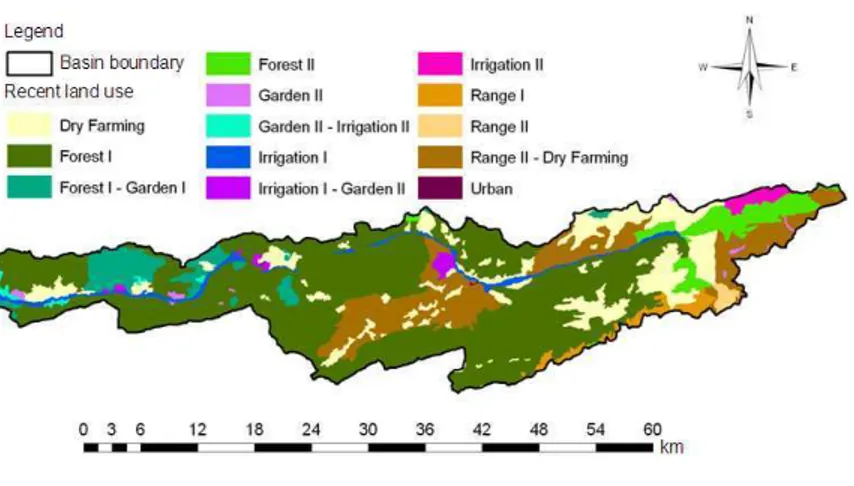
Fig. 3: Recent land use of Neka basin
Table 2: using recent land use condition to prediction Prediction Condition
“Irrigation I-Garden I” Slope = 0-5 and Xa > 0.3 “Recent land use” Slope = 0-5 and Xa ≤ 0.3 “Forest I-Garden I” Slope = 5-10 “Forest I-Garden I” “Range I-Forest I” Slope = 10-15 and Xa > 0.3 “Recent land use” Slope = 10-15 and Xa ≤ 0.3 “ Forest I-Range I” Slope = 15-30 and Xa > 0.08 “Recent land use” Slope = 15-30 and Xa ≤ 0.08 “ Forest I” Slope > 30 and Xa > 0.2 “Recent land use” Slope > 30 and Xa ≤ 0.2
Land slopes were calculated using 1:25000 topographic maps produced by the National Cartographic Center of Iran. Interpolation Tool in Arc GIS9.2 software used the original digital data in Micro Station Design (DGN) format to build up a DEM (Digital Elevation Model) of the study area[30]. A raster grid cell of 50×50 meters was generated and then applied for the DEM of study area. The slopes were reclassified into five categories of 0-5, 5-10, 10-15, 15-30 and more than 15-30. Therefore estimated land use index was calculated for both the land and the amount of erosion. Finally, the mentioned method was used in Arc view/3.3 software to gain an optimized land use for the study area (Table 2).
EPM model: The Erosion Potential Method (EPM) is a
model for qualifying the erosion severity and estimating the total annual sediment yield of a catchment area. This model is initially developed in Yugoslavia by Gavrilovic[31]. The Erosion Potential Method considers six factors such as; surface geology and soils, topographic features, climate (including mean annual rainfall and mean annual temperature) and land use. From these factors; exposed rock and soil, topography and climate are limited in natural class but land use effect is depended on the human activities. The erosion potential method calculates the coefficient of erosion and sediment yield (Z) of a catchment area using the following equation:
0.5
Z=y * Xa * (ψ +I ) (1)
Where:
y = The coefficient of rock and soil resistance, from 2.0-0.25
Xa = The land use coefficient, from 1.0 to 0.05
Ψ = The coefficient value for the observed erosion
processes, from 1.0-0.1, based on the severity of erosion
The factor I is the average land slope in percentage[32]. For sediment production as the following equation was used:
1.5
Wsp=T * H * * Zπ (2)
Where:
Wsp = The average annual specific production of sediment m3 km−2 year−1
T = Temperature coefficient, which is calculated as:
0.5
T=(t / 10+0.1) (3)
With:
t = The mean annual temperature in degrees Celsius H = The mean annual amount of precipitation in
mm year−1
Z = The coefficient of erosion which was calculated from Eq. 1
RESULTES
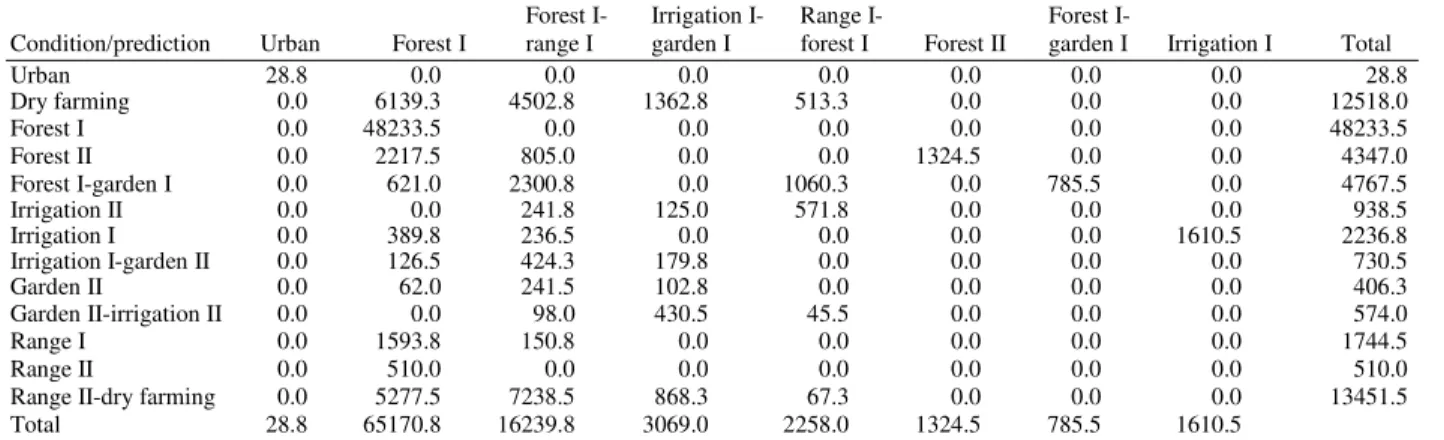
Table 3: the value of area (ha) converting the condition land use to prediction land use
Forest I- Irrigation I- Range I- Forest I-
Condition/prediction Urban Forest I range I garden I forest I Forest II garden I Irrigation I Total
Urban 28.8 0.0 0.0 0.0 0.0 0.0 0.0 0.0 28.8
Dry farming 0.0 6139.3 4502.8 1362.8 513.3 0.0 0.0 0.0 12518.0
Forest I 0.0 48233.5 0.0 0.0 0.0 0.0 0.0 0.0 48233.5
Forest II 0.0 2217.5 805.0 0.0 0.0 1324.5 0.0 0.0 4347.0
Forest I-garden I 0.0 621.0 2300.8 0.0 1060.3 0.0 785.5 0.0 4767.5 Irrigation II 0.0 0.0 241.8 125.0 571.8 0.0 0.0 0.0 938.5 Irrigation I 0.0 389.8 236.5 0.0 0.0 0.0 0.0 1610.5 2236.8 Irrigation I-garden II 0.0 126.5 424.3 179.8 0.0 0.0 0.0 0.0 730.5
Garden II 0.0 62.0 241.5 102.8 0.0 0.0 0.0 0.0 406.3
Garden II-irrigation II 0.0 0.0 98.0 430.5 45.5 0.0 0.0 0.0 574.0
Range I 0.0 1593.8 150.8 0.0 0.0 0.0 0.0 0.0 1744.5
Range II 0.0 510.0 0.0 0.0 0.0 0.0 0.0 0.0 510.0
Range II-dry farming 0.0 5277.5 7238.5 868.3 67.3 0.0 0.0 0.0 13451.5 Total 28.8 65170.8 16239.8 3069.0 2258.0 1324.5 785.5 1610.5
Table 4: Erosion conditions according to the recent land use, m3 km−2 y−1
MIN MAX MEAN
Recent land use erosion erosion erosion Dry farming 78.4 61208.0 32253.6
Forest I 31.6 58182.9 464.7
Forest I-garden I 137.4 41321.1 5983.0 Forest II 335.4 47871.1 2587.4 Garden II 252.5 35510.2 20086.9 Garden II-irrigation II 137.4 25321.0 10891.1 Irrigation I 31.6 39097.1 795.8 Irrigation I-garden II 2718.1 17961.0 10260.8 Irrigation II 1177.9 12236.9 4789.6 Range I 5893.5 19822.8 12216.6 Range II 7737.3 26057.7 17482.3 Range II-dry farming 112.5 53695.1 26653.3
Urban 0.0 0.0 0.0
The results imply that after appropriate land use/cover change, the total erosion of basin has decreased equal to 89.24% (Table 4 and 5).
It can be resulted that two major types of the changes were occurred with respect to the Fig. 3 and 5 and Table 3 such as dry farming to forest I (6139 ha), forest I-range I (4502.8 ha) and range II-dry farming to forest I (5277.5 ha) and finally forest I-range I (7238.5 ha). The areas with dry farming have found in three major parts of upslope, middle and down slopes, as well as through the main channels of the watershed. These three types of the land uses are suitable for the agricultural activities[33].
The land use conversion from dry farming to forest and range caused a considerable reduction of special erosion from 32253.6 to 2630.4 and 824.1 m3 km−2 year−1 respectively according to the filed investigation and extracted data from different sources. We can observe that the areas with dry farming have located in margins of river on the low slope parts based on Fig. 3. The areas with an accelerated amount of erosion and sediment production have been identified as susceptible areas of erosion and sediment yield where needs a priority plan to soil conservation[34,35].
Table 5: Erosion condition according to land use after land use/cover change
MIN MAX MEAN
Predicted land use erosion erosion erosion
Forest I 31.6 6723.7 2630.4
Forest I-garden I 137.5 4593.5 3095.8 Forest I-range I 78.4 6723.7 824.1 Forest II 335.4 5983.9 1517.7 Irrigation I 100.7 1284.9 470.8 Irrigation I-garden I 137.5 2718.1 2092.1 Range I-forest I 948.7 6629.6 4912.0
Urban 0.0 0.0 0.0
Fig. 4: Land use map after management, Neka basin
DISCUSSION
Land degradation processes in the study area are; degradation of natural vegetation due to deforestation and the remarkable land use variation during the last decades. An area with z >1.0 was identified with a potential of severe erosion, while areas with z<0.19 correspond to a slight potential. The average annual specific production of sediments km−2 m−3 year−1 (Wsp), was predicted using Eq. 2. The dominant erosion potential categories were slight to moderate.
An accelerated and severe erosion potential category covers only 20% of the sub catchment area. This part of study area needs an urgent management of erosion hazard to reduce the rate of erodibility. About 70% of the areas with slope class of 0-5% were located in the low erosion potential category; however, more than 30% of the areas with slope classes of more than 30% show a rate of high to very high erosion potential. The amount of special erosion value for the study area was calculated about 144465.1 m3 km−2 year−1.
This amount of erosion would be decreased to 15542.9 m3 km−2 year−1 in the case of an appropriate management. This variation for the all basins is estimated equal to 128922.2 m3 km−2 year−1.
CONCLUSION
There are many factors, which trigger land use changes patterns such as population growth, urbanization, production method and industrialization. The regional and national policies translate these driving forces into land use regulations, therefore, land use changes are often policy driven. Although, the biophysical conditions such as soil characteristics, climate, topography and vegetation determine mostly the spatial pattern of land use and its changes. The users and biophysical environment have the key role, in creating land use changes. Finally, the importance of their behavior and decision policies in response to land use change has only been recognized[34]. It can be concluded that the land use pattern of dry farming is insignificant and could be ignored with respect to the tables and figures. Changing pattern of cultivation with an appropriate land management is a process that could be accomplished simply with new approaches and public participation for a better conservation of resources.
ACKNOWLEDGMENT
Results on which the paper was based were developed during the interest research of the first author
at the University of Agricultural and Natural Resources, Sari-Iran. We thank GIS and RS Centre of the faculty of Natural Resource of Sari for its technical supports during data capture and processing.
REFERENCES
1. Aaviksoo, K., 1995. Simulating vegetation dynamics and land-use in a mire landscape using a Markov model. Landscape Urban Plann., 31: 129-142. http://dx.doi.org/10.1016/0169-2046(94)01045-A 2. Hansen, A.J., R. De Fries and W. Turner, 2004.
Land use Change and Biodiversity: A Synthesis of Rates and Consequences during the Period of Satellite Imagery. In: Land Change Science: Observing, Monitoring and Understanding Trajectories of Change on the Earth’s Surface, Gutman, G. and C. Justice (Eds.). Springer-Verlag, New York, ISBN: 10: 1402025610, pp: 277-299. 3. Stoate, C., N.D. Boatman, R.J. Borralho, C.R. Carvalho,
G.R. De Snoo and P. Eden, 2001. Ecological impacts of arable intensification in Europe. J. Environ. Manage., 63: 337-365. DOI: 10.1006/jema.2001.0473
4. Van Rompaey, A.J.J., G. Govers, E. Van Hecke and K. Jacobs, 2001. The impacts of land use policy on the soil erosion risk: A case study in central Belgium. Agric. Ecosyst. Environ., 83: 83-94. DOI: 10.1016/S0167-8809(00)00173-0
5. Rey, F., 2003. Influence of vegetation distribution on sediment yield in forested gullies. Catena, 50: 549-562. DOI: 10.1016/S0341-8162(02)00121-2 6. Bini, C., S. Gemignani and L. Zilocchi, 2006.
Effect of different land use on soil erosion in the pre-alpine fringe (North-East Italy): Ion budget and sediment yield. Sci. Total Environ., 369: 433-446.
DOI: 10.1016/j.scitotenv.2006.06.001
7. Ballantyne, C.K. and G. Witting Tone, 1999. Late Holocene flood plain incision and alluvial fan formation in the central Grampian Highlands, Scotland: Chronology, environment and implications. J. Q. Sci., 14: 651-671. http://www3.interscience.wiley.com/journal/68501 613/abstract?CRETRY=1&SRETRY=0
9. Black, E.A., E. Strand, G.R. Wright, M.J. Scott, P. Morgan and C. Watson, 1998. Land use history at multiple scales: Implications for conservation planning. Landscape Urban Plann., 43: 49-63. DOI: 10.1016/S0169-2046(98)00096-6
10. Correia, P.T., 2000. Future development in Portuguese rural areas: How to manage agricultural support for landscape conservation? Landscape Urban Plann., 50: 95-106. DOI: 10.1016/S0169-2046(00)00082-7
11. Van Oost, K., G. Govers and P. Desmet, 2000. Evaluating the effects of changes in landscape structure on soil erosion by water and tillage. Landscape Ecol., 15: 577-589. DOI: 10.1023/A:1008198215674
12. Bickik, I., L. Jelecek and V. Stepanek, 2001. Land use changes and their social driving forces in Czechia in the 19th and 20th centuries. Land Use Policy, 16: 65-73. DOI: 10.1016/S0264-8377(00)00047-8
13. Van Rompaey, A.J.J., G. Govers and C. Puttemans, 2002. Modelling land use changes and their impact on soil erosion and sediment supply to rivers. Earth Surface Process. Landforms, 27: 481-494. DOI: 10.1002/esp.335
14. Sun, B., S. Zhou and Q. Zhao, 2003. Evaluation of spatial and temporal changes of soil quality based on geostatistical analysis in the hill region of subtropical China. Geoderma, 115: 85-99. DOI: 10.1016/S1872-2032(07)60059-6
15. Bakker, M.M., G. Govers and M.D.A. Rounsevell, 2004. The crop productivity-erosion relationship: An analysis based on experimental work. Catena, 57: 55-76. DOI: 10.1016/j.catena.2003.07.002 16. Bakker, M.M., G. Govers, C. Kosmas, V. Vanacker,
K. Van Oost and M.D.A. Rounsevell, 2005. Soil erosion as a driver of land use change. Agric. Ecosyst. Environ., 105: 467-481. DOI: 10.1016/j.agee.2004.07.009
17. Jordan, G., A. Van Rompaey, P. Szilassi, G. Csillag, C. Mannaerts and T. Woldai, 2005. Historical land use changes and their impact on sediment flexes in the Balaton basin (Hungary). Agric. Ecosyst.
Environ., 108: 119-133. DOI:
10.1016/j.agee.2005.01.013
18. Szilassi, P., G. Jordan, A. Van Rompaey and G. Csillag, 2006. Impacts of historical land use changes on erosion and agricultural soil properties in the Kali Basin at Lake Balaton, Hungary.
Catena, 68: 96-108. DOI:
10.1016/j.catena.2006.03.010
19. Bodnar, F., W. Spaan and J. Hulshof, 2007. Ex- Post evaluation of erosion control measures in Southern Mali. J. Soil Tillage Res., 95: 27-37. http://cat.inist.fr/?aModele=afficheN&cpsidt=1911 8477
20. Fanetti, D. and L. Vezzoli, 2007. Sediment input and evolution of lacustrine deltas: The Breggia and Greggio rivers case study (Lake Como, Italy). Q. Int., 173-174: 113-124.
DOI: 10.1016/j.quaint.2007.02.008
21. Modallaldoust, S., 2007. Estimation of sediment and erosion with use of MPSIAC and EPM models in GIS environment. Degree Ms. University of Mazandaran, pp: 95.
22. Emmanouloudis, D.A., O.P. Christou and E. Filippidis, 2003. Quantitative Estimation of Degradation in the Alikamon River Basin using GIS. In: Erosion Prediction in Ungauged Basins: Integrating Methods and Techniques, De Boer, D., W. Froehlich, T. Mizuyama and A. Pietroniro (Eds.). IAHS Publication, ISBN: 1-901502-22-8, pp: 234-240. 23. Globevnik, L., D. Holjevik, G. Petkovsek and
J. Rubinic, 2003. Applicability of the Gavrilovic Method in Erosion Calculation using Spatial Data Manipulation Techniques. In: Erosion Prediction in Ungauged Basins: Integrating Methods and Techniques, De Boer, D., W. Froehlich, T. Mizuyama and A. Pietroniro (Eds.). IAHS Publication, ISBN: 1901502228, pp: 22-233.
24. Verstappen, H.Th. and R.A. van Zuidam, 1991. The ITC System of Geomorphological Mapping. ITC Publication, 10 Enschede, The Netherlands. 25. Ahmadi, H.,1998. Applied Geomorphology (Water
Erosion). University of Tehran Press, Iran, ISBN: 964-03-9326-6, pp: 570. (In Persian).
26. Solaimani, K., 2005. Interpretation methodologies in integrating aerial photography and digital base maps. M. Sc students note, University of Mazandaran. (In Persian).
27. Bocco, G. and H. Riemann, 1997. Quality assessment of polygon labeling. Photogramm. Eng.
Remote Sens., 63: 393-395.
http://www.fao.org/agris/search/display.do?f=./199 7/v2317/US9731806.xml;US9731806
28. Solaimani, K. and M. Ahmadi, 2003. Revers, Uiversity of Mazandaran Press, ISBN: 964-6433-73-1, pp: 578. (In Persian).
29. Feyznia, S., 1995. Rocks strength against erosion factors in different climates of Iran. J. Natural Resourc. Iran, 47: 95-116. (In Persian).
31. Gavrilovic, Z., 1988. The use of a empirical method (erosion potential method) for calculating sediment production and transportation in unstudied or torrential streams. Proceeding of the International Conference of River Regime, May 18-20, Wallingford, England, pp: 411-422. http://md1.csa.com/partners/viewrecord.php?reque ster=gs&collection=ENV&recid=9003658&q=The +use+of+a+empirical+method+%28erosion+potent ial+method%29+for+calculating+sediment+produc tion+and+transportation+in+unstudied+or+torrenti al+streams&uid=1365812&setcookie=yes
32. Solaimani, K., 2007. Principles of Engineering Watershed Management. Mazandaran University, Note for M. Sc students, pp: 112. (In Persian). 33. Makhdoum, M.F., 2007. Fundamental of Land Use
Planning. University of Tehran Press, 7th Edn., ISBN: 964-03-4025-1, pp: 289.
34. Veldkamp, A. and L.O. Fresco, 1996. CLUE: A conceptual model to study the conversion of land use and its effects. Ecol. Model., 85: 253-270. DOI: 10.1016/0304-3800(94)00151-0