Index selection of tropical maize genotypes for
nitrogen use efficiency
Ítalo Stefanine Correia Granato (1*); Felipe Pereira Bermudez (2); Gabriel Gonçalves dos Reis (1); Julio César Dovale (3); Glauco Vieira Miranda (1); Roberto Fritsche-Neto (2)
(1) Universidade Federal de Viçosa (UFV), Av. P.H. Rolfs, s/n, 36570-000 Viçosa (MG), Brasil.
(2) Universidade de São Paulo (USP), Escola Superior de Agricultura “Luiz de Queiroz” (ESALQ), Departamento de Genética, Av. Pádua Dias, 11, 13418-900 Piracicaba (SP), Brasil.
(3) Universidade Federal do Ceará (UFC), Departamento de Fitotecnia, Av. Mister Hull, 2977, 60356-000 Fortaleza (CE), Brasil. (*) Corresponding author: [email protected]
Received: Sept. 29, 2013; Accepted: Mar. 24, 2014
Abstract
Nitrogen (N) limitation in maize crops is related to the fact that the efficiency of nitrogen fertilization in maize does not exceed 50%, primarily due to volatilization, denitrification and soil leaching. Therefore, the development of new nitrogen use efficient (NUE) cultivars is necessary. The aim of the present study was to develop indices for the accurate selection of NUE maize genotypes for use in conditions of both high and low N availability. The experiment was conducted in a greenhouse (20°45’14”S; 42º52’53”W) at the Federal University of Viçosa during October 2010. A total of 39 experimental hybrid combinations and 14 maize lines differing in NUE were evaluated under two N availability conditions. We determined the relative importance of the studied characters using principal component analysis, factor analysis and by developing efficient selection indices. We conclude that indirect and early selection of tropical maize genotypes can be performed using the indices IHN = 0.022 SDM + 0.35 RSDM + 0.35 RLA + 0.35 NUE for high N availability environments and ILN = -0.06 RSDM + 0.35 RSAA + 0.35 RLA + 0.39 SDM for low N availability environments.
Key words: abiotic stress, NUE, maize improvement.
Índices de seleção de genótipos de milho tropical para eficiência no uso de nitrogênio
Resumo
As limitações do N no cultivo do milho relacionam-se ao fato de a eficiência da adubação nitrogenada no milho não ultrapassar os 50%, principalmente devido aos processos de perda por volatilização, desnitrificação ou lixiviação no solo. Nesse contexto, torna-se importante o desenvolvimento de cultivares eficientes no uso de N (EUN). Assim, o objetivo foi elaborar índices que permitissem a seleção acurada de genótipos de milho eficientes no uso de nitrogênio para as condições de alta e baixa disponibilidade desse nutriente. O experimento foi conduzido em casa de vegetação na Universidade Federal de Viçosa (20º45’14’’S; 42º52’53’’W) durante o mês de outubro de 2010. Foram avaliadas 39 combinações híbridas experimentais e 14 linhagens de milho divergentes para a eficiência no uso de N em duas condições de disponibilidade desse nutriente. Foram realizadas a análise de importância relativa dos caracteres estudados, estimada por meio do método dos componentes principais, a análise de fatores e a confecção dos índices de seleção. A seleção indireta e precoce para genótipos de milho tropical pode ser realizada por meio dos índices IAN = 0,022 MPS + 0,35 PASR + 0,35 CRAXI + 0,35 EUN, para ambientes de alta disponibilidade de nitrogênio, e IBN = -0,06 PSAR + 0,35 ASAXI + 0,35 CRAXI + 0,39 MPS, para condições de baixa disponibilidade de nitrogênio.
Palavras-chave: estresse abiótico, EUN, melhoramento de milho.
1. INTRODUCTION
The current increase in maize production in Brazil has been largely due to the expansion of crops in the Cerrado region. However, in addition to the low availability of water during the dry season, some the Cerrado are limited in their agricultural potential by low soil fertility, particularly with respect to nitrogen (N).
N limitation in maize crops is related to the fact that the N fertilization efficiency in this species does not exceed 50%, primarily due to N loss by volatilization,
denitrification and soil leaching (Deuner et al., 2008; Gallais and Hirel, 2004). In addition, the cost of N fertilization has been increasing each year. As a consequence, small producers invest relatively little in N fertilizer, making it difficult to reach high levels of productivity in some areas of maize production.
Considering this, the development of new N use efficient (NUE) cultivars is becoming increasingly important. Ultimately, the identification of NUE genotypes for use
Crop Production and Management |
by farmers or as progenitors in breeding programs could allow for increased maize production. Indeed, several studies have associated specific secondary characters with NUE (Dovale et al., 2012; Fritsche-Neto et al., 2012), and these characters could be useful for early and indirect selection of superior NUE genotypes in environments with low or high N availability, provided that appropriate combinations of characters can be identified for simultaneous selection.
When large numbers of characters are used for evaluation and selection, multicollinearity can occur. Therefore, multivariate analyses, such as factor analysis (Ferreira et al., 2005), are useful statistical procedures for the development of efficient selection indices. Using this methodology, the initially evaluated characters are replaced with a smaller number of latent characters, referred to as factors. Factors are then used to group characters to minimize variance within groups and maximize variance between groups (Cruz and Carneiro, 2006). Therefore, factors, when combined with principal component analysis, can be used to ignore characters that are not useful for discriminating between genotypes, allowing for more elaborate selection indices.
Considering the above, the aim of this study was to develop indices for the accurate selection of NUE maize genotypes under high and low N availability conditions.
2. MATERIAL AND METHODS
The experiment was conducted in a greenhouse located at the Diogo Alves de Mello Experimental Field (20º45’14”S; 42º52’53”W) of the Horticultural Department of the Federal University of Viçosa (Universidade Federal de Viçosa - UFV), Minas Gerais, during the month of October 2010. A total of 39 experimental hybrid combinations using 14 maize lines – obtained from the Maize Programgermplasm
bank and differing in NUE – were evaluated under two N availability conditions. The present study used a completely randomized design with two replicates and a simple factorial scheme (53 genotypes × two N levels). The plots consisted of one plant per pot.
The seeds were sterilized and subsequently germinated in polyethylene trays in individual cells. Following germination, one seedling of each genotype was transplanted to a cylindrical PVC pot with a 4 dm3 capacity (10 cm diameter × 50 cm
height) filled with a substrate mix consisting of washed sand and vermiculite (1:1), according to Walk et al. (2006).
A nutrient solution was supplied every two days beginning on the seventh day post-transplantation. For the high N (HN) and low N (LN) availability conditions, the solutions used were as described by Chun et al. (2005). Namely, the HN solution contained 2.0 mmol l–1 N and the LN solution
contained 0.2 mmol l–1 N, making the HN solution ten
times more concentrated than the LN solution with respect to N content.
Plants were harvested at the vegetative stage with six fully expanded leaves (V6), at which time the shoot was separated from the roots. The characters measured included the following: shoot dry mass (SDM), root dry mass (RDM), lateral root length (RLL), axial root length (RLA), lateral root surface area (RSAL) and axial root surface area (RSAA). The dry mass measurements were determined after drying the samples in an oven for 72 hours at 60 °C with forced air circulation. The root lengths and areas were obtained using a WinRhizo PRO 2009c image analyzer (Regent, Canada) coupled to a professional Epson XL 10000 scanner (Japan) equipped with a light transparency unit (TPU), as described by Bouma et al. (2000), with the exception that the entire root was used rather than just a sample. Roots with diameters less than or equal to 0.5 mm were considered to be lateral roots, whereas those with diameters greater than 0.5 mm were considered to be axial roots (Trachsel et al., 2009). Using these values, the specific root surface (SRS) and root/shoot dry mass (RSDM) ratios were calculated using the following equations:
L A
RSA RSA
SRS
RDM + =
SDM RSDM
RDM =
To quantify N content, 0.2 g/plant samples were removed from the dry shoot mass and subsequently digested, distilled and titrated using the method described by Bremner (1996).
The nutritional efficiency indices were obtained as described by Moll et al. (1982) (expressed in mg mg–1):
N (plant) NAE=
N (applied)
SDM NUtE=
N (plant)
SDM
NUE= =NUtE ×NAE
N (applied)
where NAE: nitrogen absorption (uptake) efficiency; NUtE: nitrogen utilization efficiency; NUE: nitrogen use efficiency; N (plant): total nitrogen content in the plant; and N (applied): amount of nitrogen supplied to the plant.
The data were subjected to analysis of variance according to the following model: Y =ijk µ α+ i+βj+(αβ)ij+εijk,
where Yijk is the observed value for the character at the
genotype with the j-th nutrient dose, which was considered a random effect, where ga ~ NID 0, ²
(
σ ga)
; and eijk is the effect of random error associated with the observation of orderijk, where ε~ NID 0, ²(
σ)
.Estimates of phenotypic correlations (rp) among the evaluated characters and NUE were obtained using the
Pearson coefficient:
(
)(
)
(
)
(
)
n
i i i 1
p
n 2 n 2
i i
i 1 i 1
x x y y r
x x . y y
=
= =
− −
=
− −
∑
∑
∑
, where,
x1, x2 ,..., xn and y1, y2 ,..., yn are the observed values for the measured characters. The rp estimates were tested at both 1 and 5% significance levels using t tests.
The relative importance of the studied characters was estimated using the method of principal components (Singh, 1981). Those characters that contributed least to genetic divergence among the genotypes were discarded. Therefore, to construct the selection index, the characters with the highest weighted values in the smallest eigen values component were ignored.
Factor analysis was then performed using the following model: Xj= l Fj1 1+l Fj2 2+.... l F+ jk k+εj, where Xj is the
variable estimated at each plot withj = 1, 2,... v; jkis the factorial load for the j-th variable associated with the k-th factor, wherek = 1, 2,... m; Fk is the k-th common factor;
and ej is the specific factor associated with the j-th variable.
The initial factorial load is defined by 2 2 jk ij ij
l =λV , where lij is the i-th eigenvalue greater than 1 obtained from the
phenotypic correlation matrix; and Vij is the j-th value of
the i-th vector, where j is the number of variables and k
is the number of factors. The commonality is represented
by 2 2 2
j j1 j2 jm
C = l + l +... l+ . The number of final factors considered for the grouping of characters was defined by the number of eigen values equal to or greater than 1.00. Characters with final factorial loads greater than 0.70 (after rotation) – indicating that these characters were highly correlated – were grouped together. The extraction of factorial loads was performed using the principal components method, and the factors were established using the varimax rotation method (Cruz and Carneiro, 2006).
The scores used to develop the indices were obtained using the following system of equations:
k 1k 1 2k 2 jk j
F =b X +b X +... b X+ , where bjk (k = 1,2, ...m,
j = 1, 2...v) is the matrix element b, defined by
(
)
1'
β= ΛΛ − Λ, and where L is the matrix of the m × v dimensions of the final rotated factorial loads, and b is the matrix of the m × v dimensions of the weighted coefficients of the characters. Analysis of the relative importance of the studied characters – estimated using the method of principal components, factor analysis and by developing selection indices – were performed as described by Dovale et al. (2011). All analyses were performed using the genetics and statistics software program GENES (Cruz, 2013).
3. RESULTS AND DISCUSSION
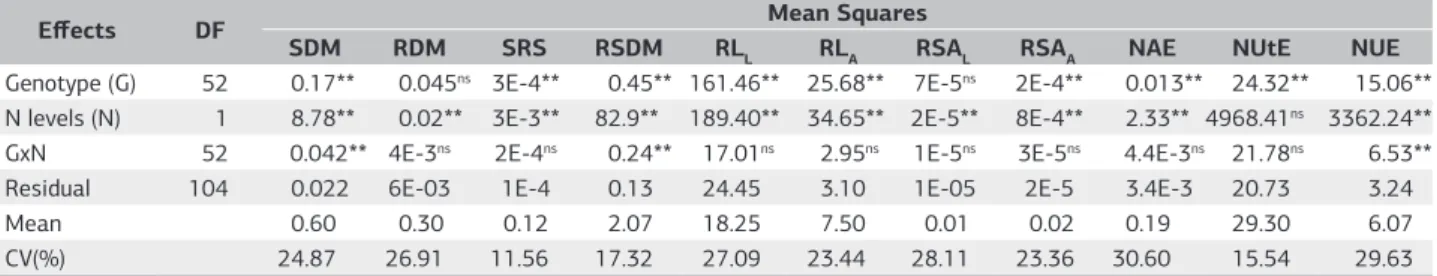
Based on the combined analysis of variance, the levels of N were sufficiently different for all characters, with the exception of for NUtE (Table 1). However, only for the characters SDM, shoot/root dry mass ratio and NUE did the genotypes show differential behavior as a function of N availability (G × N). Similar results were observed in maize by Chun et al. (2005), Liu et al. (2009) and Souza et al. (2009). Considering the presence of G × N interactions, evaluation and selection should be performed for specific environments and not be based on the mean performance of genotypes, as these genes appear to be differentially expressed based on nutrient availability (Fritsche-Neto et al., 2010). For the characters that did not show G × N interactions, it was not necessary to evaluate their expression under high and low N availability conditions, as the lack of a significant interaction is indicative of similar response patterns among the genotypes; in other words, these genotypes could be evaluated at a single level and the resulting decisions should apply to all other levels. The experimental coefficients of variation showed values within the acceptable range for this type of study (Fritsche-Neto et al., 2010; Majerowicz et al., 2002; Oliveira et al., 2013), indicating good experimental precision and reliability estimates.
Table 1. Summary of analyses of variance for the following characters: shoot dry mass (SDM), root dry mass (RDM), specific root surface (SRS), root/shoot dry mass ratio (RSDM), lateral root length (RLL), axial root length (RLA), lateral root surface area (RSAL), axial root surface area (RSAA), N absorption efficiency (NAE), N utilization efficiency (NUtE) and N use efficiency (NUE) in 14 lines and 39 hybrid maize combinations, evaluated under two levels of N availability (Viçosa (MG), Brasil 2010)
Effects DF Mean Squares
SDM RDM SRS RSDM RLL RLA RSAL RSAA NAE NUtE NUE
Genotype (G) 52 0.17** 0.045ns 3E-4** 0.45** 161.46** 25.68** 7E-5ns 2E-4** 0.013** 24.32** 15.06**
N levels (N) 1 8.78** 0.02** 3E-3** 82.9** 189.40** 34.65** 2E-5** 8E-4** 2.33** 4968.41ns 3362.24**
GxN 52 0.042** 4E-3ns 2E-4ns 0.24** 17.01ns 2.95ns 1E-5ns 3E-5ns 4.4E-3ns 21.78ns 6.53**
Residual 104 0.022 6E-03 1E-4 0.13 24.45 3.10 1E-05 2E-5 3.4E-3 20.73 3.24
Mean 0.60 0.30 0.12 2.07 18.25 7.50 0.01 0.02 0.19 29.30 6.07
CV(%) 24.87 26.91 11.56 17.32 27.09 23.44 28.11 23.36 30.60 15.54 29.63
For the individual N analysis, significant differences among the genotypes were detected for most of the studied characters under high and low N availability (Table 2). The exceptions were NUtE under both levels and SRS under low availability. Based on these results, these characters were not considered in the subsequent analyses. The observed significant genetic differences indicated the existence of genetic variability, allowing for selection and genetic gains at each N level. The means and heritability of the characters were lower under low N availability, likely because stressful conditions limit growth (Taiz and Zeiger, 2009) and reduce the expression of genetic variability, thus hampering selection (Coque and Gallais, 2006). The exceptions were NAE and NUE, which showed greater genetic variability under low N availability. This result indicates that the stress caused by low N conditions enables these genotypes to express variability for these characters, allowing for the selection of the most efficient genotypes. However, the heritability of these characters was lower under conditions of low N availability, suggesting that the other components also increased in greater magnitude compared with the genetic variance.
The correlations among the evaluated characters and NUE (Table 3) generally showed significant estimates with high magnitudes independent of N availability. However, the two components of NUE showed different patterns. NUtE showed non-significant and significant interactions of low magnitude in environments with high and low N availability, respectively. Unlike NUtE, NAE showed high and significant estimates under both environments. Presterl et al. (2002) observed that these two components are partially independent and that both contribute to the genetic variation in NUE. However, Bertin and Gallais (2000) reported that the genetic variability in NUE under
conditions of low N is primarily due to differences in NUtE. In contrast, Dovale et al. (2012) and LeGouis et al. (2000) concluded that the most important component for NUE under low N availability is NAE.
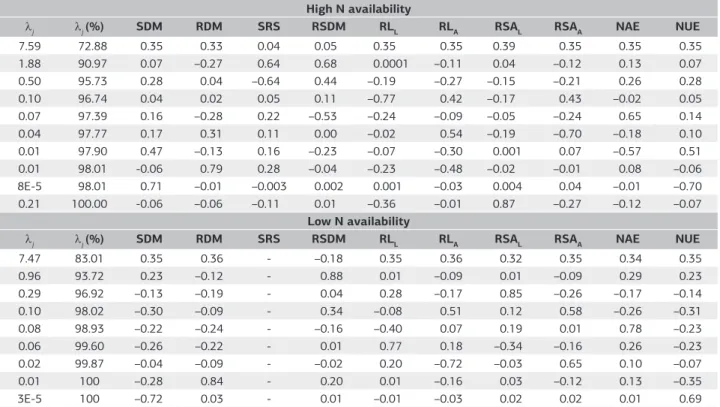
For the principal component analysis, the percentage of cumulative variance for the first two components was 90.97% (Table 4), which was considered sufficient to accurately interpret the data (Benin et al., 2009; Nascimento et al., 2009). Therefore, based on the analysis of the final eight eigenvectors – or in other words, all of the eigenvectors for which the correlation matrix was less than 0.7 – RLL and RDM were identified in the high and low N conditions, respectively, as characters that should be discarded. In particular, RLL was subject to discarding due to low variance, and as noted by Dovale et al. (2012), there was a hierarchical dependence relationship with RLA, indicating that as the length of the axial matrices increased, the number of lateral roots with greater area for N uptake also increased. RDM was subject to discarding due to low variance and a high positive correlation with plant dry matter (Majerowicz et al., 2002).
Using factor analysis, we sought to identify factors related to the characters that contribute to NUE under conditions of high and low N availability. Therefore, the first two eigen values that grouped the characters under both conditions of N availability were used, as these accounted for more than 80% of the total variation (Table 4). The commonalities, which represented the proportion of the variance of the standardized characters, had values greater than 0.7 (Table 5). Commonalities greater than 0.64 are generally considered to be reasonable, as they are equivalent to a correlation of ~0.80 between the standardized variable (Xj) and the common portion explaining the variable (Zj) (Garbuglio et al., 2007).
Table 2. Summary of analyses of variance for the following characters: shoot dry mass (SDM), root dry mass (RDM), specific root surface (SRS), root/shoot dry mass ratio (RSDM), lateral root length (RLL), axial root length (RLA), lateral root surface area (RSAL), axial root surface area (RSAA), N absorption efficiency (NAE), N utilization efficiency (NUtE) and N use efficiency (NUE) in 14 lines and 39 hybrid maize combinations, evaluated under two levels of N availability (Viçosa (MG), Brasil 2010)
High N availability
FV DF SDM Mean Square
RDM SRS RSDM RLL RLA RSAL RSAA NAE NUtE NUE
Genotype 52 0.18** 0.027** 4E-4* 0.59** 106.98** 16.35** 4E-5** 1E-4** 2E-3** 7.03ns 1.19**
Residual 52 0.04 0.007 2E-4 0.20 27.86 2.99 1E-5 3E-4 5E-4 6.49 0.23
Mean 0.81 0.3 0.12 2.71 19.21 7.91 0.012 0.025 0.08 24.42 2.05
CV(%) 23.23 27.56 12.11 16.47 27.48 21.85 28.36 22.26 26.20 10.43 23.24
h2 0.81 0.73 0.45 0.66 0.74 0.82 0.74 0.82 0.77 0.08 0.81
Low N availability
FV GL SDM Mean Square
RDM SRS RSDM RLL RLA RSAL RSAA NAE NUtE NUE
Genotype 52 0.03** 0.023** 2E-4ns 0.1* 71.5** 12.27** 3E-5** 1E-4** 0.02** 39.07ns 20.41**
Residual 52 0.01 5E-3 2E-4 0.06 21.03 3.20 9E-6 2E-5 6E-3 34.98 6.25
Mean 0.40 0.28 0.11 1.44 1.73 7.10 0.011 0.021 0.30 34.19 10.09
CV(%) 24.77 26.12 10.87 16.87 26.52 25.20 27.81 24.63 26.80 17.30 24.77
h2 0.69 0.76 0.21 0.41 0.71 0.74 0.68 0.77 0.59 0.10 0.69
Table 3. Phenotypic Pearson’s correlation coefficients (rp) among the evaluated characters and N use efficiency (NUE) in tropical maize lines and their respective hybrid combinations, under conditions of high and low N availability (Viçosa (MG), 2010)
NUE
High Low
SDM 1.00** 1.00**
RDM 0.84** 0.90**
SRS 0.05ns –0.34**
RSDM 0.24* –0.13ns
RLL 0.88** 0.88**
RLA 0.85** 0.85**
RSAL 0.88** 0.86**
RSAA 0.88** 0.87**
NAE 0.97** 0.93**
NUtE 0.04ns 0.26**
ns not significant; ** and * significant at 1 and 5% probability by t test, respectively.
Table 4. Estimates of the eigenvalues and cumulative fractions of variance explained by principal components obtained from the correlation matrix among characters associated with N use efficiency (NUE) for the tropical maize genotypes under condition of high and low N availability (Viçosa (MG), Brasil 2010)
High N availability
lj lj (%) SDM RDM SRS RSDM RLL RLA RSAL RSAA NAE NUE
7.59 72.88 0.35 0.33 0.04 0.05 0.35 0.35 0.39 0.35 0.35 0.35
1.88 90.97 0.07 –0.27 0.64 0.68 0.0001 –0.11 0.04 –0.12 0.13 0.07
0.50 95.73 0.28 0.04 –0.64 0.44 –0.19 –0.27 –0.15 –0.21 0.26 0.28
0.10 96.74 0.04 0.02 0.05 0.11 –0.77 0.42 –0.17 0.43 –0.02 0.05
0.07 97.39 0.16 –0.28 0.22 –0.53 –0.24 –0.09 –0.05 –0.24 0.65 0.14
0.04 97.77 0.17 0.31 0.11 0.00 –0.02 0.54 –0.19 –0.70 –0.18 0.10
0.01 97.90 0.47 –0.13 0.16 –0.23 –0.07 –0.30 0.001 0.07 –0.57 0.51
0.01 98.01 -0.06 0.79 0.28 –0.04 –0.23 –0.48 –0.02 –0.01 0.08 –0.06
8E-5 98.01 0.71 –0.01 –0.003 0.002 0.001 –0.03 0.004 0.04 –0.01 –0.70
0.21 100.00 -0.06 –0.06 –0.11 0.01 –0.36 –0.01 0.87 –0.27 –0.12 –0.07
Low N availability
lj lj (%) SDM RDM SRS RSDM RLL RLA RSAL RSAA NAE NUE
7.47 83.01 0.35 0.36 - –0.18 0.35 0.36 0.32 0.35 0.34 0.35
0.96 93.72 0.23 –0.12 - 0.88 0.01 –0.09 0.01 –0.09 0.29 0.23
0.29 96.92 –0.13 –0.19 - 0.04 0.28 –0.17 0.85 –0.26 –0.17 –0.14
0.10 98.02 –0.30 –0.09 - 0.34 –0.08 0.51 0.12 0.58 –0.26 –0.31
0.08 98.93 –0.22 –0.24 - –0.16 –0.40 0.07 0.19 0.01 0.78 –0.23
0.06 99.60 –0.26 –0.22 - 0.01 0.77 0.18 –0.34 –0.16 0.26 –0.23
0.02 99.87 –0.04 –0.09 - –0.02 0.20 –0.72 –0.03 0.65 0.10 –0.07
0.01 100 –0.28 0.84 - 0.20 0.01 –0.16 0.03 –0.12 0.13 –0.35
3E-5 100 –0.72 0.03 - 0.01 –0.01 –0.03 0.02 0.02 0.01 0.69
Based on the signs and magnitudes of the final factorial loads, we identified three groups of characters for high and low N availability (Table 5). For each group, the correlations between the characters were medium to high in magnitude; therefore, it was possible to discard those characters that were relatively difficult to measure and/or were redundant within each group, such as RDM in group 1, SRS and RLL in group 2, and RSAA and NAE in group 3 for the condition of high N availability. For the condition of low N availability, the characters RSAL and RLL in group 5 and NAE and NUE in group 6 were discarded.
The selection indices proposed in the present study were constructed by discarding characters with difficult measurements and those that were least discriminatory for genotype. To select the best genotypes for each condition, the weighted coefficients of the characters were calculated from the scores obtained for each factor, as suggested by Cruz et al. (2012) and Dovale et al. (2011). For both high and low N availability, Factor 1 yielded the most useful indices, as it assigned higher weights to characters with greater importance for NUE, in addition to discriminating between the genotypes. For high N availability, the index was IHN = 0.022 SDM + 0.35 RSDM + 0.35 RLA + 0.35 NUE. For low N availability, the index was ILN = -0.06 RSDM + 0.35 RSAA + 0.35 RLA + 0.39 SDM.
4. CONCLUSION
Indirect and early selection of tropical maize genotypes can be performed using the indices IHN = 0.022 SDM + 0.35 RSDM + 0.35 RLA + 0.35 NUE for high N availability
environments and ILN = -0.06 RSDM + 0.35 RSAA + 0.35 RLA + 0.39 SDM for low N availability environments.
ACKNOWLEDGEMENTS
This study was supported by CAPES, FAPEMIG and CNPq.
REFERENCES
BENIN, G.; SILVA, G.O.D.; PAGLIOSA, E.S.; LEMES, C.; SIGNORINI, A.; BECHE, E.; CAPELIN, M.A. Capacidade de combinação em genótipos de trigo estimada por meio de análise multivariada. Pesquisa Agropecuária Brasileira, v.44, p.1145-1151, 2009. http://dx.doi.org/10.1590/S0100-204X2009000900012
BERTIN, P.; GALLAIS, A. Genetic variation for nitrogen use efficiency in a set of recombinant maize inbred lines I. Agrophysiological results. Maydica, v.45, p.53-66, 2000.
BOUMA, T.J.; NIELSON, K.L.; KOUTSTAAL, B.A.S. Sample preparation and scanning protocol for computerized analysis of root length and diameter. Plant and Soil, v.218, p.185-196, 2000. http:// dx.doi.org/10.1023/A:1014905104017
BREMNER, J.M. Nitrogen - total. In: SPARKS, D.L. (Ed.). Methods of soil analysis. Part 3 – Chemical Methods. Madison: Soil Science Society of America, 1996. p.1085-1121.
CHUN, L.; MI, G.; LI, J.; CHEN, F.; ZHANG, F. Genetic analysis of maize root characteristics in response to low nitrogen stress. Plant and Soil, v.276, p.369-382, 2005. http://dx.doi.org/10.1007/ s11104-005-5876-2
COQUE, M.; GALLAIS, A. Genomic regions involved in response to grain yield selection at high and low nitrogen fertilization in maize. Theoretical and Applied Genetics, v.112, p.1205-1220, 2006. PMid:16552555. http://dx.doi.org/10.1007/s00122-006-0222-5
CRUZ, C.D. GENES - a software package for analysis in experimental statistics and quantitative genetics. Acta Scientiarum, v.35, p.271-276, 2013.
CRUZ, C.D.; REGAZZI, A.J.; CARNEIRO, P.C.S. Modelos biométricos aplicados ao melhoramento genético - volume 1. Viçosa: UFV, 2012. 514p.
CRUZ, C.D.; CARNEIRO, P.C.S. Modelos biométricos aplicados ao melhoramento genético – volume 2. Viçosa-MG: UFV, 2006. 585p.
DEUNER, S.; NASCIMENTO, R.; FERREIRA, L.S.; BADINELLI, P.G.; KERBE, R.S. Adubação foliar e via solo de nitrogênio em plantas de milho em fase inicial de desenvolvimento. Revista Ciência e Agrotecnologia, v.5, p.1359-1365, 2008. http://dx.doi.org/10.1590/ S1413-70542008000500001
DOVALE, J.C., FRITSCHE-NETO, R.; SILVA, P.S.L. Índice de seleção para cultivares de milho com dupla aptidão: minimilho e milho verde. Bragantia, v.70, p.781-787, 2011.
DOVALE, J.C.; FRITSCHE-NETO, R.; BERMUDEZ, F.; MIRANDA, G.V. Efeitos gênicos de caracteres associados à eficiência no uso de
Table 5. Communality, groups formed and initial and final factorial loads estimated for the evaluated tropical maize genotypes for N use efficiency (NUE) under two conditions of N availability (Viçosa (MG), Brasil 2010)
Evaluated characters Groups Communality
Initial Loads Final Loads
Factors Factors
1 2 1 2
High N availability
Shoot dry mass (SDM)
1 0.89 0.14 0.93 0.06 0.94
Root dry mass (RDM) 0.79 0.09 0.88 0.02 0.89
Specific root surface (SRS)
2
0.94 0.95 0.19 0.93 0.27
Root/shoot dry mass ratio (RSDM) 0.96 0.98 0.11 0.96 0.19
Lateral root length (RLL) 0.97 0.98 0.11 0.96 0.19
Axial root length (RLA) 0.92 0.96 0.01 0.95 0.09
Axial root surface area (RSAA)
3
0.93 0.95 -0.14 0.96 -0.07
Nitrogen absorption efficiency (NAE) 0.93 0.95 -0.15 0.96 -0.08 Nitrogen use efficiency (NUE) 0.98 0.93 -0.36 0.95 -0.28
Low N availability
Root/shoot dry mass ratio (RSDM) 4 0.98 –0.46 0.88 –0.16 0.98
Lateral root surface area (RSAL)
5
0.79 0.89 –0.02 0.84 –0.31
Axial root surface area (RSAA) 0.93 0.96 –0.11 0.87 –0.41
Axial root length (RLA) 0.95 0.97 –0.11 0.88 –0.41
Lateral root length (RLL) 0.93 0.96 –0.02 0.91 –0.33
Nitrogen absorption efficiency (NAE)
6
0.93 0.93 0.26 0.96 –0.05
Nitrogen use efficiency (NUE) 0.97 0.96 0.21 0.98 –0.11
nitrogênio em milho. Pesquisa Agropecuária Brasileira, v.47, p.385-392, 2012.
FERREIRA, A.; CECON, P.R.; CRUZ, C.D.; FERRÃO, R.G.; SILVA, M.F.D.; FONSECA, A.F.A.D.; FERRÃO, M.A.G. Seleção simultânea de Coffea canephora por meio da combinação de análise de fatores e índices de seleção. Pesquisa Agropecuária Brasileira, v.40, p.1189-1195, 2005. http://dx.doi.org/10.1590/S0100-204X2005001200005
FRITSCHE-NETO, R.; DOVALE, J.C.; LANES, É.C.M.D.; RESENDE, M.D.V.D.; MIRANDA, G.V. Genome-wide selection for tropical maize root traits under conditions of nitrogen and phosphorus stress. Acta Scientiarum Agronomy, v.34, p.389-395, 2012. http:// dx.doi.org/10.4025/actasciagron.v34i4.15884
FRITSCHE-NETO, R.; MIRANDA, G.V.; DELIMA, R.O.; SOUZA, L.V.; SILVA, J. Herança de caracteres associados à eficiência de utilização do fósforo em milho. Pesquisa Agropecuária Brasileira, v.45, p.465-471, 2010. http://dx.doi.org/10.1590/S0100-204X2010000500005
GALLAIS, A.; HIREL, B. An approach to the genetics of nitrogen of use efficiency in maize. Journal of Experimental Botany, v.396, p.295-306, 2004. PMid:14739258. http://dx.doi.org/10.1093/jxb/erh006
GARBUGLIO, D.D.; GERAGE, A.C.; ARAÚJO, P.M.; FONSECA JUNIOR, N.S.; SHIOGA, P.S. Análise de fatores e regressão bissegmentada em estudos de estratificação ambiental e adaptabilidade em milho. Pesquisa Agropecuária Brasileira, v.42, p.183-191, 2007. http://dx.doi.org/10.1590/S0100-204X2007000200006
LIU, J.; CHEN, F.; OLOKHNUUD, C.; GLASS, A.D.M.; TONG, Y.; ZHANG, F.; MI, G. Root size and nitrogen-uptake activity in two maize (Zea mays) inbred lines differing in nitrogen-use efficiency. Journal of Plant Nutrition and Soil Science, v.172, p.230-236, 2009. http://dx.doi.org/10.1002/jpln.200800028
MAJEROWICZ, N.; PEREIRA, J.M.S.; MEDICI, L.O.; BISON, O.; PEREIRA, M.B.; SANTOS, U.M.J. Estudo da eficiência de uso do nitrogênio em variedades locais e melhoradas de milho. Revista Brasileira Botânica, v.25, p.129-136, 2002.
MOLL, R.H.; KAMPRATH, E.L.; JACKSON, A. Analysis and interpretation of factors which contribute to efficiency of nitrogen utilization. Agronomy Journal, v.74, p.562-564, 1982. http://dx.doi. org/10.2134/agronj1982.00021962007400030037x
NASCIMENTO, M.; CRUZ, C.D.; CAMPANA, A.C.M.; TOMAZ, R.S.; SALGADO, C.C.; FERREIRA, R.P. Alteração no método centroide de avaliação da adaptabilidade genotípica. Pesquisa Agropecuária Brasileira, v.44, p.263-269, 2009. http://dx.doi. org/10.1590/S0100-204X2009000300007
OLIVEIRA, L.R.; MIRANDA, G.V.; DELIMA, R.O.; FRITSCHE-NETO, R.; GALVÃO, J.C.C. Eficiência na absorção e utilização de nitrogênio e atividade enzimática em genótipos de milho. Revista Ciência Agronômica, v.44, p.614-621, 2013. http://dx.doi.org/10.1590/ S1806-66902013000300025
PRESTERL, T.; GROH, S.; LANDBECK, M.; SEITZ, G.; SCHMIDT, W.; GEIGER, H.H. Nitrogen uptake and utilization efficiency of European maize hybrids developed under conditions of low and high nitrogen input. Plant Breeding, v.121, p.480-486, 2002. http:// dx.doi.org/10.1046/j.1439-0523.2002.00770.x
SINGH, D.The relative importance of characters affecting genetic divergence. Indian Journal of Genetics and Plant Breeding, v.41, p.237-245, 1981.
SOUZA, L.V.; MIRANDA, G.V.; GALVÃO, J.C.C.; GUIMARÃES, L.J.M.; SANTOS, I.C. Combining ability of maize grain yield under different levels of environmental stress. Pesquisa Agropecuária Brasileira, v.44, p.1297-1303, 2009. http://dx.doi.org/10.1590/ S0100-204X2009001000013
TAIZ, L.; ZEIGER, E. Fisiologia Vegetal. Porto Alegre: Artmed, 2009. 848p.
TRACHSEL, S.; MESSMER, R.; STAMP, P.; HUND, A. Mapping of QTLs for lateral and axile root growth of tropical maize. Theoretical and Applied Genetics, v.119, p.1413-1424, 2009. PMid:19760216. http://dx.doi.org/10.1007/s00122-009-1144-9