ISSN 1546-9239
© 2007 Science Publications
Corresponding Author: Angela MICHNEA, North University of Baia Mare, Romania 76 Victoriei Street, code 430122
592
Adsorption Kinetic of 8-Hydroxyquinoline on Malachite
Gabriela OPREA, Angela MICHNEA and Cristina MIHALI North University of Baia Mare, Romania
76 Victoriei Street, code 430122
Abstract: Influence of temperature and collector concentration on its adsorption rate on mineral surface was studied as regarding to the 8-hydroxyquinoline/malachite system. Theoretical equations as well as experimental data may be useful to estimate the adsorption rate and kinetics connected to the conditioning stage in mineral flotation in order to optimise the selectivity and the recovery of the desired mineral.
Key words: Flotation, adsorption density, reaction rate constants, isotherms, oxine, equilibrium
INTRODUCTION
Reagents with chelating action are used in the analytical chemistry due to their selectivity for certain metallic ions in solution[1]. The functional groups of the reagent are forming stable chelated compounds with the specific metallic ions. These reagents are used for ores containing oxide minerals when neither good recovery with classic collectors, nor selective separation of tailings minerals is achieved[2,3].
Among these reagents, 8-hydroxyquinoline (oxine) which is successfully used in the analytical chemistry forms stable chelating complexes with many metal cations. It has been reported in mineral processing, that oxinates act as collectors through chemisorption on mineral particle surfaces during the flotation process[4,5,6]. Based on the fact that malachite contains the Cu(II) ion and 8-hydroxyquinoline forms in solution stable chelating compounds with this ion, it is possible to recover copper from malachite by flotation with this chelating agents acting as collector[7,8].
The theoretical approaches of phenomena occurring during the flotation process are studied in many papers. The occurrence of chemical bonds between the chemisorped species and the mineral surface is proved by the similitude of IR spectra of bulk Cu oxinate and of the superficial compound resulted when malachite surface was treated with oxine solution[9]. It is well recognized already that the adsorption reaction of the collector on the mineral surface is the most important factor affecting the floatability of valuable minerals.
In this paper theoretical estimations and experimental tests were performed in order to study the
kinetic of the adsorption of 8-hydroxyquinoline on malachite.
MATERIALS AND METHODS
Solutions of 8-hydroxyquinoline in 10% acetic acid with concentration between 4·10-5 mol L-1 and 50·10–5 mol L-1 were used in the experiments. Pure malachite, selected from Altan Tepe ore, Romania, was dry crushed by hand and sieved to get the particle size fraction of 40 – 80 µm.
In order to study the adsorption kinetic, 1 g of mineral was suspended in 100 mL solution in closed bottles and pH 8 was maintained by adding alkaline solution. The suspension was continuously gently shaked using the IKA HS 260 basic shaker.
Measurements of the oxine concentration at different time periods were performed by UV-VIS molecular absorption spectrometry at 319 nm wavelengths. Before starting the experiments, the adsorption spectra of the 8-hydroxyquinoline in 10% acetic acid solution were scanned from 200 to 400 nm in order to detect the wavelength of the adsorption peak. We used an UV-VIS CECIL 8000 spectrometer with 1 cm deep quartz cells.
The influence of the initial concentration of the reagent on the adsorption kinetic at constant temperature of 250C was studied. The following initial concentrations of oxine were used: 4·10-5 mol L-1, 30·10–5 mol L-1 and 50·10–5 mol L-1. During each test, solution sampling was performed each 0,5 minute within the first 9 minutes, then each 2 or 3 minutes, until the residual concentration of oxine in solution remains constant (within maximum 26 minutes).
from 25oC, to 35oC and thereafter to 45oC, other series of experiments were carried out. The residual oxine concentration was determined in each case at the same time periods, till the concentration remains constant.
RESULTS AND DISCUSSIONS
Influence of the initial oxine concentration on the adsorption kinetic of oxine on malachite: The experimental data obtained for all the initial oxine concentrations (4·10-5 mol L-1, 30·10–5 mol L-1 and 50·10–5 mol L-1) are presented in Table 1.
The adsorption density (D) of 8-hydroxyquinoline on the 40-80 µm size fraction of malachite was calculated based on the relation (1):
m
1000
V
)
c
c
(
D
0 t⋅
−
=
(1)where:
V = the volume of the oxine solution (100 mL) m = mass of the malachite used in the experiment (1 g)
c0 = the initial oxine concentration, mol L-1 ct = the oxine concentration after t minutes of adsorption, mol L-1, when equilibrium is supposed to be reached,
The available collector in solution until reaching the equilibrium (expressed as ct–crez,
∞
*, where crez,∞
is the oxine concentration when adsorption equilibrium was reached and the residual concentration become constant), was also calculated.The oxine adsorption isotherms on malachite were illustrated in Fig.1, for all the studied initial oxine concentrations at 250C.
It may be noticed that the equilibrium is rapidly reached at law initial concentration. Thus, for the initial 4·10-5 mol L-1 concentration, the equilibrium adsorption density of 0.36·10-5 mol g-1 was reached in 8 minutes; for the initial 30·10–5 mol L-1 concentration, the equilibrium adsorption density of 2.4 10-5mol g-1 was reached in 10 minutes and respectively, for the initial 50·10 –5 mol L-1 concentration, the equilibrium adsorption density of 4.76·10-5 mol g-1 was reached in 12 minutes.
The shape of the adsorption density curve as a function of time is similar for all the initial concentrations; it increases logarithmically in time and tends to the equilibrium value.
It is possible to apply the first order kinetic equation for the adsorption reaction[8,10]:
) c c ( k dt dc
, rez t− ∞
=
− (2)
t tan cons t k ) c c
ln( t− rez,∞ =− ⋅ + (3)
The variation of the oxine concentration (ct) as a function of time depends on the initial concentration (c0); crez,
∞
remains constant after 8, 10 and 12 minutes, depending on the c0 value.In order to find the reaction rate constant k, we used the
equation (3) and we plotted
ln(
c
t−
c
rez,∞)
as a function oftime for each of the studied initial oxine concentration (Fig. 2). The reaction rate constants were calculated from the straight lines slopes by statistic program. Table 2 presents the reaction rate constants and the correlation coefficients (R2) resulted from the statistic data analysis of the experimental values.
Values for k1 were calculated related to all the points plotted in Fig. 2 for each initial concentration, respectively for the time period from 0 to 7.5 minutes for the initial 4x10⁻⁵ mol L-1 concentration; 0 to 9 minutes for the initial 30x10-5 mol L-1 concentration; and 0 to 10 minutes for the initial 50x10-5 mol L-1 concentration.
When calculating k2, the first three points in each curve
were rejected; in this case
ln(
c
t−
c
rez,∞)
is constant; thusonly data obtained 1 minute after the test started were used. Correlation coefficients are better for k2 and Fig. 2 demonstrates good linear relationships with negative slope for each group of points. The adsorption rate increases by increasing the initial concentration from 4x10⁻⁵ mol L-1 to 30x10-5 mol L-1 and decreases by the furthermore increasing the initial concentration to 50x10-5 mol L-1.
The constant increasing increment with 7% for k2 related to k1 for each of the initial concentration highlights that de adsorption mechanism does not depend on the initial concentration.
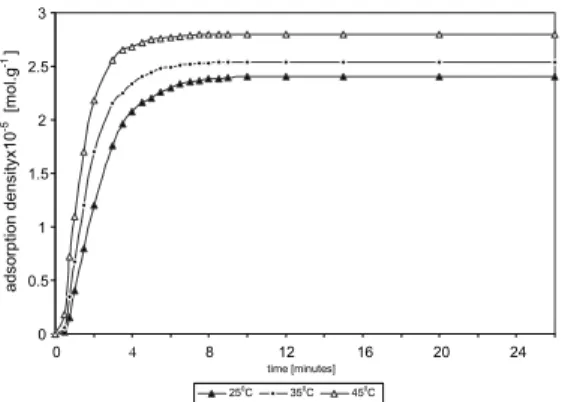
Temperature influence on the adsorption kinetic of oxine on malachite: Other tests were carried out at different temperatures as 250C, 350C and 450C with solutions of oxine having the same initial 30·10–5 mol.L-1 concentration; experimental data are presented in Table 3.
Adsorption densities (D) of 8-hydroxyquinoline on malachite of 40 – 80 µm in size were calculated with relation (1).
Figure 3 represents the influence of the temperature on the oxine adsorption on malachite. The increase of the adsorption density by increasing the temperature is obvious. Thus, equilibrium adsorption density increases from 2.4·10-5 mol g-1 (at 25oC) to 2.54·10-5 mol g-1 (at 35oC) and to 2.8·10-5 mol g-1 (at 45oC), for the studied oxine initial concentration. It may be noticed that the effect of the temperature on the adsorption kinetic of oxine on malachite is not so significant.
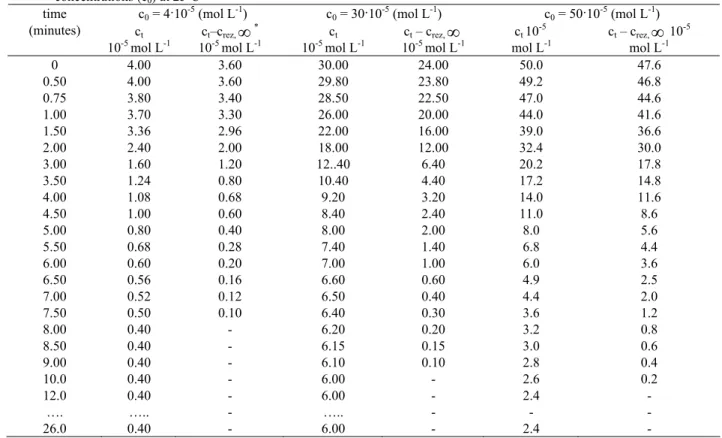
Table 1: Variation of oxine concentration (ct ) as a function of time during the adsorption on malachite at different initial oxine concentrations (c0) at 250C
c0 = 4·10-5 (mol L-1) c0 = 30·10-5 (mol L-1) c0 = 50·10-5 (mol L-1) time
(minutes) ct 10-5 mol L-1
ct–crez,
∞
* 10-5 mol L-1ct 10-5 mol L-1
ct – crez,
∞
10-5 mol L-1ct 10-5 mol L-1
ct – crez,
∞
10-5 mol L-10 4.00 3.60 30.00 24.00 50.0 47.6
0.50 4.00 3.60 29.80 23.80 49.2 46.8
0.75 3.80 3.40 28.50 22.50 47.0 44.6
1.00 3.70 3.30 26.00 20.00 44.0 41.6
1.50 3.36 2.96 22.00 16.00 39.0 36.6
2.00 2.40 2.00 18.00 12.00 32.4 30.0
3.00 1.60 1.20 12..40 6.40 20.2 17.8
3.50 1.24 0.80 10.40 4.40 17.2 14.8
4.00 1.08 0.68 9.20 3.20 14.0 11.6
4.50 1.00 0.60 8.40 2.40 11.0 8.6
5.00 0.80 0.40 8.00 2.00 8.0 5.6
5.50 0.68 0.28 7.40 1.40 6.8 4.4
6.00 0.60 0.20 7.00 1.00 6.0 3.6
6.50 0.56 0.16 6.60 0.60 4.9 2.5
7.00 0.52 0.12 6.50 0.40 4.4 2.0
7.50 0.50 0.10 6.40 0.30 3.6 1.2
8.00 0.40 - 6.20 0.20 3.2 0.8
8.50 0.40 - 6.15 0.15 3.0 0.6
9.00 0.40 - 6.10 0.10 2.8 0.4
10.0 0.40 - 6.00 - 2.6 0.2
12.0 …. 26.0
0.40 ….. 0.40
- - -
6.00 ….. 6.00
- - -
2.4 - 2.4
- - -
*crez,
∞
– the oxine concentration when adsorption equilibrium was reached and the residual concentration become constantTable 2: Reaction rate constants and correlation coefficients (R2) for oxine adsorption on malachite at different initial concentrations (c0) and
250C
c0 (mol L-1) k1*(min-1) R2 k2** (min-1) R2
4·10 –5 0.5227 0.9878 0.5621 0.9962
30·10 –5 0.6356 0.9916 0.6685 0.9960
50·10 –5 0.5547 0.9789 0.5953 0.9855
* k1 was statistically calculated related to all the points plotted in Fig. 4, **k2 was calculated with data obtained 1 minute after the test started
10
-5
4x10⁻⁵
mol.L-1
30x10-5
mol.L-1
50x10-5
mol.L-1
-1 0 1 2 3 4 5
0 4 8 12 16 20 24
time [minutes]
4.10- 30.10-5mol.L- 50.10
-adsor
pt
ion densit
y
x
1
0
-5
Fig. 1: Variation of the adsorption density of oxine on malachite as a function of time at 250C for all the studied initial oxine
concentrations
-3 -2 -1 0 1 2 3 4 5
0 2 4 6 8 10
time [minutes]
4.10(-5) 30.10(-5) 50.10(-5)
ln (
ct
- c
rez
,?
)
4x10⁻⁵
mol.L-1
30x10-5
mol.L-1
50x10-5
mol.L-1
Fig. 2: First order reaction curves for the adsorption kinetic of oxine on malachite at different initial concentrations and
10
-5
0
C 0C 0C
0 0.5 1 1.5 2 2.5 3
0 4 8 12 16 20 24
time [minutes]
adso
rpt
ion
d
ensit
yx
10
-5
[m
o
l.
g
-1
]
250C 350C 450C
Fig. 3: Variation of oxine adsorption density on malachite as a function of time at different testing temperatures and the initial 30·10 –5 mol L-1 oxine concentration
-3 -2 -1 0 1 2 3 4
0 2 4 6 8 10
time (minutes)
ln
(c
-c
e
c
h
)
25 C 35C 45C
ln
(ct
– c
re
z
,?
)
250
C 350
C 450
Fig.4: Specific first order reaction curves for the adsorption kinetic of oxine on malachite at different testing temperatures and initial 30·10–5 mol L-1 oxine concentration
-0,5 -0,45 -0,4 -0,35 -0,3 -0,25 -0,2 -0,15
3,1 3,2 3,3 3,4
1/Tx10-3[1/K]
ln
k
k1 k2
Fig. 5: Representation of the Arrhenius’ equation in order to calculate the activating energy k1 – related to all the points
plotted in Fig. 4, k2 – related to data obtained 1 minute after the
test started
In order to find the reaction rate constant k, we used furthermore the equation (3) and we plotted
) c c
ln( t− rez,∞ as a function of time for the studied initial oxine concentration (Fig. 4). The reaction rate constants were calculated from the straight lines slopes with statistic program. Table 4 presents the rate constants and correlation coefficients (R2) from the statistic data analysis of the experimental values.
Values for k1 were statistically calculated related again to all the points plotted in fig. 4, respectively for the time period from 0 to 9 minutes for 25oC; 0 to 8 minutes 35oC; 0 to 7 minutes for 45oC. The increase of the reaction rate constant with 14.04% may be noticed for each increasing interval of the temperature (10oC).
As previously described, k2 was calculated only with data obtained 1 minute after the test started and an increase with 5.17% for 25oC, 2.48% for 35oC and 2.07% for 45oC occurs by reporting k2 to k1.
The activating energy for the oxine adsorption process on malachite was determined with the Arrhenius’ equation:
RT Ea
e
A
k
=
⋅
− (4)and in its logarithmic form:
RT E A ln k
ln = − a (5)
Based on the reaction rate constants k1 and k2 at all the studied temperatures (see Table 4) lnk was illustrated graphically as a function of 1/T (Fig. 5). The activating energy was calculated from the straight line slope with the statistic program. The activating energy for the oxine adsorption on malachite is Ea = 10.4807 kJ mol–1 for k1 and is decreasing to 9.2931 kJ mol–1 for k2.
The reactions occurring at the limit of the diffusion layer have smaller activating energies, which may also be explained by the fact that the energetic barriers that should be exceeded in case of diffusion in the bulk solution are generally small.
CONCLUSIONS
Kinetics and equilibrium adsorption experiments were conducted in order to evaluate the adsorption characteristics of a chelating agent, namely 8-hydroxyquinoline (oxine) on malachite. Results revealed some focal points regarding the oxine adsorption on malachite, as following:
the same for the different experimental concentrations;
• The effect of the temperature on the reaction rate is not very significant;
• The activating energy value for oxine adsorption on malachite suggests that the reactions should occur at the limit of the diffusion layer.
The experimental kinetic data could predict the malachite floatability; furthermore some connections shall be made between the parameters and performances during the conditioning stage in flotation and the adsorption kinetic in order to optimise the selectivity and the recovery of the desired mineral.
REFERENCES
1. Rigbom, A., 1967. The complex in analytical chemistry, Dumond, Paris.
2. Marabini, A.M., M.Barbaro, A.Falbo, C.Cozza and S.Qaresima, 1993. Interaction mechanism of a new chelating collector and copper sulphide minerals, Proceedings, XVIII Int. Miner. Process. Congr., vol.5, pp.1375-1383
3. Nagaraj, D. R. and P. Somasundaran, 1981. Chelating reagents as collectors in flotation: oxines-cooper minerals system. Min. Eng., 33: 1351-1357.
4. Bustamante, H. and H. L.Shergold, 1983. Surface Chemistry and Flotation of zinc oxide minerals: 2. Flotation with chelating reagents. Trans. Inst.Min. Metall., Sect. C., 92: 208-215.
5. Oprea, G. and C.Mihali, 2001. The copper, lead and zinc recovery of the minerals partial oxidated with chelating action reagents. Stud. Univ. Babeş Bolyai,Cluj Napoca (Romania) , Chemia, XLVI, 1-2: 175-181.
6. Kusaka, E., K. Maegawa, Y. Fukunaka, M. Ninae and Y. Nakahiro, 1999. Two – liquid flotation of fine oxide particles with 8- hydroxychinoline. The Canadian J. of Chem. Eng., 77: 62-68.
7. Oprea, G., C. Mihali, V. Danciu, M. Podariu, 2004. The study of 8-hydroxychinoline and salicylaldoxime action at the malachite flotation. J. Min.Met., 40 A, 1:49-63.
8. Cecile, J. L. 1978. Chelating reagents in flotation. PhD Thesis, Univ. of Orleans: 94-136.
9. Oprea, G. and E. Chifu, 1986. Infrared spectroscopic investigation of the adsorption products of 8-hydroxychinoline on malachite. Stud. Univ. Babeş Bolyai,Cluj Napoca (Romania) , Chemia, XXXI, 2: 65-68.