Original Article rbafs.org.br
This work is licensed under the Creative Commons Attribution-NonCommercial-ShareAlike 4.0 International License.
Level of physical activity and perceived barriers to
its practice in adults with visual impairment
Nível de atividade física e barreiras percebidas para sua prática em adultos com
deficiência visual
AUTHOR’S Gabriely Portela Matoso1
Bruno Sergio Portela1
1 Universidade Estadual do Centro-Oeste. Guarapuava, Paraná, Brazil.
CORRESPONDING Bruno Sergio Portela
Rua Alameda Élio Antonio Dalla Vecchia, 838, Vila Carli, Guarapuava, Paraná, Brazil. CEP: 85040-167.
DOI
10.12820/rbafs.24e0094
ABSTRACT
The objective of the study was to assess level of physical activity, perception of barriers to practice, and stages of behavior change in visually impaired individuals of an inland city in the State of Paraná. The participants were 40 individuals with visual impairment (37.5% blind and 62.5% with low vision) of both sexes (57.5% men) aged 21-69 years (mean age 39.52 years; ± 17.58 for men and 39.88 years; ± 14.96 for women). Participants were assessed in only one moment, through three questionnaires (perception of barriers to physical activity, International Questionnaire of Physical Activity (IPAQ) - short version, and stages of behavior change). According to the IPAQ results, a prevalence of 70% of physical inactivity was found. The main barriers mentioned by the interviewees were “lack of support from family and/or friends”, “physical limitations” and “bad mood”. In relation to the questionnaire of stages of behavior change, 50% of the subjects were in the preparation stage. The study concludes that the level of physical activity in the visually impaired is low and the main causes of this can be motivational, lack of physical fitness and psychological.
Keywords: Physical activity; Vision disorders; Behavior. RESUMO
O objetivo do estudo foi avaliar o nível de atividade física, a percepção de barreiras para a prática e os está-gios de mudança de comportamento em deficientes visuais de um município do interior do Paraná. Partici-param deste estudo 40 indivíduos com deficiência visual (37,5% cegos e 62,5% com baixa visão), de ambos os sexos (57, 5% homens) com idade entre 21 e 69 anos (média de 39,52 anos; ± 17,58 para os homens e 39,88; ± 14,96 para as mulheres). Os participantes foram avaliados em apenas um momento, por meio de três questionários (percepção de barreiras para atividade física, Questionário Internacional de Atividade Física (IPAQ) versão curta e estágios de mudança de comportamento). Conforme os resultados do IPAQ, mostra-se uma prevalência de 70% de inatividade física. As barreiras que mais se destacaram nos entrevistados foram “falta de incentivo da família e/ou amigos”, “limitações físicas” e “mau humor”. Em relação ao questionário de estágios de mudança de comportamento, 50% dos avaliados estão no estágio de preparação. O estudo conclui que o nível de atividade física em deficientes visuais é baixo e as principais causas podem ser motivacionais, falta de aptidão e psicológicas.
Palavras-chave: Atividade física; Transtornos da visão; Comportamento.
Introduction
The practice of physical activity results in countless benefits to health, both physical and mental1. Studies
have shown that these benefits reduce mortality rates, decrease the risk of developing coronary heart disease and diabetes, and lower body adiposity levels2. Low
le-vels of physical activity increase the risk of developing pathologies related to hypertension, obesity and cancer, negatively affecting the health of individuals1.
According to Malta et al., compared to other im-pairments, visual impairment presents a high preva-lence index in the Brazilian population: 3.6% or ap-proximately 7.2 million people with this incapacity in
20133. In addition, the south region of Brazil presents
a higher percentage when compared to the other Bra-zilian regions: 5.9%.
Physical activity levels are significantly low in vis-ually impaired individuals when compared to non-im-paired subjects, which can make them more susceptible to developing health problems related to an inactive life4. Due to the scarcity of studies assessing the
phys-ical activity level of visually impaired individuals, it is necessary to understand how they behave in relation to the intention of starting their practice or maintaining it. It has been found that the daily level of physical activity of children and adolescents with visual
impair-ment is lower than that of their non-impaired peers: while the visually impaired present an average of dai-ly periods of moderate to vigorous physical activity of 7.31 (± 2.26), this figure, to the non-impaired, amounts to 12.20 (± 4.24)5. Thus, it is important to assess the
behavior of the visually impaired in relation to phys-ical activity, aiming to understand if the impairment interferes in their decision-making process regarding the practice of physical activity.
Besides preventing the pathologies mentioned above, physical activity in the population of visually impaired individuals increases their quality of life and brings many physical benefits, such as improvement in physical fitness, coordination, balance, muscle strength, agility and speed, as well as psychological benefits, such as improvement in self-image and concept, self-confi-dence and motivation6. Among the different benefits
of physical activity for this population, we highlight health promotion, independence and autonomy7.
However, the blind person’s accessibility to physical activity is more limited when compared to the non-im-paired population due to several factors that can be con-sidered barriers. Some barriers to the practice of physical activity by visually impaired individuals have been por-trayed by previous studies, like architectural difficulties, unprepared Physical Education teachers, overprotective families, and lack of spatial ability and motor coordi-nation, as well as fear, dependence and motor delays as characteristics of people with visual impairment8.
Studies with different populations have been devel-oped with the aim of identifying the barriers that hinder the regular practice of physical activity9,10. However, few
studies in Brazil have analyzed this theme in the visually impaired population. Up to now, only the study carried out by Morgado et al.8 has analyzed qualitatively the barriers to
physical activity in Brazilian visually impaired individuals. The identification and classification of possible bar-riers to the practice of physical activity by the visual-ly impaired are necessary for the creation and devel-opment of individualized intervention programs and methods that efficiently increase the level of physical activity in this population. In view of this need, the objective of this study was to assess level of physical activity, perception of barriers to practice and stages of behavior change of visually impaired individuals.
Methods
The present research is a cross-sectional study. The
par-ticipants were 40 visually impaired adults attending APADEVI, the Association of Parents and Friends of the Visually Impaired of Guarapuava, State of Paraná. The association is a not-for-profit, non-governmental organization that assists people with complete visual impairment or low vision. It provides pedagogical ac-tivities and acac-tivities for the inclusion of the visually impaired in society. In this study, all the visually impai-red individuals enrolled in the institution were assessed; therefore, sample size calculation was not performed, as we believe the association assists almost the total num-ber of visually impaired individuals of the city (it mo-nitors and assists all the city’s visual impairment cases). The study was submitted to the appraisal of the Ethics Committee for Research Involving Human Beings of Universidade Estadual do Centro-Oeste (UNICENTRO) and was approved under the opinion no. 2.347.960. As the institution is related to a state school, the study was also evaluated and approved by the Department of Education of the State of Paraná (SEED). After the approval of the Ethics Committee, the subjects were requested to sign the consent docu-ment known as TCLE, authorizing their participation in the research. Due to the visual impairment, the re-searcher read the document to the subject.
The research team was composed of two Physical Education students and the supervising teacher. Data collection occurred within a period of 3 months, in which the researchers went to the institution twice a week to administer the questionnaires. The question-naires were administered through an interview with the visually impaired individual.
To assess the level of physical activity, the Inter-national Questionnaire of Physical Activity (IPAQ) - short version11 was used. It classifies the assessed
sub-jects as very active or active (individuals who comply with the recommendations of ≥150 minutes per week) and physically inactive (individuals who do not comply with the recommendations of frequency or duration of physical activity)12.
The questionnaire of perception of barriers was used to identify situations perceived by the visually impaired as obstacles to the practice of physical activity13. This
questionnaire contains a list with 19 barriers that hin-der the individual’s decision-making process regard-ing the regular practice of physical activity: extensive working hours, family commitments (parents, spouse, child, etc.), inadequate weather (wind, cold, heat, etc.), lack of an available space to the practice, lack of
equip-ment, domestic chores, lack of company, lack of support from family and/or friends, lack of financial resources, bad mood, fear of being injured, physical limitations (for example, muscle or joint limitations), mild pain or discomfort, lack of energy (physical tiredness), lack of physical skills, lack of knowledge or guidance about physical activity, insufficiently safe environment (criminality), concern about one’s appearance during practice, and lack of interest in practicing. The subject classified each barrier in a factor measured as “always”, “almost always”, “sometimes”, “almost never” or “never”. To assess the associations between stages of be-havior change, levels of physical activity and barriers to practice, we decided to group the stages in the fol-lowing way: a) maintenance and action, encompassing individuals considered physically active; b) preparation, contemplation and pre-contemplation, encompassing individuals considered inactive or irregularly active. This stratification of the stages of behavior change is consist-ent with analyses performed in previous studies14.
Data analysis encompassed descriptive statistics, with mean and standard deviation values, as well as distribution of absolute and relative frequency. To per-form comparisons between proportions, the chi-square test was used, with level of significance p < 0.05. The statistical program adopted was SPSS version 20.
Results
All the visually impaired individuals enrolled in APA-DEVI were invited to participate in the research, tota-ling 80 students. In the study, 40 subjects were assessed: 23 men (57.5%) and 17 women (42.5%), with mean age of 39.52 (± 17.58) years for the men and 39.88 (± 14.96) years for the women. The other students of the association did not attend the classes regularly or did not accept to participate in the study.
Of the 40 participants, all had visual impairment with different degrees of visual acuity: some were blind (their perception of light is insufficient to acquire knowledge through visual means) and some had low vision (they have difficulty in performing visual tasks, even with corrective lenses)15. Within these two
clas-sifications, there are two forms of acquisition of the impairment: it can be congenital (the person has had the impairment since birth, due to heredity, albinism, intrauterine inflammations, etc.) or it can be acquired as a result of some other pathology, like astigmatism, cataract, diabetes, ocular trauma, among others.
Table 1 presents the distribution of frequency of the
participants’ type of impairment and the classification as inactive and active individuals. It is possible to see that a high percentage of physically inactive individ-uals was found among participants classified as blind and also among participants with low vision. When we analyze the participants as a whole, the result shows high prevalence of inactive individuals (70%). Howev-er, in the comparison between the groups of congeni-tal blindness, acquired blindness, congenicongeni-tal low vision and acquired low vision, no statistical difference was found (p < 0,05).
Table 1 – Distribution of frequencies in relation to type of impair-ment and level of physical activity, Guarapuava, Paraná (n = 40)
Variables Inactive Active p
n (%) n (%) Congenital blindness 4 (80.0) 1 (20.0)
0.552 Acquired blindness 7 (70.0) 3 (30.0)
Congenital low vision 4 (50.0) 4 (50.0) Acquired low vision 13 (76.5%) 4 (23.5%)
Chi-square test. Level of significance p < 0.05.
The results obtained by the questionnaire of barriers perception are presented in Tables 2 and 3. We decided to divide the results in two: Table 2 classifies the partici-pants according to level of physical activity in active and inactive, and Table 3 classifies them according to visual impairment: congenital blindness, acquired blindness, congenital low vision and acquired low vision.
It is possible to see, in Table 2, that the factors that most interfere in the practice of physical activity, ac-cording to level of physical activity, are: “lack of support from family and/or friends”, “bad mood” and “physical limitations”. All these barriers were mentioned with higher prevalence by the participants classified as inac-tive, with responses “almost always/always” (p < 0.05). In Table 3, no significant differences are observed for the barriers to physical activity between the groups of congenital blindness, acquired blindness, congenital low vision and acquired low vision (p > 0.05).
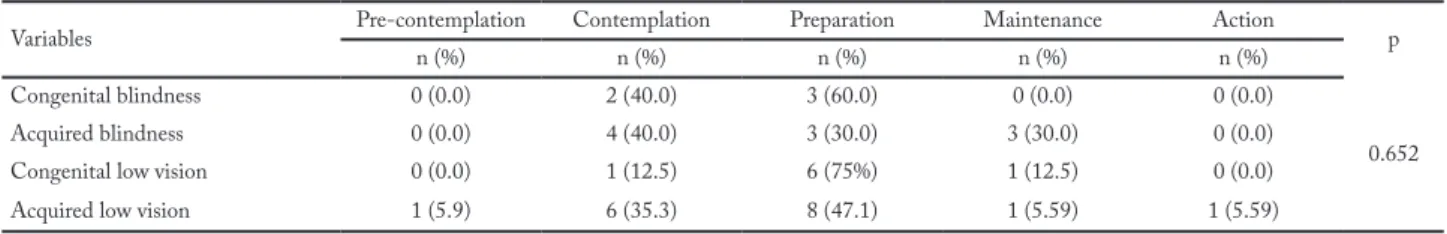
The study also aimed to assess at which stages of behavior change in relation to physical activity the par-ticipants were (Table 4). In the comparison between congenital blindness, acquired blindness, congenital low vision and acquired low vision, no significant dif-ference was found (p < 0,05).
Discussion
Table 2 – Distribution of frequencies of the visually impaired indi-viduals in relation to barriers to physical activity practice, classified by level of physical activity, Guarapuava, Paraná (n = 40).
Variables Never/ Almost never Sometimes Almost always/ Always p n (%) n (%) n (%) Extensive working hours
Inactive 27 (96.4) 1 (3.6) 0 (0.0) 0.249 Active 11 (91.7) 0 (0.0) 0 (0.0) Family commitments Inactive 15 (43.7) 4 (14.3) 9 (32.1) 0.258 Active 8 (66.7) 3 (25.0) 1 (8.3) Inadequate weather Inactive 8 (28.6) 2 (7.1) 18 (64.3) 0.057 Active 6 (50.0) 3 (25.0) 3 (25.0) Lack of available space
Inactive 6 (21.4) 1 (3.6) 21 (75.0) 0.351 Active 2 (16.7) 2 (16.7) 8 (66.7) Lack of equipment Inactive 6 (21.4) 1 (3.6) 21 (75.0) 0.351 Active 2 (16.7) 2 (16.7) 8 (66.7) Domestic chores Inactive 14 (50.0) 7 (25.0) 7 (25.0) 0.451 Active 8 (66.7) 1 (8.3) 3 (25.0) Lack of company Inactive 8 (28.6) 3 (10.7) 17 (60.7) 0.420 Active 5 (41.7) 0 (0.0) 7 (58.3) Lack of support from
family and/or friends
Inactive 13 (46.4) 2 (7.1) 13 (46.4) 0.011 Active 9 (75.0) 3 (25.0) 0 (0.0) Lack of financial resources
Inactive 12 (42.9) 4 (14.3) 12 (42.9) 0.157 Active 4 (33.3) 5 (41.7) 3 (25.0) Bad mood Inactive 18 (64.3) 0 (0.0) 10 (35.7) 0.018 Active 7 (58.3) 3 (25.0) 2 (16.7) Fear of being injured
Inactive 7 (25.0) 2 (7.1) 19 (67.9) 0.543 Active 5 (41.7) 1 (8.3) 6 (50.0) Physical limitations Inactive 5 (17.9) 0 (0.0) 23 (82.1) 0.034 Active 4 (33.3) 2 (16.7) 6 (50.0) Lack of energy Inactive 13 (46.4) 2 (7.1) 13 (46.4) 0.441 Active 66.7% 1 (8.3) 3 (25.0)
Mild pain and discomfort
Inactive 13 (46.4) 4 (14.3) 11 (39.3) 0.684 Active 7 (58.3) 2 (16.7) 3 (25.0) Lack of physical ability
Inactive 6 (21.4) 2 (7.1) 20 (71.4) 0.062 Active 7 (58.3) 0 (0.0) 5 (41.7) Variables Never/ Almost never Sometimes Almost always/ Always p n (%) n (%) n (%) Lack of knowledge or
guidance about physical activity Inactive 8 (28.6) 2 (7.1) 18 (64.3) 0.100 Active 2 (16.7) 4 (33.3) 6 (50.0) Insufficiently safe environment Inactive 7 (25.0) 1 (3.6) 20 (71.4) 0.492 Active 5 (41.7) 0 (0.0) 7 (58.3) Concern about one’s
appearance during practice
Inactive 18 (64.3) 1 (3.6) 9 (32.1) 0.806 Active 7 (58.3) 1 (8.3) 4 (33.3) Lack of interest in practicing Inactive 21 (75.0) 3 (10.7) 4 (14.3) 0.162 Active 12 (100.0) 0 (0.0) 0 (0.0)
Chi-square test. Level of significance p < 0.05.
Table 3 – Distribution of frequency of the visually impaired individ-uals in relation to barriers to physical activity practice, classified by level of impairment, Guarapuava, Paraná (n = 40).
Variables Never/ Almost never Sometimes Almost always/ Always p n (%) n (%) n (%) Extensive working hours
Congenital blindness 5 (100.0) 0 (0.0) 0 (0.0) 0.309 Acquired blindness 9 (90.0) 1 (10.0) 0 (0.0) Congenital low vision 7 (87.5) 0 (0.0) 1 (12.5) Acquired low vision 17 (10.0) 0 (0.0) 0 (0.0) Family commitments
Congenital blindness 3 (60.0) 2 (40.0) 0 (0.0) 0.095 Acquired blindness 5 (50.0) 3 (30.0) 2 (20.0) Congenital low vision 5 (62.5) 3 (37.5) 0 (0.0) Acquired low vision 8 (47.1) 1 (5.9) 8 (47.1) Inadequate weather
Congenital blindness 1 (20.0) 1 (20.0) 3 (60.0) 0.651 Acquired blindness 4 (40.0) 1 (10.0) 5 (50.0) Congenital low vision 4 (50.0) 2 (25.0) 2 (25.0) Acquired low vision 4 (23.5) 2 (11.8) 11 (64.7) Lack of available space
Congenital blindness 2 (40.0) 0 (0.0) 3 (60.0) 0.394 Acquired blindness 2 (20.0) 1 (10.0) 7 (70.0) Congenital low vision 0 (0.0) 0 (0.0) 8 (100.0) Acquired low vision 3 (17.6) 3 (17.6) 11 (64.7) Lack of equipment
Congenital blindness 2 (40.0) 0 (0.0) 3 (60.0) 0.394 Acquired blindness 2 (20.0) 1 (10.0) 7 (70.0) Congenital low vision 0 (0.0) 0 (0.0) 8 (100.0) Acquired low vision 3 (17.6) 3 (17.6) 11 (64.7)
… continue
perception of barriers to practice and the stages of behavior change of visually impaired individuals. The main results were: a) high prevalence of inactive sub-jects (70%); b) the main barriers mentioned by the inactive subjects were: “lack of support from family and/or friends”, “bad mood” and “physical limitations”.
In an assessment of level of physical activity with 575 non-impaired individuals of both sexes aged between 20 and 39 years, the researchers found a prevalence of phys-ical inactivity of 57.4%15. Thus, the comparison between
visually impaired and non-impaired individuals shows similarity of behavior among the subjects, who present more than 50% of prevalence of physical inactivity.
Among the barriers, the most relevant factor that emerges as the main limiting factor is “lack of support
Variables Never/ Almost never Sometimes Almost always/ Always p n (%) n (%) n (%) Domestic chores Congenital blindness 2 (40.0) 2 (40.0) 1 (20.0) 0.842 Acquired blindness 6 (60.0) 2 (20.0) 2 (20.0) Congenital low vision 4 (50.0) 1 (12.5) 3 (37.5) Acquired low vision 7 (41.2) 6 (35.3) 4 (23.5) Lack of company
Congenital blindness 0 (0.0) 2 (40.0) 3 (60.0) 0.137 Acquired blindness 4 (40.0) 2 (20.0) 4 (40.0) Congenital low vision 1 (12.5) 0 (0.0) 7 (87.5) Acquired low vision 6 (35.3) 1 (5.9) 10 (58.8) Lack of support from
family and/or friends
Congenital blindness 2 (40.0) 1 (20.0) 2 (40.0) 0.989 Acquired blindness 6 (62.5) 1 (12.5) 3 (25.0) Congenital low vision 5 (62.5) 1 (12.5) 2 (25.0) Acquired low vision 9 (52.9) 2 (11.8) 6 (35.3) Lack of financial resources
Congenital blindness 2 (40.0) 2 (40.0) 1 (20.0) 0.866 Acquired blindness 3 (30.0) 2 (20.0) 5 (50.0) Congenital low vision 4 (50.0) 2 (25.0) 2 (25.0) Acquired low vision 5 (29.4) 5 (29.4) 7 (41.2) Bad mood
Congenital blindness 3 (60.0) 1 (20.0) 1 (20.0) 0.636 Acquired blindness 6 (60.0) 2 (20.0) 2 (20.0) Congenital low vision 6 (75.0) 0 (0.0) 2 (25.0) Acquired low vision 9 (52.9) 1 (5.9) 7 (41.2) Fear of being injured
Congenital blindness 0 (0.0) 0 (0.0) 5 (100.0) 0.425 Acquired blindness 2 (20.0) 2 (20.0) 6 (60.0) Congenital low vision 3 (37.5) 0 (0.0) 5 (62.5) Acquired low vision 6 (35.3) 2 (11.8) 9 (52.9) Physical limitations
Congenital blindness 0 (0.0) 1 (20.0) 4 (80.0) 0.711 Acquired blindness 3 (30.0) 1 (10.0) 6 (60.0) Congenital low vision 1 (12.5) 0 (0.0) 7 (87.5) Acquired low vision 3 (17.6) 2 (11.8) 12 (70.6) Lack of energy
Congenital blindness 1 (20.0) 0 (0.0) 4 (80.0) 0.134 Acquired blindness 5 (50.0) 3 (30.0) 2 (20.0) Congenital low vision 5 (62.5) 0 (0.0) 3 (37.5) Acquired low vision 9 (52.9) 1 (5.9) 7 (41.2) Mild pain and discomfort
Congenital blindness 2 (40.0) 1 (20.0) 2 (40.0) 0.994 Acquired blindness 4 (40.0) 3 (30.0) 3 (30.0) Congenital low vision 3 (37.5) 2 (25.0) 3 (37.5) Acquired low vision 8 (47.1) 3 (22.5) 6 (35.0)
Variables Never/ Almost never Sometimes Almost always/ Always p n (%) n (%) n (%) Lack of physical ability
Congenital blindness 1 (20.0) 1 (20.0) 3 (60.0) 0.801 Acquired blindness 4 (40.0) 1 (10.0) 5 (50.0) Congenital low vision 2 (25.0) 1 (12.5) 5 (62.5) Acquired low vision 2 (11.8) 3 (17.6) 12 (70.6) Lack of knowledge or
guidance about physical activity
Congenital blindness 1 (20.0) 1 (20.0) 3 (60.0) 0.320 Acquired blindness 4 (40.0) 0 (0.0) 6 (60.0) Congenital low vision 0 (0.0) 1 (12.5) 7 (87.5) Acquired low vision 5 (29.4) 4 (23.5) 8 (47.1) Insufficiently safe
environment
Congenital blindness 0 (0.0) 0 (0.0) 5 (100.0) 0.511 Acquired blindness 1 (10.0) 1 (10.0) 8 (80.0) Congenital low vision 2 (25.0) 1 (12.5) 5 (62.5) Acquired low vision 6 (35.3) 2 (11.8) 9 (52.9) Concern about one’s
appearance during practice
Congenital blindness 4 (80.0) 0 (0.0) 1 (20.0) 0.816 Acquired blindness 7 (70.0) 0 (0.0) 3 (30.0) Congenital low vision 4 (50.0) 1 (12.5) 3 (37.5) Acquired low vision 9 (52.9) 2 (11.8) 6 (35.3) Lack of interest in
practicing
Congenital blindness 4 (80.0) 1 (20.0) 0 (0.0) 0.377 Acquired blindness 6 (60.0) 1 (10.0) 3 (30.0) Congenital low vision 7 (87.5) 1 (12.5) 0 (0.0) Acquired low vision 14 (82.4) 2 (11.8) 1 (5.9)
Chi-square test. Level of significance p < 0.05. … continue
… continue
from family and/or friends” (43.4%), caused by over-protection or by the belief that these individuals do not have skills to be physically active. This result was also found by Morgado et al.7, who assessed, in a qualitative
way, facilitating and limiting factors for physical activity practice in 11 subjects with congenital blindness. The researchers found that the family is a limiting factor, but also a facilitating one, which involves issues like moti-vation and support. Concerning this factor, the profes-sionals must intervene not only in the individual, but also in the family and in the people who are close to the individual. The role of family and friends can be under-stood as an important source of support and incentive, so that the visually impaired can view physical activity as a way of improving their quality of life and even their social development6. However, in some cases, the family
can be an obstacle to the practice of physical activity, due to overprotection or to the belief that visually impaired individuals do not have motor ability and can be injured in some way, which makes them remain dependent on their family. Due to this, it is of paramount importance that the family be educated about different adaptation strategies of physical activities for the visually impaired, in order to provide them with opportunities to adopt a healthy lifestyle and to become autonomous16.
The second most prevalent barrier was “physical lim-itations”. Due to the visual limitation, the participants report having difficulties in learning and performing the activities of daily living, as well as difficulties in locomo-tion, spatial and temporal organizalocomo-tion, among others. We can consider, as justifications, the visual limitation and the little amount of time destined for the practice of physical activity in the association’s environment. This barrier can be solved through the teaching of these skills in the physical education classes attended by the participants. This teaching can include activities that fa-vor the acquisition of basic skills like walking, running, jumping, exploration of objects and devices, real envi-ronments and situations, in an attempt to help them fully use their sensory potential, among other strategies.
The barrier of “bad mood” also emerges as a factor that limits physical activity, more prevalent among the inactive individuals, compared to the active ones. In a study with obese subjects, it was found that this barrier is related to a decrease in the motivation to physical activity practice, which can be improved through mod-ifications in subjects’ body composition17.
Other barriers like the “weather factor” emerge as possible aggravating factors, but did not have statistical difference. Rain, cold weather or very hot weather can also justify the non-practice of physical activities. Rain, for example, limits the practice of activities (88.5%). The study was carried out in Guarapuava, an inland city of the State of Paraná located in the third pla-teau, with an altitude of 1,200 meters, which makes it be one of the coldest cities of the State. In a study with non-impaired elderly individuals of both sexes, the researchers reported that 39.7% of the participants mentioned this same barrier18. Moreover, the elderly
perceived that the weather prevents the person from having a good physical performance. It is necessary to raise subjects’ awareness in relation to the weather: it is merely an environmental aspect, not a factor that limits the practice of physical activity. In cold and rainy days, searching for closed places can be a strategy to miti-gate this factor. In hot weather, the strategy can be the opposite of the previous one: searching for open spaces like parks and squares and practicing lighter activities.
We conclude that the visually impaired individuals of both sexes, active and inactive, perceive, as barriers to physical activity, lack of support from family and/or friends, physical limitations and bad mood. The study presented some strategies to solve these barriers, but fur-ther research is needed on the theme. The identification of barriers is an important aid to the development of in-tervention, adherence and health promotion programs.
Conflicts of interest
The authors declare there are no conflicts of interest.
Table 4 – Distribution of frequency of the visually impaired individuals in relation to the stages of behavior change, Guarapuava, Paraná (n = 40)
Variables Pre-contemplation Contemplation Preparation Maintenance Action p
n (%) n (%) n (%) n (%) n (%)
Congenital blindness 0 (0.0) 2 (40.0) 3 (60.0) 0 (0.0) 0 (0.0)
0.652
Acquired blindness 0 (0.0) 4 (40.0) 3 (30.0) 3 (30.0) 0 (0.0)
Congenital low vision 0 (0.0) 1 (12.5) 6 (75%) 1 (12.5) 0 (0.0)
Acquired low vision 1 (5.9) 6 (35.3) 8 (47.1) 1 (5.59) 1 (5.59)
Quote this article as:
Matoso GP, Portela BS. Nível de atividade física e barreiras percebidas para sua prática em adultos com deficiência visual. Rev Bras Ati Fis Saúde. 2019;24:e0094. DOI: 10.12820/rbafs.24e0094
Authors’ contribution
Matoso GP participated in the initial conception of the study, data collection, and in the writing and critical review of the text. Portela BS participated in the initial conception of the study, sta-tistical analysis, and in the writing and critical review of the text.
References
1. Penedo FJ, Dahn JR. Exercise and well-being: a review of
mental and physical health benefits associated with physical activity. Curr Opin Psychiatry. 2005;18(2):189-93.
2. Janssen I, Leblanc AG. Systematic review of the health
benefits of physical activity and fitness in school-aged children and youth. Inter. J Behav Nutr Phys Act. 2010;7(40):1-16.
3. Malta DC, Stopa SR, Canuto R, Gomes NL, Mendes
VLF, Goulart BNGD et al. Prevalência autorreferida de deficiência no Brasil, segundo a Pesquisa Nacional de Saúde, 2013. Ciênc. Saúde Colet. 2016;21(10):3253-64.
4. Kozub FM, Oh H. An exploratory study of physical activity
levels in children and adolescents with visual impairments. Clinical Kinesiology. 2004;58(3):1-7.
5. Stuart ME, Lieberman L, Hand KE. Beliefs about physical
activity among children who are visually impaired and their parents. J Vis Impair Blind. 2006;100(4):223-34.
6. Lieberman LJ. Fitness for individuals who are visually
impaired or deaf blind. Rehabilitation and Education for Blindness and Visual Impairment. 2002;34(1), 13–23.
7. Morgado FFDR, Campana ANNB, Morgado JJM, Fortes
LDS, Tavares MDCGCF. Facilitadores e barreiras percebidos por pessoas com cegueira congênita para a prática de atividade física. Rev. bras. educ. espec. 2013;19(3):379-94.
8. Brazão MC, Hirayama MS, Gobbi S, Nascimento CMC;
Roseguini AZ. Estágios de mudança de comportamento e barreiras percebidas à prática de atividade física em idosos residentes em uma cidade de médio porte do Brasil. Motriz. 2009;15(4):759-67.
9. Petroski EL, Silva DAS, Reis RS, Pelegrini A. Estágios
de mudança de comportamento e percepção positiva do ambiente para atividade física em usuários de parque urbano. Motricidade. 2009;5(2):17-31.
10. Craig CL, Marshall AL, Sjostrom M, Bauman AE,
Booth ML, Ainsworth BE. International physical activity questionnaire: 12-country reliability and validity. Med Sci Sports Exerc. 2003;35(8):1381-95.
11. Matsudo S, Araújo T, Andrade D, Matsudo V, Andrade E,
Oliveira LC, et al. Questionário internacional de atividade física (IPAQ): estudo de validade e reprodutibilidade no Brasil. Rev Bras Ativ Fís Saúde. 2001;6(2):05-18.
12. Tremblay MS, Aubert S, Barnes JD, Saunders TJ, Carson
V, Latimer-Cheung AE, et al. Sedentary behavior research network (SBRN)–terminology consensus project process and outcome. Int J Behav Nutr Phys Act. 2017;14(1):5-81.
13. Martins MO, Petroski EL. Mensuração da percepção de
barreiras para a prática de atividades físicas: uma proposta de instrumento. Rev Bras Cineantropom Desempenho Hum. 2000;2(1):58-65.
14. Rigoni PAG, Nascimento JRAD, Costa GNFDS, Vieira
LF. Estágios de mudança de comportamento e percepção de barreiras para a prática de atividade física em universitários do curso de Educação Física. Rev Bras Ativ Fís Saúde. 2012;17(2):87-92.
15. Barreta E, Barreta M, Peres KG. Nível de atividade física e
fatores associados em adultos no Município de Joaçaba, Santa Catarina, Brasil. Cad. Saúde Pública. 2007;23(7):1595-1602.
16. Greguol M, Gobbi E, Carraro A. Physical activity practice
among children and adolescents with visual impairment – influence of parental support and perceived barriers. Disabil Rehabil. 2015;37(4):327-30.
17. Boscatto EC, Duarte MDFDS, Gomes MDA. Estágios de
mudança de comportamento e barreiras para a atividade física em obesos mórbidos. Rev Bras Cineantropom Desempenho Hum. 2011;13(5), 329-34.
18. Nascimento CMC, Gobbi S, Hirayama MS, Brazão MC.
Nível de atividade física e as principais barreiras percebidas por idosos de rio claro. Rev. Educ. Fís/UEM. 2008;19(1):109-18.
Received: 12/20/2018 Approved: 11/29/2019