http://dx.doi.org/10.1590/0037-8682-0065-2016
Major Article
INTRODUCTION
Corresponding author: Dra. Amanda Priscila de Santana Cabral Silva. e-mail: [email protected]
Received 21 February 2016 Accepted 28 April 2016
Two decades of tuberculosis in a city in Northeastern Brazil:
advances and challenges in time and space
Amanda Priscila de Santana Cabral Silva
[1], Wayner Vieira de Souza
[1]and Maria de Fátima Pessoa Militão de Albuquerque
[1][1]. Núcleo de Estudos em Saúde Coletiva, Centro de Pesquisas Aggeu Magalhães, Fundação Oswaldo Cruz, Recife, Pernambuco, Brasil.
ABSTRACT
Introduction: This study presents two decades of epidemiological data on tuberculosis (TB), in order to understanding the disease
proile and its spatiotemporal dynamics. Methods: This descriptive study was performed in the City of Olinda/Pernambuco,
Brazil, from 1991-2010, and it analyzed new patients with TB living in the city. We used the χ²-test with a p-value <0.05 to identify differences in trends. Incidence and cluster distribution were identiied using spatial scan statistics. Results: In total,
6202 new cases were recorded during the two decades. The highest incidence occurred in 1995 (110 cases/100,000 inhabitants), and the lowest occurred in 2009 (65 cases/100,000 inhabitants) (β=-1.44; R²=0.43; p=0.0018). The highest mortality occurred in 1998 (16 deaths/100,000 inhabitants), and the lowest occurred in 2008 (5 deaths/100,000 inhabitants) (β=-0.19; R²=0.17; p=0.07). There was a male predominance (65%), and ages ranged from 20-49 years (65%). There was a substantial increase in the number of patients that were cured after treatment (60% to 67%; p<0.001) as well as those tested for HIV (1.9% to 58.5%; p<0.001). During the irst decade, clusters with p-values <0.05 included 29% of the total notiied cases, and in the second decade, that percentage was 12%. Conclusions: We observed a decreasing trend in incidence, which was signiicant, and mortality rates, which was not signiicant. The increased number of laboratory tests performed relects advances in surveillance, and a reduction
in the proportion of cases in primary clusters suggests, among other things, that the disease is spreading across the region. Keywords: Tuberculosis. Epidemiological surveillance. Spatial analysis.
Tuberculosis (TB) remains a major public health problem, affecting millions of people each year. In 2010, there were 8.8
million new cases worldwide and 1.5 million deaths. In the same year, Brazil registered 71,000 new cases and 4,800 deaths. At that time while TB incidence in Brazil was 37 cases/100,000 inhabitants, the state of Pernambuco had an incidence of 46
cases/100,000 inhabitants, the fourth highest incidence amongst Brazilian states. TB-associated mortality, which throughout
Brazil was 2.4 deaths/100,000 inhabitants, in the State of
Pernambuco reached 4 deaths/100,000 inhabitants(1) (2). Within Brazil, metropolitan municipalities have conditions that potentiate a higher risk of TB infection, such as a high population density and large concentrations of poverty. The relationships between high rates of TB infection and socioeconomic and demographic determinants have been established both on individual (male, young adult) and population [high illiteracy or co-infection with human
immunodeiciency virus (HIV)] levels, revealing some causes
of high disease incidence(3) (4) (5) (6).
A tuberculosis surveillance system aligned to a territorial base would link occurrences of the disease to the space where it occurs, thus enabling a more appropriate response from health services(7) (8). Despite the availability of geospatial analysis software, application of these technologies within services is still limited, particularly with regard to surveillance strategies,
which would certainly beneit from information regarding the
territory, conditions, and determinants of TB incidence in order to optimize resources and prioritize actions.
Olinda, a municipality within the metropolitan region of Recife in Pernambuco, is the focus of a study of endemic diseases, including TB(7) (8) (9) (10) (11). TB was previously monitored there for a decade (1991-2000) in research studies using a geostatistical approach(7) (8).
The present study has made a rare contribution by extending the epidemiological analysis of TB in the residents of Olinda for a 20-year period in order to deepen our knowledge regarding the
proile of the disease and its spatiotemporal dynamics.
RESULTS METHODS
This descriptive historical study was conducted in the City
of Olinda from 1991 to 2010. In 2010, Olinda had 377,779 inhabitants and 9,296 inhabitants/km², the highest population
density in northeast Brazil(12).
Olinda has three homogeneous areas with regard to quality of housing: 1) the coastal zone, which has urban infrastructure
and vertical density; 2) the central area, a region with irregular water supply and low sewer/sanitation coverage; and 3) the west,
with poor housing standards and poor urban infrastructure(13). Reported cases were obtained from the National System
for Notiiable Diseases [Sistema de Informação de Agravos
de Notiicação (SINAN)](14). Data on mortality and resident population were obtained from the Mortality Information System [Sistema de Informações sobre Mortalidade (SIM)](15) and the Brazilian Institute of Geography and Statistics Instituto
Brasileiro de Geograia e Estatística (IBGE)](12), respectively. Incidence rates and mortality were calculated for each of the years studied. As recommended by the National Tuberculosis Control Programme [Programa Nacional de Controle da Tuberculose (PNCT)](16), incidence was calculated from new cases, excluding patients who defaulted or received prior treatment. In order to analyze trends, simple linear regression
models (y = β0 + β1t) were used, in which TB rates and
years were the dependent (y) and independent (t) variables,
respectively. P values <0.05 were considered signiicant in the hypothesis test β=0.
Proiles of new patients with TB were described in ive-year periods (1991-1995, 1996-2000, 2001-2005, and 2006-2010),
according to years of schooling, race/color, clinical form, the
proportion of TB and HIV coinfection, smear and sputum culture performance, HIV testing, and the situation at case
closure. Race/color was categorized as black and non-black, with the former including black and dark-skinned patients and the latter including white and indigenous patients(17). Tests were considered as having been performed when results were positive or negative, and those classiied as in progress were presented in a separate category.
TB incidence and proportion were also calculated according
to sex and age group. To calculate trends, χ² with a 5% signiicance level was used for the ive-year analyses. Data analysis was conducted in Epiinfo7.
Tuberculosis spatial analysis was conducted in ive-year
periods by analyzing the annual mean incidence rates via census tracts and using scan statistics. For this technique, the residences of the new patients were georeferenced and aggregated by census
tracts and ive-year periods. The Poisson probability model was
utilized to test the hypothesis that there was a homogeneous TB incidence within municipalities throughout all census tracts(18). The scan statistic technique uses circular windows that correspond to a geographic area. In this study, the clusters
included proportions less than or equal to 5% of the resident
population(18).
The number of sectors that formed each cluster was
identiied, together with the number of observed and expected
cases, the relative risk, the p-value, the proportion of cases in relation to the total that occurred within the municipality, and the percentage of the total municipality population who reside
in the cluster. We also stratiied clusters according to the p-value
for testing the homogeneous spatial distribution hypothesis for
TB incidence into those being less than or equal to 5%, those between 5% and 20%, and those greater than 20%. Spatial data analyses were performed with SatScan 9.3.1(18) and Terraview 4.2.2(19).
Ethical considerations
The research project that included this study was submitted for approval to the Research Ethics Committee at the Centro de
Pesquisas Aggeu Magalhães (Number 33878514.4.0000.5190 - report 782312/2014).
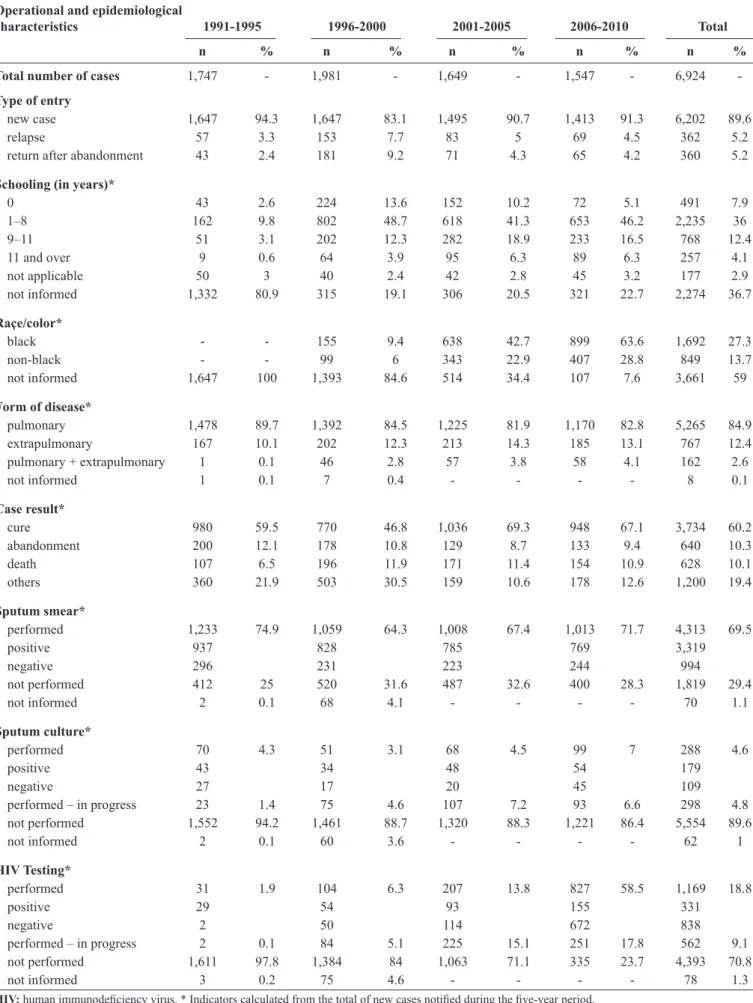
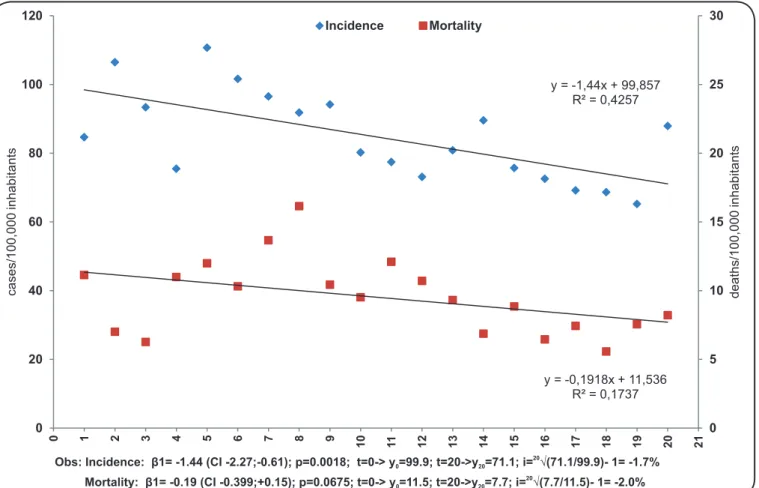
Between 1991 and 2010, a total of 6,924 TB cases were reported, of which 6,202 (89.6%) were new cases, resulting in a mean total of 310 new cases/year (Table 1). During the
study period, the highest incidence occurred in 1995 (110
cases/100,000 inhabitants) and the lowest incidence occurred in
2009 (65 cases/100,000 inhabitants). A reduction in incidence was described using the model y = 99.9 - 1.44t (R²=0.43; p=0.0018), i.e. 29 cases were avoided per 100,000 inhabitants during the twenty years analyzed, a decrease of only 1.7% or
almost 100 cases per year (Figure 1). Mortality rates luctuated, with the highest and lowest occurring in 1998 (16 deaths/100,000
inhabitants) and 2008 (5 deaths/100,000 inhabitants), respectively. Despite the decreasing trend, there was no statistical signiicance (y = 11.5-0.19t; R²=0.17; p=0.07) (Figure 1).
Although reductions in incidence were observed in both sexes, males were the most affected throughout the period, during which the male/female ratio remained 2/1. Reductions in incidence were also observed for all age groups, but while
over 60% of cases concerned patients between 20 and 49 years of age, patients older than 50 years were most affected, with a rate of 153.6 cases/100,000 inhabitants between 1996 and
2000 (Table 2). Disease among this group accounts 26.2% of cases. Other identiied features, although hindered by the high
proportion of missing records, included the high proportion of patients with less than 8 years of study, including those with
no schooling (44%), as well as a predominance of cases within the black community (27%) (Table 1). The pulmonary form
of this disease was detected in over 80% of patients. However, extrapulmonary form increased when the irst and last ive-year periods were compared [relative risk (RR) =1.33; χ²=8.7; p=0.003] (Table 1). During these two decades, the sputum smear
TABLE 1 - Operational and epidemiological characteristics of patients with tuberculosis in Olinda, Pernambuco State, from 1991 to 2010. Operational and epidemiological
characteristics 1991-1995 1996-2000 2001-2005 2006-2010 Total
n % n % n % n % n %
Total number of cases 1,747 - 1,981 - 1,649 - 1,547 - 6,924
-Type of entry
new case 1,647 94.3 1,647 83.1 1,495 90.7 1,413 91.3 6,202 89.6 relapse 57 3.3 153 7.7 83 5 69 4.5 362 5.2 return after abandonment 43 2.4 181 9.2 71 4.3 65 4.2 360 5.2
Schooling (in years)*
0 43 2.6 224 13.6 152 10.2 72 5.1 491 7.9 1–8 162 9.8 802 48.7 618 41.3 653 46.2 2,235 36 9–11 51 3.1 202 12.3 282 18.9 233 16.5 768 12.4 11 and over 9 0.6 64 3.9 95 6.3 89 6.3 257 4.1 not applicable 50 3 40 2.4 42 2.8 45 3.2 177 2.9 not informed 1,332 80.9 315 19.1 306 20.5 321 22.7 2,274 36.7
Raçe/color*
black - - 155 9.4 638 42.7 899 63.6 1,692 27.3 non-black - - 99 6 343 22.9 407 28.8 849 13.7 not informed 1,647 100 1,393 84.6 514 34.4 107 7.6 3,661 59
Form of disease*
pulmonary 1,478 89.7 1,392 84.5 1,225 81.9 1,170 82.8 5,265 84.9 extrapulmonary 167 10.1 202 12.3 213 14.3 185 13.1 767 12.4 pulmonary + extrapulmonary 1 0.1 46 2.8 57 3.8 58 4.1 162 2.6 not informed 1 0.1 7 0.4 - - - - 8 0.1
Case result*
cure 980 59.5 770 46.8 1,036 69.3 948 67.1 3,734 60.2 abandonment 200 12.1 178 10.8 129 8.7 133 9.4 640 10.3 death 107 6.5 196 11.9 171 11.4 154 10.9 628 10.1 others 360 21.9 503 30.5 159 10.6 178 12.6 1,200 19.4
Sputum smear*
performed 1,233 74.9 1,059 64.3 1,008 67.4 1,013 71.7 4,313 69.5 positive 937 828 785 769 3,319
negative 296 231 223 244 994
not performed 412 25 520 31.6 487 32.6 400 28.3 1,819 29.4 not informed 2 0.1 68 4.1 - - - - 70 1.1
Sputum culture*
performed 70 4.3 51 3.1 68 4.5 99 7 288 4.6
positive 43 34 48 54 179
negative 27 17 20 45 109
performed – in progress 23 1.4 75 4.6 107 7.2 93 6.6 298 4.8 not performed 1,552 94.2 1,461 88.7 1,320 88.3 1,221 86.4 5,554 89.6 not informed 2 0.1 60 3.6 - - - - 62 1
HIV Testing*
performed 31 1.9 104 6.3 207 13.8 827 58.5 1,169 18.8
positive 29 54 93 155 331
negative 2 50 114 672 838
y = -1,44x + 99,857 R² = 0,4257
y = -0,1918x + 11,536 R² = 0,1737
0 5 10 15 20 25 30
0 20 40 60 80 100 120
0 1 2 3 4 5 6 7 8 9 10 11 12 13 14 15 16 17 18 19 20 21
d
e
a
th
s
/1
0
0
,0
0
0
in
h
a
b
it
a
n
ts
c
a
s
e
s
/1
0
0
,0
0
0
in
h
a
b
it
a
n
ts
Incidence Mortality
Obs: Incidence: β1= -1.44 (CI -2.27;-0.61); p=0.0018; t=0-> y =99.9; t=20->y =71.1; i= √(71.1/99.9)- 1= -1.7%0 20 20
Mortality: β1= -0.19 (CI -0.399;+0.15); p=0.0675; t=0-> y =11.5; t=20->y =7.7; i= √(7.7/11.5)- 1= -2.0%0 20 20
FIGURE 1- Incidence and mortality trends for tuberculosis in Olinda, Pernambuco State, from 1991 (t=1) to 2010 (t=20).
TABLE 2 - Distribution, incidence (cases/100,000 inhabitants), and relative risk of new TB cases according to patient age and sex in Olinda, Pernambuco State, from 1991 to 2010.
1991-1995 1996-2000 2001-2005 2006-2010
n % incid RR n % incid RR n % incid RR n % incid RR Age group (years)
<20 215 13.3 28.5 1.0 172 10.6 25.0 0.9 139 9.4 20.0 0.7 123 8.8 19.3 0.7 20–49 1,047 65.0 137.9 1.0 1,023 63.2 127.5 0.9 996 67.6 114.4 0.8 883 63.5 92.2 0.7 ≥50 350 21.7 143.5 1.0 424 26.2 153.6 1.1 339 23.0 107.1 0.7 386 27.7 101.5 0.7
Sex
male 1,078 65.5 130.4 1.0 1,008 61.2 121.5 0.9 976 65.3 110.9 0.9 906 64.1 98.6 0.8 female 569 34.5 61.1 1.0 639 38.8 68.3 1.1 519 34.7 51.9 0.8 507 35.9 48.0 0.8 TB: tuberculosis; n: number; %: percentage; incid: incidence; RR: relative risk.
to a total of 58.5% of cases reported during the last ive years (RR=73.6; χ²=1502 9; p<0.001) (Table 1). However, given the evolution of laboratory testing, there is an outstanding number of
results classiied as in progress, both for the sputum culture and
HIV testing, which in the last ive years reached 17.8% (Table 1).
Cure rates started at 59.5% in the irst ive-year period and reached 67.1% between 2006 and 2010 (RR=1.39; χ²=63.0;
p<0.001) and, over the same period, treatment abandonment was reduced from 12.1% to 9.4% (RR=0.75; χ²=9.4; p=0.002)
(Table 1). The model estimates an initial incidence of 99.9 cases / 100,000 inhabitants and a final incidence of
1991- 1995
1996 - 2000
2001- 2005
2006- 2010
P-value
< 0.05 0.05 – 0.20 >0.20
Incidence (% of census tracts per class)
< 71.1 (51.0%) 71.1 – 86.0 (10.3%) 86.1 – 99.9 (8.2%) > 99.9 (30.5%)
P-value
< 0.05 0.05 – 0.20 >0.20
P-value
< 0.05 0.05 – 0.20 >0.20
P-value
< 0.05 0.05 – 0.20 >0.20
Incidence (% of census tracts per class)
< 71.1 (45.5%) 71.1 – 86.0 (9.3%) 86.1 – 99.9 (5.7%) > 99.9 (39.5%)
Incidence (% of census tracts per class)
< 71.1 (62.2%) 71.1 – 86.0 (12.7%) 86.1 – 99.9 (4.7%) > 99.9 (20.4%)
Incidence (% of census tracts per class)
< 71.1 (66.6%) 71.1 – 86.0 (7.7%) 86.1 – 99.9 (6.0%) > 99.9 (19.7%)
Incidence Clusters
meters
0 3000 6000 9000
above 99.9 cases/100,000 inhabitants suggest that, over the study period, the sectors presented (or remained) in a situation similar to conditions observed in the early 1990s.
By comparing the four five-year periods, there was a
signiicant reduction in the proportion of census tracts in which
the incidence was higher than 99.9 cases/100,000 inhabitants,
although with 6% of the conidence interval (CI) 86-99.9,
suggesting the possibility of a homogeneous TB trend within the
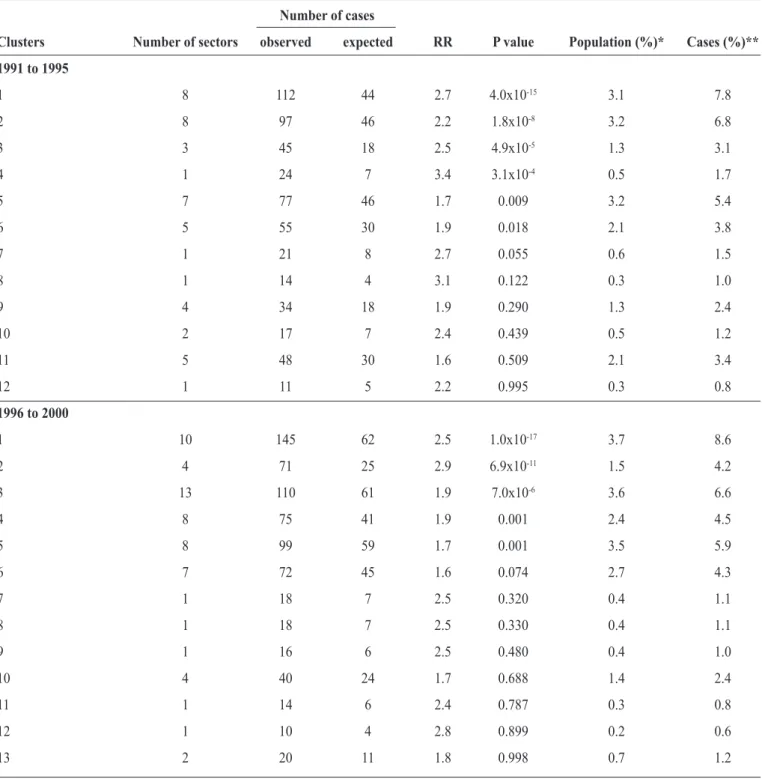
TABLE 3 - Characteristics of TB clusters in Olinda, Perambuco State from 1991 to 2010.
Number of cases
Clusters Number of sectors observed expected RR P value Population (%)* Cases (%)**
1991 to 1995
1 8 112 44 2.7 4.0x10⁻¹⁵ 3.1 7.8
2 8 97 46 2.2 1.8x10⁻⁸ 3.2 6.8
3 3 45 18 2.5 4.9x10⁻⁵ 1.3 3.1
4 1 24 7 3.4 3.1x10⁻⁴ 0.5 1.7
5 7 77 46 1.7 0.009 3.2 5.4
6 5 55 30 1.9 0.018 2.1 3.8
7 1 21 8 2.7 0.055 0.6 1.5
8 1 14 4 3.1 0.122 0.3 1.0
9 4 34 18 1.9 0.290 1.3 2.4
10 2 17 7 2.4 0.439 0.5 1.2
11 5 48 30 1.6 0.509 2.1 3.4
12 1 11 5 2.2 0.995 0.3 0.8
1996 to 2000
1 10 145 62 2.5 1.0x10⁻¹⁷ 3.7 8.6
2 4 71 25 2.9 6.9x10⁻¹¹ 1.5 4.2
3 13 110 61 1.9 7.0x10⁻⁶ 3.6 6.6
4 8 75 41 1.9 0.001 2.4 4.5
5 8 99 59 1.7 0.001 3.5 5.9
6 7 72 45 1.6 0.074 2.7 4.3
7 1 18 7 2.5 0.320 0.4 1.1
8 1 18 7 2.5 0.330 0.4 1.1
9 1 16 6 2.5 0.480 0.4 1.0
10 4 40 24 1.7 0.688 1.4 2.4
11 1 14 6 2.4 0.787 0.3 0.8
12 1 10 4 2.8 0.899 0.2 0.6
13 2 20 11 1.8 0.998 0.7 1.2
continue....
territory (Figure 2). Cluster analysis conirmed this hypothesis by demonstrating that in both ive-year periods of the irst decade almost 30% of cases were concentrated within the clusters with p<0.05, which had numbers of TB cases greater than
would be expected if the spatial distribution was homogeneous. These values were significantly lower in the third and
fourth ive-year periods, suggesting a greater disease spread
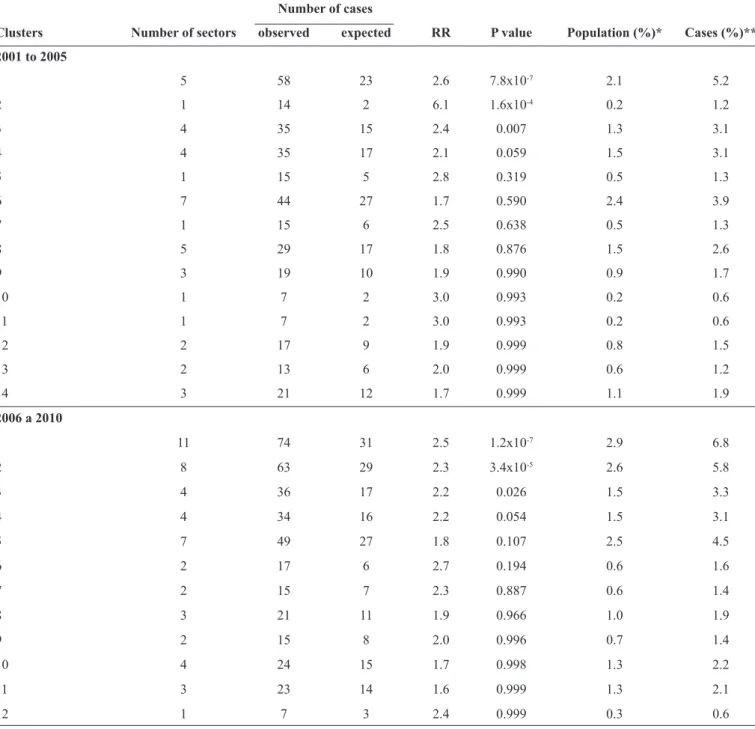
TABLE 3 - Continuation.
Number of cases
Clusters Number of sectors observed expected RR P value Population (%)* Cases (%)** 2001 to 2005
1 5 58 23 2.6 7.8x10⁻⁷ 2.1 5.2
2 1 14 2 6.1 1.6x10⁻⁴ 0.2 1.2
3 4 35 15 2.4 0.007 1.3 3.1
4 4 35 17 2.1 0.059 1.5 3.1
5 1 15 5 2.8 0.319 0.5 1.3
6 7 44 27 1.7 0.590 2.4 3.9
7 1 15 6 2.5 0.638 0.5 1.3
8 5 29 17 1.8 0.876 1.5 2.6
9 3 19 10 1.9 0.990 0.9 1.7
10 1 7 2 3.0 0.993 0.2 0.6
11 1 7 2 3.0 0.993 0.2 0.6
12 2 17 9 1.9 0.999 0.8 1.5
13 2 13 6 2.0 0.999 0.6 1.2
14 3 21 12 1.7 0.999 1.1 1.9
2006 a 2010
1 11 74 31 2.5 1.2x10⁻⁷ 2.9 6.8
2 8 63 29 2.3 3.4x10⁻⁵ 2.6 5.8
3 4 36 17 2.2 0.026 1.5 3.3
4 4 34 16 2.2 0.054 1.5 3.1
5 7 49 27 1.8 0.107 2.5 4.5
6 2 17 6 2.7 0.194 0.6 1.6
7 2 15 7 2.3 0.887 0.6 1.4
8 3 21 11 1.9 0.966 1.0 1.9
9 2 15 8 2.0 0.996 0.7 1.4
10 4 24 15 1.7 0.998 1.3 2.2
11 3 23 14 1.6 0.999 1.3 2.1
12 1 7 3 2.4 0.999 0.3 0.6
TB: tuberculosis; RR: relative risk. *Percentage of the total population in the city living in the cluster. **Percentage of the total number of cases in the city that occurred within the cluster.
DISCUSSION
The reduction in TB incidence in Olinda over two decades is in accordance with the behavior of the disease throughout Brazil as a whole(20). Between 1990 and 2010, while there was a 3.2% decrease per year in incidence rate across the country(20), but in Olinda, this proportion was 1.7%. During the 20-year period
analyzed, only about 100 cases have been avoided.
If we consider the country as a whole, the improvements
observed through some tuberculosis indicators are in line with the advances made in healthcare management(21). Municipalization, decentralization of actions and services, and
strengthening of primary health care through the Family Health
Strategy were some outstanding features of the 1990s. In the 2000s, TB was considered a priority in the National Policy of
Primary Healthcare(22). This was true at a federal level, with the creation of the Secretariat of Health Surveillance(23), and the PNCT underwent reforms that beneited the integration of
With so many advances, the disconcerting question,
Why have strategies that have proved eficient for the country as a whole been unsuccessful in attaining the required magnitude of effects on TB indicators in the city of Olinda? remains. The differences observed between Olinda and the rest of the country suggest that this improvement occurs with different intensities, possibly due to inequalities between municipalities and intramunicipal scales.
The TB situation within the municipality not only emphasizes the need to optimize the strategies already in place but also to adopt others that are able to harness data that go beyond those inherent to the health sector and may explain the occurrence of the disease, such as territory-based surveillance. This approach could provide support for planning and executing actions at
different levels, thus positively inluencing TB indicators. There was an insigniicant trend in mortality reduction. In
2010, mortality exceeded double the state and was more than
three times the national average. However, these indings may
not only be describing the poor prognosis in the city, as they
may have been inluenced by SIM quality improvement during
the two decades analyzed(17) (24) (25). This justiication does not reduce the importance of implementing a mortality surveillance system that examines routine relationships between databases,
home, and hospital; forms of a multidisciplinary technical group
to discuss death and partnerships, such as civil society, and controls programs for sexually transmitted disease- acquired
immunodeiciency syndrome (STD/AIDS) and viral hepatitis. The higher proportion of male patients is consistent with
indings in the current literature, with a possible cultural and
social determination related to exposure(1) (26) (27) (28). Biological factors should also be considered, since there are generally
signiicant sexual differences between respiratory tract infection
(RTI) development and outcomes(29). Males appear to suffer from most commonly forms of RTI, and also they usually experience a more severe disease course with higher mortality rates(29) (30).
Being aware that only 5% to 10% of individuals who are exposed
to Mycobacterium tuberculosis develop TB and that up to 70% of people who develop the disease are male(29), researchers should be encouraged to investigate in greater depth the manner in which genetic variations and steroid hormones, for example,
differentially inluence disease susceptibility between the sexes. In terms of age, over 60% of cases involved patients who were between 20 and 49 years old, although there was a high incidence in those aged 50 years or older. Awareness that this population group
is more sensitive to TB reactivation owing to lower immunity while they have higher occurrences of chronic diseases, the Tuberculosis Control Program needs to be linked to disease surveillance programs, health care programs for the elderly in order to minimize adverse outcomes. On the other hand, a reduction in cases involving patients who are less than 20 years old may indicate a reduction in active transmission and recent infection.
In the present study, 45% of patients reported that they received
up to eight years of schooling, including the illiterate(25) (31) (32). Low
levels of education relect a set of poor socioeconomic conditions
that increase vulnerability to TB and consequently the increase disease incidence, while lowering adherence to treatment(32).
Information quality is directly related to the completeness
of notiication and monitoring tools. The present study revealed that the notiication forms supplied to Sinan have become more
thorough, now including variables such as race/color. This advancement, however, requires caution when interpreting data,
since it is not possible to afirm, for example, that in Olinda there was an increase in notiications from the black community. It is
probable that this increase was caused by improved registration, and not necessarily by a change in disease.
Tuberculosis can affect a number of organs and systems,
with the pulmonary form, which in Brazil is detected in 85% of patients aged 15 years and over, being the most common. In
Olinda, the mean ratio of this form is similar to that recorded for the entire country. More often than not, pulmonary bacillary TB are relevant to public health since they maintain the transmission chain of the disease(16).
High proportions of pulmonary TB in a community justify
the need for the sputum smear – a simple and safe method that should be performed by all public health laboratories and authorized private laboratories. When performed properly, the
test is able to detect between 60-80% of pulmonary TB cases(16). Over the 20-year period, a mean 70% of patients notiied during the ive-year periods performed the test. Throughout all of Brazil, this ratio varied from 76.4% to 85.3%(16) (33) (34) (35).
Due to its importance, the sputum smear should be encouraged, along with other features, such as those offered by the GeneXpert system, which allows the simultaneous detection of Mycobacterium tuberculosis and rifampicin resistance testing using sputum(36). A systematic review involving 18 studies
and 10,224 biological specimens demonstrated that a single
Xpert Mycobacterium tuberculosis (MTB) DNA and resistance to rifampicin (RIF) test detected 90.4% of pulmonary TB cases
(98.7% smear-positive and 75% smear-negative)(37).
In pulmonary cases with negative sputum smears, sputum culture can increase bacteriological diagnosis of the disease by
up to 30%(16). Given this importance, there has been a modest increase in performing sputum culture performance from 4.3% to 7%.
During the two decades, HIV testing increased signiicantly. However, in 41.5% of the cases, tests were either not performed,
or they were performed but results were still in progress. In Brazil, testing is still insubstantial, and in a number of localities the frequency of patients who do not undergo the test is over
80%(38). The low proportion of HIV testing and culture may relect dificulties in laboratory access, delays in receiving
results, lost tests, or even a lack of updated information systems. Given the estimations in Olinda of patients coinfected with TB
and HIV, both the efforts of professionals who serve patients
and the validity of information are jeopardized due to these
structural laws.
In Brazil, TB is approximately 30 times more common in people living with HIV, compared to the incidence in the general
population(39). Hence, the Ministry of Health recommends that
HIV testing be mandatory for patients with detected cases of
treatment is able to reduce mortality by over 50%(40). Thus,
the high numbers of unperformed blood tests or of those still in progress jeopardizes the timely initiation of treatment and hinders the structuring of public health plans in order to prevent
and reduce deaths from TB-HIV.
With regard to case outcomes, during the two decades, a cure
rate of 60.2% was identiied, reaching a maximum of 67.1% in the last ive-year period, although the rate was still below the 85% recommended by PNCT(41). Throughout the entire period, treatment abandonment and deaths remained at 10%. The
abandonment of treatment not only affects the rising treatment costs, but it also affects mortality rates and disease recurrence, while facilitating the selection of resistant strains(42) (43).
However, similar to occurrences in other Brazilian
cities(28) (34) (35), case outcome analysis is hampered by the high
(19.3%) percentage of cases where circumstances at the end of treatment were classiied as ignored, transferred, or changed treatment, thus suggesting failings in appropriate patient monitoring
by the health team or insuficient low of existing information.
In relation to the spatial analysis method used, it should be highlighted that the differential of this method lies in the manner with which it characterizes the relevant cluster according to the exposed population and the concentration of cases in relation to the total within the municipality. Contrary to misgivings concerning the use of grouping sectors with low incidence levels to generate clusters(44), this was not an issue in the present analysis.
The adopted cluster sizes grouped up to a maximum of 5% of
the exposed population with the territory analysis characteristics, such as the distribution of cases and the exposed population. Demarcation of the problem based on census tracts has enabled us to view the heterogeneous distribution of the disease in urban areas,
thus enabling intervention planning aimed at speciic groups(9). Although there has been a reduction in incidence in Olinda, it was nonetheless small. In addition to this, particularly when
the irst and second decades are compared, cluster spatial distribution reveals that, groups with statistical signiicance higher than p-value <0.05 accounted for a smaller proportion
of cases and were composed of a smaller number of sectors. On the other hand, over the years, the cases were spread across the territory of Olinda, but, nonetheless, they still persisted in areas with greater social needs, an association that is widely described in the literature(4) (7) (8) (9) (10) (45) (46) (47) (48) (49). Other factors may also
have inluenced this spreading, such as the common acquisition
of the illness outside the home or the largest proportion of cases associated with reactivation, which was common for over
50 years. As described by Souza et al.(9), characteristics related to tuberculosis control programs, such as those in regions with households having more than one new case or retreatment cases may also be related to a greater number of cases in a given area.
In order to better understand how this spatial distribution develops, studies should be encouraged that, amongst other things, address two questions: 1) Could primary care expansion
in the City of Olinda, during the studied decades, have inluenced higher TB detection levels? and 2) Could the apparent change in
the disease distribution proile be related to a possible increase in TB/HIV coinfection?
Finally, it is important to consider that there may be characteristics directly resulting from the disease control program associated with a higher TB incidence, such as cases of additional treatment and families with two or more affected persons in the same household(8). This report reveals that the incorporation of mapping within routine health surveillance, along with periodic updates of the associated factors, may contribute to the organization of health services. On the other hand, it reinforces the greater responsibility that health services have to face with controlled actions that are able to impact disease incidence.
After a 20-year period, despite a reduction in incidence and a downward trend in mortality, TB rates in Olinda are higher than the mean rates of the state and the country as a whole. The low number of smear tests and sputum cultures indicate that the available technologies are underutilized. The high percentage
of HIV tests in progress exempliies the fragile feedback of the information system, and it hinders the estimates of TB-HIV
co-infection in the city as well as planning based on the main instrument for decision making.
Analysis of the spatial distribution of cases demonstrated that relevant clusters remained in the same regions during the two decades, which not only indicates that these areas presented similar socioeconomic characteristics during the period, but it also indicates that the actions to control the disease need to be optimized and made more appropriate for this extremely vulnerable population group.
REFERENCES
The authors declare that there is no conlict of interest. CONFLICT OF INTEREST
1. World Health Organization. Global Tuberculosis Control:
Epidemiology, Strategy, Financing. WHO report 2009.
2. Ministério da Saúde, Secretaria de Vigilância em Saúde. Brasil.
Programa Nacional de Controle da Tuberculose. 2013. (acessado em 2014 20 agosto). Disponível em http://portal.saude.gov.br/ portal/saude/proissional/area.cfm?id_area=1527.
3. Boccia D, Hargreaves J, De Stavola BL, Fielding K, Schaap A, Godfrey-Faussett P, et al. The Association between Household
Socioeconomic Position and Prevalent Tuberculosis in Zambia:
A Case-Control Study. PLoS ONE 2011; 6:e20824.
4. Harling G, Castro MC. A spatial analysis of social and economic determinants of tuberculosis in Brazil. Health Place 2013; 25:56-67. 5. Albuquerque MFPM, Batista JL, Ximenes RAA, Carvalho MS,
Diniz GTN, Rodrigues LC. Risk factors associated with death in patients who initiate treatment for tuberculosis after two different
follow-up periods. Rev Bras Epidemiol 2009; 12:513-522.
6. de Alencar Ximenes RA, de Albuquerque MFPM, Souza WV, Montarroyos UR, Diniz GTN, Luna CF, et al: Is it better to be
rich in a poor area or poor in a rich area? a multilevel analysis
of a case-control study of social determinants of tuberculosis.
Int J Epidemiol. 2009; 38:1285-1296.
tuberculosis risk areas in a city of northeastern Brazil. Rev Panam
Salud Publica 2000; 8:403-410.
8. Souza WV, Albuquerque MFM, Barcellos CC, Ximenes RAA, Carvalho MS. Tuberculosis in Brazil: construction of a territorially
based surveillance system. Rev Saude Publica 2005; 39:82-89.
9. Souza WV, Carvalho MS, Albuquerque MF, Barcellos CC,
Ximenes RA. Tuberculosis in intra-urban settings: a Bayesian
approach. Trop Med Int Health 2007; 12:323-330.
10. Lapa T, Ximenes R, Silva NN, Souza W, Albuquerque MFM, Campozana G. Leprosy surveillance in Olinda, Brazil, using
spatial analysis techniques. Cad Saude Publica 2001; 17:1153-1162.
11. Braga C, Ximenes RAA, Albuquerque MFPM, Souza
WV, Miranda J, Brayner F, et al. Evaluation of a social and environmental indicator used in the identiication of lymphatic ilariasis transmission in urban centers. Cad Saude Publica 2001; 17:1211-1218.
12. Instituto Brasileiro de Geograia e Estatística (IBGE). Censo
Demográico 2010. Resultados da amostra. 2012. 1–203. (Acessado em 13 de dezembro de 2012). Disponível em: http://www.
censo2010.ibge.gov.br.
13. Silva Jr JB. Diferenciais intra urbanos de saúde em Olinda-PE.
Dissertação (Mestrado em Saúde Coletiva) - Universidade Estadual
de Campinas. São Paulo, 1995. 119 l. Disponível em: http://www. bibliotecadigital.unicamp.br/document/?code=vtls000095241 (1995). Acessado em 13 de dezembro de 2012.
14. Secretaria Estadual de Saúde. Pernambuco. Banco de dados do Sistema Único de Saúde - DATASUS. Informações de Saúde,
Sistema Nacional de Agravos de Notiicação. Tuberculose, Olinda. 2014.
15. Ministério da Saúde. Banco de dados do Sistema Único de Saúde - DATASUS. Brasil. Informações de Saúde, Sistema de Informações
sobre Mortalidade. (Acessado em 2014 28 de outubro) Disponível
em http://tabnet.datasus.gov.br/cgi/deftohtm.exe?sim/cnv/obt10PE. def
16. Ministério da Saúde, Secretaria de Vigilância em Saúde: Manual e recomendações para o controle da tuberculose no Brasil. Brasil. 2011.
17. Sousa MGG, Andrade JRSA, Dantas CF, Cardoso MD. Deaths
investigation for tuberculosis in Metropolitan Region of Recife (PE), registered in the Brazilian Mortality Information System,
between 2001–2008. Cad Saude Colet 2012; 20:153-160.
18. Kulldorff M. Information management services. Software for the
spatial and space-time scan statistics. 2010. (Acessado em 2014 01 de setembro). Disponível em http://www.satscan.org.
19. Instituto Nacional de Pesquisas Espaciais (INPE). TerraView
4.2.2. 2013. (Acessado em 2014 01 de setembro) Disponível em
http://www.dpi.inpe.br/terraview/index.php.
20. Guimarães RM, Lobo AP, Siqueira EA, Borges TFF, Melo SCC.
Tuberculosis, HIV, and poverty: temporal trends in Brazil, the Americas, and worldwide. J Bras Pneumol 2012; 38:511-517.
21. Barreto ML. Esboços para um cenário das condições de saúde
da população brasileira 2022/2030. In: Fundação Oswaldo Cruz.
A saúde no Brasil em 2030 - prospecção estratégica do sistema de saúde brasileiro: população e peril sanitário [online]. Rio de Janeiro: Fiocruz/Ipea/Ministério da Saúde/Secretaria de Assuntos Estratégicos da Presidência da República 2013; vol. 2. p. 97-120.
22. Ministério da Saúde, Secretaria de Atenção à Saúde: Política Nacional de Atenção Básica. Brasil. 2012.
23. Hijjar MA, Gerhardt G, Teixeira GM, Procópio MJ. Retrospect of tuberculosis control in Brazil. Rev Saude Publica 2007; 41:50-58.
24. Oliveira GP, Pinheiro RS, Coeli CM, Barreira D, Codenotti SB. Mortality information system for identifying underreported cases
of tuberculosis in Brazil. Rev Bras Epidemiol 2012; 15:468-477. 25. Oliveira, PB. Fatores associados ao abandono de tratamento
da tuberculose nos municípios considerados prioritários para o
desenvolvimento das ações do Programa Nacional de Controle da Tuberculose no Brasil. Dissertação de Mestrado em Medicina
Tropical. Brasília. Universidade de Brasília. 2013. 156 l.
26. Sociedade Brasileira de Pneumologia e Tisiologia. III diretrizes para tuberculose da Sociedade Brasileira de Pneumologia e
Tisiologia. J Bras Pneumol 2009; 35:1018-1048.
27. Melo TEMP, Resendes APC, Souza-Santos R, Basta PC. Spatial and temporal distribution of tuberculosis in indigenous and non-indigenous of Rondônia State, Western Amazon, Brazil.
Cad Saude Publica 2012; 28:267-280.
28. Pereira JC, Silva MR, Costa RR, Guimarães MDC, Leite ICG.
Proile and follow-up of patients with tuberculosis in a priority city in Brazil. Rev Saude Publica 2015; 49:1-12.
29. Neyrolles O, Quintana-Murci L. Sexual Inequality in Tuberculosis.
PLoS Med 2009; 6:e1000199.
30. Falagas ME, Mourtzoukou EG, Vardakas KZ. Sex differences in
the incidence and severity of respiratory tract infections. Respir
Med 2007; 101:1845-1863.
31. Garrido MS, Penna ML, Perez-PorcunaTM, de SouzaAB, Marreiro LS, AlbuquerqueBC, et al. Factors associated with tuberculosis treatment default in an endemic area of the Brazilian Amazon: a
case control-study. PLoSOne 2012; 7:e39134.
32. Mascarenhas MDM, Araújo LM, Gomes KRO. Epidemiological proile of tuberculosis among notiied cases in the Municipality of Piripiri, Piauí State, Brazil. Epidemiol Serv Saude 2005; 14:7-14. 33. Paixão LMM, Gontijo ED. Proile of notiied tuberculosis cases
and factors associated with treatment dropout Rev Saude Publica
2007; 41:205-213.
34. Coelho DMM, Viana RL, Madeira CA, Ferreira LOC, Campelo V.
Epidemiological Features of Tuberculosis in the City of Teresina, Piaui
State, Brazil, from 1999 to 2005. Epidemiol Serv Saude 2010; 19:33-42. 35. Xavier MIM, Barreto ML. Tuberculosis in Salvador, Bahia, Brazil,
in the 1990s. Cad Saude Publica 2007; 23:445-453.
36. Evans CA. GeneXpert--a game-changer for tuberculosis control? PLoS Med 2011; 8:e1001064.
37. Chang K, Lu W, Wang J, Zhang K, Jia S, Li F, et al. Rapid and effective diagnosis of tuberculosis and rifampicin resistance with
Xpert MTB/RIF assay: a meta-analysis. J Infect 2012; 64:580-588. 38. Silva HO, Gonçalves MLC. Coinfecção tuberculose e HIV nas
capitais brasileiras: observações a partir dos dados do sistema de
informação de agravos de notiicação. Rev Bras Prom Saude 2009; 22:172-178
39. Secretaria de Vigilância em Saúde, Ministério da Saúde. Especial tuberculose. Boletim Epidemiológico 2012; 43:1-12.
40. Abdool Karim SS, Naidoo K, Grobler A, Nesri Padayatchi MB,
Cheryl Baxter M, Andrew Gray M, et al. Timing of initiation of
antiretroviral drugs during tuberculosis therapy. N Engl J Med 2010; 362:697-706.
41. Ministério da Saúde. Secretaria de Vigilância em Saúde. Guia de Vigilância em Saúde. Brasília: Ministério da Saúde, 2014. 42. Maruza M, Albuquerque MFPM, Coimbra I, Moura LV,
Montarroyos UR, Miranda Filho DB, et al. Risk factors for default
from tuberculosis treatment in HIV-infected individuals in the
state of Pernambuco, Brazil: a prospective cohort study. BMC
43. Santos J. Brazilian response to tuberculosis control. Rev Saude Publica 2007; 41:89-93.
44. Beato Filho CC, Assunção RM, Silva BFA, Marinho FC, Reis
IA, Almeida MCM. Homicide clusters and drug trafic in Belo Horizonte, Minas Gerais State, Brazil from 1995 to 1999. Cad Saude Publica 2001; 17:1163-1171.
45. San Pedro A, Oliveira RM. Tuberculosis and socioeconomic indicators: systematic review of the literature. Rev Panam Salud
Publica 2013; 33:294-301.
46. Li X-X, Wang L-X, Zhang J, Liu Y-X, Zhang H, Jiang S-W,
et al. Exploration of ecological factors related to the spatial
heterogeneityof tuberculosis prevalence in P. R. China Glob Health Action 2014; 7:1-12.
47. Cardenas REN. Análise da distribuição especial da tuberculose no
Distrito Federal, 2003-2007. Dissertação de Mestrado em Ciências da Saúde. Brasília. 2010. 109 l.
48. Vendramini SHF, Santos NSGM, Santos MLSG,
Chiaravalloti-Neto F, Ponce MAZ, Gazetta CE, et al. Spatial analysis of
tuberculosis/HIV coinfection: its relation with socioeconomic
levels in a city in south-eastern Brazil. Rev Soc Bras Med Trop
2010; 43:536-541.
49. Jamal LF, Moherdaui F. Tuberculosis and HIV infection in Brazil:
magnitude of the problem and strategies for control. Rev Saude