INTRODUCTION
Corresponding author: Dra. Lisiane Tuon. Programa de Residência
Multiprofi ssional em Saúde Coletiva/UNASAU/UNESC. Av. Universitária 1105, Bairro Universitário, 88803-110 Criciúma, Santa Catarina, Brasil.
Phone: 55 48 3431-2500 e-mail: [email protected]
Received 9 July 2015 Accepted 22 September 2015
Incidence of hepatitis C in Brazil
Juliét Silveira Hanus
[1],
Luciane
Bisognin Ceretta
[1],[2],[3],
Priscyla Waleska Simões
[1],[2],[3]and
Lisiane Tuon
[1],[2],[3][1]. Programa de Residência Multiprofi ssional em Saúde Coletiva, Unidade Acadêmica de Ciências da Saúde, Universidade do Extremo Sul Catarinense, Criciúma, Santa Catarina, Brasil. [2]. Programa de Pós-Graduação em Saúde Coletiva, Unidade Acadêmica de Ciências da Saúde, Universidade do Extremo Sul Catarinense, Criciúma, Santa Catarina, Brasil. [3]. Grupo de Pesquisa em Gestão do Cuidado, Integralidade e Educação na Saúde, Unidade Acadêmica de Ciências da Saúde, Universidade do Extremo Sul Catarinense, Criciúma, Santa Catarina, Brasil.
ABSTRACT
Introduction: Hepatitis C is a public health problem of global dimensions, affecting approximately 200 million people worldwide.
The main objective of this study was to estimate the incidence rate of hepatitis C in Brazil during the period between 2001 and 2012. Methods: An epidemiological, temporal, and descriptive study was performed using data from the Information System
for Reportable Diseases. Results: Between 2001 and 2012, a total of 151,056 hepatitis C cases were recorded, accounting for
30.3% of all hepatitis notifi cations in Brazil. The average gross coeffi cient for the analysis period was 6.7 new cases per 100,000 inhabitants. The regions with the highest rates were the Southeast region (8.7 new cases/100,000 inhabitants) and the South (13.9 new cases/100,000 inhabitants). There was a predominance of men with respect to the incidence rate (8.0 new cases/100,000 inhabitants) compared to women (5.5 new cases/100,000 inhabitants). Injection drug use was the most common source of infection, and members of the white race, residents of urban areas, and those aged 60 to 64 years had the highest incidences.
Conclusions: Over the last 10 years, the incidence of hepatitis C in Brazil has increased, mainly in the South and Southeast.
The adoption of fast, accurate diagnostic methods, together with epidemiological awareness, can facilitate early intervention measures for adequate control of the disease.
Keywords: Brazil. Epidemiology. Hepatitis C. Incidence rate.
Hepatitis C is a worldwide public health concern. It is estimated that 3% of the global population is infected by the virus, corresponding to approximately 200 million
people(1) (2). This is 5 times the rate of infection with human
immunodefi ciency virus (HIV)(3). In Brazil, it is estimated between 2.5% and 4.9% of the population is infected with hepatitis C virus(4).
The prevalence of hepatitis C is low, at 0.5-2%, in most European countries, and 0.2-0.5% in the Americas, Australia, and South Africa. A higher prevalence rate is reported in the Middle East, India, and Brazil; Egypt has had the highest prevalence of hepatitis C in the world in recent years, corresponding to approximately 20% of the population(5). Hepatitis C is caused by infl ammation of the liver due to infection by hepatitis C, resulting in acute hepatitis. Its presentation is often subclinical, and it may develop into a chronic condition(6). Progression to
the acute chronic stage occurs in approximately 85% of cases, and 70% of individuals develop chronic liver pathologies(7). Approximately 80 million people live with chronic hepatitis C, and in 2013, it was estimated that 700,000 people died of hepatitis C worldwide(8).
Hepatitis C result in high morbidity and mortality, with serious comorbidities and high costs of treatment. Furthermore, infected individuals develop chronic forms of the disease and may develop complications such as cirrhosis, hepatocellular carcinoma, hepatic steatosis, or fibrosis(9) (10). Some data suggest that approximately 500,000 deaths per year worldwide are caused by such complications(11), which can also cause a signifi cant reduction in the quality of life and well-being of affl icted individuals(12).
Worldwide, the most common route of transmission of hepatitis C virus is intravenous drug use (IDU)(13). In Brazil, the main risk factors additionally include invasive therapies with contaminated equipment(14). Other risk factors for hepatitis C include perinatal infection, sexual transmission, and activities involving potential exposure to blood, such as tattooing and
piercing(15). Moreover, the residual risk of transmission during the
immunological window period cannot be ignored(16). No vaccine against hepatitis C is available, and treatment for hepatitis C varies according to the characteristics of each individual(17).
RESULTS
DISCUSSION METHODS
This investigation was a temporal, descriptive, and epidemiological study that was approved by the Ethics Committee for Research Involving Human Subjects (protocol number 924,172/2014). We used the tenth edition of the International Statistical Classifi cation of Diseases and Related Health Problems (CID 10) to search for diseases coded B18.2, representing viral hepatitis C.
The study population consisted of all hepatitis C patients recorded in the Information System of Reportable Diseases of the Ministry of Health (SINAN/MS) during the period between 2001 and 2012 in Brazil. Population data were obtained from a census conducted by the Brazilian Institute of Geography and Statistics (IBGE). Patient data were compiled for the years 2001-2012 as that was the time period for which there were available notifi cations of hepatitis C in the SINAN/MS, as provided by the Department of Informatics of the Unifi ed Health System (DATASUS).
Ages were stratifi ed according to the following groups adopted by SINAN/MS(18): under 1 year; 1 to 4, 5 to 9, 10 to 14, 15 to 19, 20 to 39, 40 to 59, 60 to 64, 65 to 69, and 70 to 79 years; and 80 years or older. Both men and women were included in the study. Zones of residence were categorized into peri-urban/ rural and urban. Schooling was stratifi ed according to the years of study: none, 1 to 3 years, 4 to 7 years, 8 to 11 years, and 12 or more years completed. All 26 Brazilian states plus the Federal District were included in the study, in addition to the fi ve regions of Brazil: North, Northeast, Southeast, South, and Midwest. Concerning race/skin color, we used the following categories adopted by SINAN/MS(18): white, black, brown, yellow, and indigenous. Furthermore, the following classifi cations were used for source of infection: sex, IDU, transfusion, mother-to-child transmission, and industrial accidents.
Due to differences in categories used by the SINAN/MS prior to 2007 versus from that year on, we decided to combine the records associated with rural and peri-urban zones. There were also differences in categories related to schooling, and we chose to classify illiterate individuals under none in terms
of years of study completed; those who began a particular year in the next-higher range category but did not complete it were classifi ed in the lower-range category of years completed (e.g., those who had started 4th grade without completing it were included in the 1 to 3 years completed category.
The absolute and relative frequencies of all variables were determined. The crude incidence coeffi cient was calculated by dividing the number of reported cases by the resident population in the same place and time and multiplying the result by 100,000. We calculated the proportional incidence coefficient and standardized it according to the federative unit, region, residential area, sex, and age because these variables represented available data in both the SINAN/MS and IBGE.
Access to the SINAN/MS and tabulation of the data were achieved using the TabNet software (DATASUS, Brasília,
Distrito Federal, Brazil), available online at the DATASUS web site (http://datasus.saude.gov.br/). The indicators were calculated using Excel 2013 (Microsoft Corp., Redmond, Washington, United States) and statistical analysis was performed with the Statistical Package for the Social Sciences (SPSS) version 22.0 (IBM, Armonk, New York, United States) and Tab Win version 3.6 (DATASUS, Brasília, Distrito Federal, Brazil).
During the period between 2001 and 2012, 151,056 hepatitis C incidences were recorded in Brazil. The average gross coeffi cient for this period was 6.7 new cases per 100,000 inhabitants, with a gradual increase in rates being observed until 2004, and some fl uctuations occurring in later years.
Descriptive profi les of the studied population are shown in Tables 1 and 2. The Brazilian state showing the highest
average coeffi cient for hepatitis C was Rio Grande do Sul (21.3 new cases/100,000 inhabitants), followed by Acre (17.7 new cases/100,000 inhabitants), Santa Catarina (12.7 new cases/100,000 inhabitants) and São Paulo (12.2 new cases/100,000 inhabitants), while the lowest rates were found in the States of Piauí (0.5 new cases/100,000 inhabitants) and Pará (0.9 new cases/100,000 inhabitants).
The geographic regions with the greatest average coeffi cients were the Southern and Southeast regions (13.9 and 8.7 new cases/100,000 inhabitants, respectively). The lowest average coeffi cient was found in the Northeast (1.7 new cases/100,000 inhabitants) (Figure 1). The residence zone that showed
the higher average coeffi cient was the urban zone (6.3 new cases/100,000 inhabitants), while the rural and peri-urban areas accounted for an average of 0.3 new cases/100,000 inhabitants. Furthermore, there was a predominance of new cases of hepatitis C in men, who showed an average coeffi cient of 8.0 new cases/100,000 inhabitants, while women had an average coeffi cient of 5.5 new cases/100,000 inhabitants (Figure 2).
Figure 3 shows that the racial category with the predominant
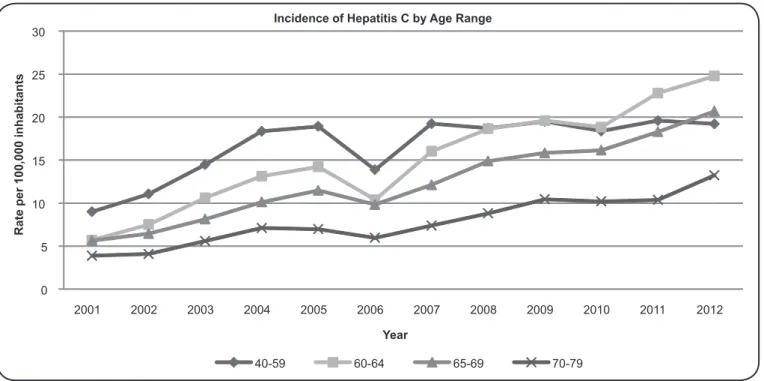
incidence rate was that of white individuals, representing 70.3% (n=84,230) of new cases, followed by brown individuals (21%; n=26,816). Upon analysis by age, the 40 to 49 years age group average coeffi cient of hepatitis C predominated (16.7 new cases/100,000 inhabitants), followed by the 60 to 64 years group (15.2 new cases/100,000 inhabitants).
The most common source of infection was hypodermic needles used for injection drugs, corresponding to 46.1% (n=57,358) of new cases, followed by blood transfusion, which increase up to the year 2006 and declined in later years, accounting for an average of 22.5% (n=15,203) of new hepatitis C cases.
TABLE 1 - Descriptive profi le of the population - proportional.
Variable
2001-2003 2004-2006 2007-2009 2010-2012 2001-2012
Total n=25,028 n=37,302 n=43,039 n=45,687 n=151,056
n % n % n % n % n %
Region
North 979 4.0 1,003 2.7 1,370 3.2 1,607 3.5 4,959 3.3 Northeast 1,529 6.1 2,371 6.4 2,952 6.8 3,550 7.7 10,402 6.8 Southeast 13,000 51.3 20,537 54.9 25,087 58.4 24,180 53.0 82,804 54.4 South 7,883 31.9 11,358 30.6 11,506 26.7 14,456 31.6 45,203 30.2 Midwest 1,637 6.7 2,033 5.4 2,124 4.9 1,894 4.1 7,688 5.3
Sex
man 15,595 62.5 22,330 59.8 24,903 57.9 25,405 55.7 88,233 59.0 woman 9,419 37.5 14,971 40.2 18,128 42.1 20,264 44.3 62,782 41.0
Area of residence
urban 23,621 97.6 34,853 96.6 40,214 96.6 42,427 96.4 141,115 96.8 peri-urban 585 2.4 1,220 3.4 1,405 3.4 1,597 3.6 4,807 3.2
Age group (years)
< 1 100 0.4 170 0.5 180 0.4 247 0.5 697 0.5
1 to 4 53 0.2 70 0.2 56 0.1 43 0.1 222 0.2
5 to 9 80 0.3 114 0.3 68 0.2 51 0.1 313 0.2
10 to 14 93 0.4 94 0.2 115 0.3 86 0.2 388 0.3
15 to 19 430 1.8 530 1.4 396 0.9 404 0.9 1,760 1.3 20 to 39 9,859 39.7 12,846 34.3 11,661 27.1 10,226 22.4 44,592 30.9 40 to 59 11,626 46.2 18,959 50.9 23,541 54.7 24,940 54.6 79,066 51.6 60 to 64 1,151 4.5 1,956 5.2 3,176 7.4 4,358 9.5 10,641 6.7 65 to 69 760 3.0 1,276 3.5 1,908 4.4 2,690 5.9 6,634 4.2 70 to 79 660 2.6 1,067 2.9 1,562 3.6 2,149 4.7 5,438 3.5 ≥ 80 195 0.8 201 0.5 350 0.8 479 1.0 1,219 0.8
Race
white 10,427 75.4 22,685 72.4 25,920 68.2 25,198 65.2 84,230 70.3 black 958 6.6 2,378 7.6 2,936 7.7 3,331 8.6 9,603 7.6 yellow 115 0.9 256 0.8 322 0.8 317 0.8 1,010 0.8 mulatto 2,424 17.0 5,937 19.0 8,735 23.0 9,720 25.1 26,816 21.0 indigenous 16 0.1 42 0.1 97 0.3 83 0.2 238 0.2
Education (years)
none 494 3.0 727 2.7 511 1.7 604 2.0 2,336 2.3 1 to 3 1,651 9.2 3,320 12.1 3,397 11.1 3,504 11.6 11,872 11.0 4 to 7 7,270 43.8 10,205 37.1 9,478 30.9 9,453 31.3 36,406 35.8 8 to 11 5,286 30.8 9,288 33.8 7,569 24.7 6,421 21.2 28,564 27.6 ≥ 12 2,280 13.2 3,969 14.4 9,720 31.7 10,271 33.9 26,240 23.3
Source of infection
TABLE 2 - Descriptive profi le of the population according to rates (incidence per 100,000 individuals). Variable
2001-2003 2004-2006 2007-2009 2010-2012 2001-2012
n rate n rate n rate n rate n rate
Region
North 979 2.4 1,003 2.3 1,370 3.0 1,607 3.3 4,959 2.8 Northeast 1,529 1.0 2,371 1.5 2,952 1.9 3,550 2.2 10,402 1.7 Southeast 13,000 5.8 20,537 8.7 25,087 10.4 24,180 10.0 82,804 8.7 South 7,883 10.2 11,358 14.0 11,506 13.9 14,456 17.5 45,203 13.9 Midwest 1,637 4.5 2,033 5.2 2,124 5.2 1,894 4.4 7,688 4.8
Sex
man 15,595 6.0 22,330 8.2 24,903 8.9 25,405 9.0 88,233 8.0 woman 9,419 3.5 14,971 5.3 18,128 6.2 20,264 6.9 62,782 5.5
Area of residence
urban 23,621 4.5 34,853 6.3 40,214 7.0 42,427 7.3 141,115 6.3 peri-urban 585 0.1 1,220 0.3 1,405 0.3 1,597 0.3 4,807 0.3
Age group (years)
< 1 100 1.0 170 1.8 180 1.9 247 3.0 697 1.9
1 to 4 53 0.1 70 0.2 56 0.1 43 0.1 222 0.1
5 to 9 80 0.2 114 0.2 68 0.1 51 0.1 313 0.2
10 to 14 93 0.2 94 0.2 115 0.2 86 0.2 388 0.2
15 to 19 430 0.8 530 0.9 396 0.8 404 0.8 1,760 0.8 20 to 39 9,859 5.8 12,846 7.1 11,661 6.1 10,226 5.3 44,592 6.0 40 to 59 11,626 11.5 18,959 17.1 23,541 19.1 24,940 19.1 79,066 16.7 60 to 64 1,151 7.9 1,956 12.6 3,176 18.1 4,358 22.1 10,641 15.2 65 to 69 760 6.7 1,276 10.5 1,908 14.3 2,690 18.4 6,634 12.5 70 to 79 660 4.5 1,067 6.7 1,562 8.9 2,149 11.3 5,438 7.8 ≥ 80 195 3.4 201 3.0 350 4.3 479 5.3 1,219 4.0
Federative unit
Rondônia 147 3.4 245 5.3 192 4.1 137 2.9 721 3.9 Acre 321 18.2 321 16.2 378 18.3 402 18.0 1,422 17.7 Amazonas 267 3.0 101 1.1 276 2.7 555 5.2 1,199 3.0
Roraima 36 3.5 53 4.5 50 4.0 31 2.3 170 3.5
Pará 91 0.5 139 0.7 239 1.1 327 1.4 796 0.9
Amapá 41 2.6 60 3.4 108 5.8 73 3.6 282 3.8
Tocantins 76 2.1 84 2.1 127 3.2 82 1.9 369 2.4 Maranhão 125 0.7 306 1.7 459 2.4 523 2.6 1,413 1.9
Piauí 49 0.6 23 1.7 29 0.3 96 1.0 197 0.5
Ceará 259 1.1 363 1.5 370 1.5 400 1.6 1,392 1.4 Rio Grande do Norte 34 0.4 101 1.1 225 2.4 215 2.2 575 1.5
Paraíba 35 0.3 95 0.9 126 1.1 209 1.8 465 1.0
Pernambuco 443 1.8 549 2.2 443 1.7 596 2.2 2,031 2.0 Alagoas 141 1.6 122 1.4 168 1.8 142 1.5 573 1.6 Sergipe 88 1.6 108 1.8 135 2.2 175 2.8 506 2.1 Bahia 355 0.9 704 1.7 997 2.3 1,194 2.8 3,250 1.9 Minas Gerais 815 1.5 1,568 2.7 2,171 3.6 2,380 4.0 6,934 3.0 Espírito Santo 349 3.6 667 6.5 448 4.3 328 3.1 1,792 4.4 Rio de Janeiro 3,406 7.7 3,044 6.6 3,087 6.5 4,816 10.0 14,353 7.7 São Paulo 8,430 7.3 15,258 12.6 19,381 15.6 16,656 13.3 59,725 12.2 Paraná 1,139 3.9 2,333 7.6 2,378 7.5 2,806 8.9 8,656 7.0 Santa Catarina 1,411 8.5 2,644 15.0 2,403 13.2 2,693 14.2 9,151 12.7 Rio Grande do Sul 5,333 17.1 6,381 19.6 6,725 20.5 8,957 27.8 27,396 21.3 Mato Grosso do Sul 492 7.6 719 10.6 644 9.2 583 7.8 2,438 8.8 Mato Grosso 76 1.0 152 1.8 344 3.9 450 4.9 1,022 2.9 Goiás 765 4.9 636 3.8 578 3.3 389 2.1 2,368 3.5 Federal District 304 4.7 526 7.5 558 7.3 472 6.0 1,860 6.4
|-- 0.9 0.9 --| 1.9
1.9 --| 2.9
2.9 --| 3.9 3.9 --| 4.9
4.9 --| 5.9
5.9 --| 6.9 6.9 --| 7.9
7.9 --| 8.9
8.9 --| 21.3
Average
0 1 2 3 4 5 6 7 8 9 10
2001 2002 2003 2004 2005 2006 2007 2008 2009 2010 2011 2012
Rate per 100,000 inhabitants
Year
Incidence of Hepatitis C by Sex
Male Female
FIGURE 2 - Incidences of hepatitis C infection by sex.
0 5 10 15 20 25 30
2001 2002 2003 2004 2005 2006 2007 2008 2009 2010 2011 2012
Rate per 100,000 inhabitants
Year
Incidence of Hepatitis C by Age Range
40-59 60-64 65-69 70-79
FIGURE 3- Incidences of hepatitis C by age range. Numbers ranges indicate years old.
A review study reported in 2014 showed that the detection rate of hepatitis C in Brazil was 5 new cases per 100,000 inhabitants in 2011, with higher rates being observed in the South and Southeast regions corresponding to 8.5 and 7.4 new cases per 100,000 inhabitants, respectively(19). These fi ndings are consistent with our study. The burden of infection in Brazil,
organized(21). Another factor that could explain the high rates of hepatitis C in southern and southeastern Brazil is the high rate of IDU, as this factor presents a strong association with hepatitis C positivity(22). The northern region of the country is the location of the Amazon forest, as well as built-up areas, traditional indigenous populations, and a low population density; providing access to adequate medical care in these areas is diffi cult, and preventative measures are not very well accepted. Most urbanized areas, however, have better access to health programs and adoption of preventative measures; such areas are concentrated in the South and Southeast regions(23), and these factors may contribute to the higher rates of hepatitis C recorded in urbanized areas.
The reported cases of hepatitis C in Canada have decreased
in recent years(24) (25). In 2009, a survey investigated 11,357 cases
of hepatitis C among individuals who were documented in the Canadian Notifi able Disease Surveillance System, and revealed that the rate of new cases was 33.7 new cases per 100,000 inhabitants, whereas the rate in 2005 had been 40.5 new cases per 100,000 inhabitants(24) (25). In 2011, the rate of hepatitis C in the European Union was 7.9 new cases per 100,000 inhabitants, corresponding to 30,373 new cases reported that year(26). A study conducted in Italy between 1996 and 2006 estimated the trends in hepatitis C for different age groups using the joinpoint regression method. During this period, a total of 6,806 cases of hepatitis C were recorded, and a strong reduction in incidence rates was observed in all age groups, decreasing from 2.02 new cases per 100,000 inhabitants in 1996 to 0.55 new cases per 100,000 inhabitants in 2006(27). The opposite situation occurred in Brazil, as our fi ndings revealed an increase in the incidence rates of hepatitis C during our analysis period. This may be due to the underreporting of hepatitis C by some surveillance systems, which has been a topic of discussion in Europe and the United States(20).
A study developed in Poland sought to assess the epidemiological situation of hepatitis C in 2011 and compare it to previous years. A descriptive analysis was performed based on data extracted from the Compulsory Routine Surveillance System. It was found that in the years 2005-2009, the incidence of hepatitis C was 7.22 new cases per 100,000 inhabitants, while in 2011, the rate was 5.58 new cases per 100,000 inhabitants. It was further revealed that the rates were twice as high in urban areas compared to in the countryside (6.90 new cases per 100,000 inhabitants versus 3.54 new cases per 100,000 inhabitants, respectively). These fi ndings may have been infl uenced by access to diagnostic logs, as the lowest rates in the aforementioned study were recorded in rural areas, again revealing a predominance among men in relation to women (6.42 new cases per 100,000 inhabitants versus 4.80 new cases per 100,000 inhabitants, respectively)(28). These data are similar to ours. The signifi cantly lower incidence of hepatitis C in rural compared to urban populations might be explained by the lack of access to diagnostic tests; therefore, it may not be possible to determine the actual epidemiological situation in these regions(29).
According to an epidemiological study conducted in 2010, the incidence of hepatitis C in Europe in 2006 was 6.7 new cases per 100,000 inhabitants, with a predominance among men;
moreover, the 25-44 years age group was the most affected. In the Eastern Mediterranean region and in Southeast Asia, the incidence rates have also been found to be higher in men(30).
In a prospective cohort investigated between 2005 and 2011, the rate of hepatitis C was greater among men in the 40-59 year age group, while it was higher in women among younger people aged 15-24 years(13). Another 2014 survey that investigated the relationship between sex and hepatitis C revealed that hepatitis C disproportionately affects men. The study suggested that this difference was associated with the fact that women are more likely to eliminate the virus spontaneously and less prone to exhibit disease progression if they are chronically infected because of the protective function that estrogen exerts on hepatic cells(31).
An analytical, retrospective study conducted in São Paulo in 2010 showed that hepatitis C rates are higher in men; however, women had a higher incidence of adverse events. Consequently, changes in doses of treatment were higher among women; moreover, men and women responded differently to the same treatment. Women have specifi c characteristics that potentially affect the course and outcome of antiviral therapy. However, in spite of studies on the treatment of hepatitis C, little is known about the actual impact of sex on the characteristics that infl uence the effi cacy and safety of treatment for hepatitis C(32). In a cross-sectional, multicenter study that sought to assess the factors related to exposure to hepatitis C among adults who attended 26 randomly selected health service centers between the years 2005 and 2007, the results revealed that the main risk factors associated with hepatitis C include an age greater than 40 years and IDU; men were common in both categories. These data corroborate the fi ndings of our research(33).
Based on the Epidemiological Bulletin of Viral Hepatitis for the period between 1999 and 2010, hepatitis C detection rates were predominant in the brown race in the North, Northeast, and Center-West, and in the white race in the southeastern and southern regions. In this study, the white race was the most infected, which may be related to the European settlement of the southeastern and southern regions, where the incidence of hepatitis C was higher(34). However, these regions may have higher rates of compulsory reporting practices and better public health systems compared to northern regions. For instance, hemodialysis, hemotransfusion, surgery, and IDU are much more common in the southeast due to political and economical development.
In a retrospective study, higher rates of hepatitis C were found among adults aged 35 to 59 years with a low level of schooling(35). This investigation sought to estimate the rate of infection in individuals who attended the Veracruz State Blood Transfusion Center in Veracruz (Mexico) during the period between 2006 and 2010. These data are consistent with the fi ndings of our study.
Despite the major advances in techniques for the detection and prevention of hepatitis C, the number of patients undergoing dialysis treatments who are infected by this virus in Brazil has
increased in recent years(4). There are estimates indicating that
Patients undergoing hemodialysis are currently one of the main groups at risk for hepatitis C(4).
Currently, the most common route of transmission of hepatitis C is needle sharing during IDU(36). Approximately 50% to 90% of intravenous drug users are also positive for hepatitis C(37). These fi ndings are consistent with a study performed in Greece that followed hematology service facilities in the country during the years 1997-2006, and revealed that the vast majority of hepatitis C infected intravenous drug users were men with an average age of 33.7 years, and that hepatitis C had been acquired less than 20 years ago in one of every two such individuals. This study suggests that there will soon be a considerable increase in young patients with cirrhosis, liver failure, and hepatocellular
carcinoma(38).
Co-infection of individuals with hepatitis C virus and HIV is very common(39). Currently, up to 30% of all HIV-infected patients are involved in IDU, and 85% of intravenous drug users are infected with either HIV or hepatitis C virus. Because of the decline in national and global rates of mortality from AIDS, liver disease has become the leading cause of death in HIV-infected patients(39).
To summarize thus far, we can conclude that, in the last 10 years, the incidence of hepatitis C has increased in Brazil, mainly in the South and Southeast regions. Urban areas of the country present the highest rates of hepatitis C, and the highest incidences are observed in men, the white race, intravenous drug users, and those aged 60-64 years.
Although information from health information systems is a relevant source of secondary data, we suggest that attention be paid to the quality of the data recorded, particularly the reliability of the information and the completeness of the information. The reason for this is that information management in Brazil’s health information systems is still not performed in an orderly and systematic fashion, and any adopted initiatives are more reliable and robust in the South and Southeast of the country(40). It is important to develop further studies and conduct ongoing assessments of the quality of the data, and to press on all administrative offi cials to improve the quality of the available information regarding health indicators in Brazil(41).
On November 3, 2010, Decree 201 was enacted, which provides the parameters for monitoring the information provided to the SINAN and establishes that hepatitis C is a reportable disease. Although it is known that there are defi cits in completing all the fi elds of the notifi cation form, this has improved in recent years. The interpretation of the data recorded should take into account limitations, including the fact that they are based on secondary information from a passive surveillance system, and that the lack of completeness of information may lead to bias(42).
In some states, the doctor is obliged to provide a notifi cation number in order to record the hepatitis C quantifi cation results into the SINAN, and this could represent an important bias, as many doctors may not bother with this. However, even with the limitations mentioned, our study showed results that were consistent with the literature and that ought to be useful for supporting public policies, especially those related to service organization(42).
Hepatitis is a major problem for health service providers, because of not only its high incidence but also its negative impact on the quality of life of affected individuals. Thus, epidemiological surveillance is an important tool for improving the investigation and reporting of hepatitis C as well as determining the risk of infection and the profi le of infected patients, thus enabling the adoption of measures to prevent and control the spread of hepatitis C. Based on such knowledge, it is
possible to implement actions to promote guidance campaigns
as well as hasten the prevention, control, and diagnosis of hepatitis C. This may involve individual and/or collective efforts to provide up-to-date information that can contribute to the reduction of hepatitis C in the population. We also recommend that predictive models based on time series be used in future research.
REFERENCES
All authors declare that they have no confl icts of interest. CONFLICT OF INTEREST
1. Lokhande MU, Thimme R, Klenerman P, Semmo N. Methodologies for the Analysis of HCV-Specifi c CD4(+) T Cells. Front Immunol 2015; 6:57.
2. Uliana CV, Riccardi CS, Yamanaka H. Diagnostic tests for hepatitis C: recent trends in electrochemical immunosensor and genosensor analysis. World J Gastroenterol 2014; 20:15476-15491.
3. Layden JE, Phillips R, Opare-Sem O, Akere A, Salako BL, Nelson K, et al. Hepatitis C in sub-saharan Africa: urgent need for attention. Open Forum Infect Dis 2014; 1:ofu065.
4. Vidales-Braz BM, da-Silva NM, Lobato R, Germano FN, da-Mota LD, Barros EJ, et al. Detection of hepatitis C virus in patients with terminal renal disease undergoing dialysis in southern Brazil: prevalence, risk factors, genotypes, and viral load dynamics in hemodialysis patients. Virol J 2015;12:8.
5. Zaghloul H, El-Shahat M. Recombinase polymerase amplifi cation as a promising tool in hepatitis C virus diagnosis. World J Hepatol 2014;6:916-922.
6. Peres-da-Silva A, de-Almeida AJ, Lampe E. NS5A inhibitor resistance-associated polymorphisms in Brazilian treatment-naive patients infected with genotype 1 hepatitis C virus. J Antimicrob Chemother 2015;70:726-730.
7. Carneiro B, Braga AC, Batista MN, Harris M, Rahal P. Evaluation of canonical siRNA and Dicer substrate RNA for inhibition of hepatitis C virus genome replication--a comparative study. PLoS One 2015;10:e0117742.
8. Suthar AB, Harries AD. A public health approach to hepatitis C control in low- and middle-income countries. PLoS Med 2015;12:e1001795.
9. Manvar D, Fernandes TA, Domingos JL, Baljinnyam E, Basu A, T-Junior
EF, et al. Synthesis and biological evaluation of α-aryl-α-tetralone derivatives as hepatitis C virus inhibitors. Eur J Med Chem 2015; 93:51-54. 10. Vieira GD, Ventura CG, Sousa CM. Occurrence and spatial
distribution of hepatitis C in a Western Brazilian Amazon state. Arq Gastroenterol 2014; 51:316-319.
11. Jardim AC, Igloi Z, Shimizu JF, Santos VA, Felippe LG, Mazzeu BF, et al. Natural compounds isolated from Brazilian plants are potent inhibitors of hepatitis C virus replication in vitro. Antiviral
12. Friedman ND, Green JH, Weber HM, Stephen S, Lane SE, Ting AY, et al. Hepatitis C virus treatment in the 'real-world': how well do 'real' patients respond? J Clin Exp Hepatol 2014;4:214-220. 13. Puri N, DeBeck K, Feng C, Kerr T, Rieb L, Wood E. Gender
infl uences on hepatitis C incidence among street youth in a Canadian setting. J Adolesc Health 2014; 55:830-834.
14. Martins T, Narciso-Schiavon JL, Schiavon LL. Epidemiology of hepatitis C virus infection. Rev Assoc Med Bras 2011; 57:107-112. 15. Morais-de-Jesus M, Daltro-Oliveira R, Pettersen KM, Dantas-Duarte A, Amaral LD, Cavalcanti-Ribeiro P, et al. Hepatitis C virus infection as a traumatic experience. PLoS One 2014; 9:e110529. 16. Aman K, Al-Dubai SA, Aman R, Hawash A, Alshagga M, Kassim
S. Prevalence and associated factors of hepatitis C virus infection among renal disease patients on maintenance hemodialysis in three health centers in Aden, Yemen: a cross sectional study. Saudi J Kidney Dis Transpl 2015; 26:380-385.
17. Ventura GT, Costa EC, Capaccia AM, Mohana-Borges R. pH-dependent conformational changes in the HCV NS3 protein modulate its ATPase and helicase activities. PLoS One 2014; 9:e115941.
18. Ministério da Saúde (MS) (Internet). Sistema de Informação de Agravos de Notifi cação . Brasília (DF): MS. 2015 - (cited 2015 Jun 10). Available from: http://dtr2004.saude.gov.br/sinanweb/ index.php
19. Kretzer IF, do Livramento A, da-Cunha J, Goncalves S, Tosin I, Spada C, et al. Hepatitis C worldwide and in Brazil: silent epidemic--data on disease including incidence, transmission, prevention, and treatment. Scientifi c World Journal 2014; 2014:827849. 20. Pereira LM, Martelli CM, Moreira RC, Merchan-Hamman E, Stein
AT, Cardoso MR, et al. Prevalence and risk factors of hepatitis C virus infection in Brazil, 2005 through 2009: a cross-sectional study. BMC Infect Dis 2013; 13:60.
21. Victora CG, Barreto ML, do-Carmo Leal M, Monteiro CA, Schmidt MI, Paim J, et al. Health conditions and health-policy innovations in Brazil: the way forward. Lancet 2011; 377:2042-2053.
22. Brandao NA, Pfrimer IA, Martelli CM, Turchi MD. Prevalence of hepatitis B and C infection and associated factors in people living with HIV in Midwestern Brazil. Braz J Infect Dis 2015;19:426-430. 23. Naveira M, Barbosa J, Sereno L, Domanico A, Mesquita F,
de-Souza LA. 12 years of universal access to hepatitis C treatment: Brazil's comprehensive response. J Int Assoc Provid AIDS Care 2014;13:560-567.
24. Burchell AN, Gardner SL, Mazzulli T, Manno M, Raboud J, Allen VG, et al. Hepatitis C virus seroconversion among HIV-positive men who have sex with men with no history of injection drug use: Results from a clinical HIV cohort. Can J Infect Dis Med Microbiol 2015; 26:17-22.
25. Public Health Agency of Canada. Epidemiology of Acute Hepatitis C Infection in Canada-Results from the Enhanced Hepatitis Strain Surveillance System (EHSSS). Canada: PHAC; 2009.
26. European Centre for Disease Prevention and Control. Annual Epidemiological Report 2013-Reporting on 2011 Surveillance data and 2012 Epidemic Intelligence Data. Sweden: ECDC; 2013.
27. La Torre G, Gualano MR, Semyonov L, Nicolotti N, Ricciardi W, Boccia A. Hepatitis C Virus infections trends in Italy, 1996-2006. Hepat Mon 2011;11:895-900.
28. Rosinska M, Parda N, Stepien M. Hepatitis C in Poland in 2011. Przegl Epidemiol 2013; 67:247-251.
29. Parda N, Henszel L, Stepien M. Hepatitis C in Poland in 2012. Przegl Epidemiol 2014; 68:265-269.
30. Te HS, Jensen DM. Epidemiology of hepatitis B and C viruses: a global overview. Clin Liver Dis 2010;14:1-21.
31. Baden R, Rockstroh JK, Buti M. Natural history and management of hepatitis C: does sex play a role? J Infect Dis 2014; 209 (suppl III):81-85.
32. Narciso-Schiavon JL, Schiavon LL, Carvalho-Filho RJ, Sampaio JP, Batah PN, Barbosa DV, et al. Gender infl uence on treatment of chronic hepatitis C genotype 1. Rev Soc Bras Med Trop 2010;43:217-223.
33. Carmo RA, Campos LN, Melo AP, Guimaraes MD. Hepatitis C among patients with mental illness in Brazil: an analysis of associated factors. Gen Hosp Psychiatry 2013; 35:129-133. 34. Ministério Saúde. Secretaria de Vigilância Sanitária, Departamento
DST, Aids Hepatites Virais. Boletim epidemiológico: hepatites virais. Brasília (DF): Ministério da Saúde; 2012.
35. Lopez-Balderas N, Bravo E, Camara M, Hernandez-Romano P. Seroprevalence of hepatitis viruses and risk factors in blood donors of Veracruz, Mexico. J Infect Dev Ctries 2015; 9:274-282. 36. Khodabandehloo M, Roshani D. Prevalence of hepatitis C virus
genotypes in Iranian patients: a systematic review and meta-analysis. Hepat Mon 2014; 14:e22915.
37. Xiaoli W, Lirong W, Xueliang W, Jinsong L, Hengxin L, Wei J. Risk factors of hepatitis C virus infection in drug users from eleven methadone maintenance treatment clinics in Xi'an, China. Hepat Mon 2014;14:e19601.
38. Raptopoulou M, Touloumi G, Tzourmakliotis D, Nikolopoulou G, Dimopoulou M, Giannoulis G, et al. Signifi cant epidemiological changes in chronic hepatitis C infection: results of the nationwide HEPNET-GREECE cohort study. Hippokratia 2011; 15:26-31. 39. Laskus T, Kibler KV, Chmielewski M, Wilkinson J, Adair D,
Horban A, et al. Effect of hepatitis C infection on HIV-induced apoptosis. PLoS One 2013; 8:e75921.
40. Correia LOS, Padilha BM, Vasconcelos SML. Métodos para avaliar a completitude dos dados dos sistemas de informação em saúde do Brasil: uma revisão sistemática. Ciênc Saude Coletiva 2014; 19:4467-4478.
41. Lima EE, Queiroz BL. Evolution of the deaths registry system in Brazil: associations with changes in the mortality profi le, under-registration of death counts, and ill-defi ned causes of death. Cad Saude Publica 2014; 30:1721-1730.