Abstract—We present an adaptive approach for improving the performance in randomly distributed Wireless Sensor Networks (WSNs). The goal is to find the optimal routing not only to maximize the lifetime of the network but also to provide real-time data transmission services. Considering a wireless sensor network where the nodes have limited energy, we propose a novel model Energy
∗
Delay based on Ant Colony Optimization (ACO) algorithm (E&D ANTS) to minimize the time delay in transferring a fixed number of data from the source nodes to the destination nodes in an energy-constrained manner. In the algorithm, an amount of artificial ants randomly explored the network and exchanged collected network information to periodically update ant routing-tables which were obtained by having integrated partial pheromones and heuristic values. Our study is focused on influence functions of pheromones. Because of the tradeoff of energy and delay in wireless network systems, we propose the Reinforcement Learning (RL) algorithm to train our model. The simulation results show that our method boasts undoubtedly a number of attractive features, including adaptation, robustness and stability.Index Terms— ACO, Pheromones, Power consumption, Wireless sensor networks
I. INTRODUCTION
The wireless sensor networks (WSNs) technology is widely used in many fields, including environmental monitoring, health monitoring, military surveillance and earthquake observation. In the wireless systems, a lot of nodes operate on limited batteries while satisfying given throughput and delay requirements. So the development of low-cost and low-power sensor network system has received increasing attentions. Low power research is concentrated in the RF, Baseband, network, and application layers of wireless devices. A high performance routing algorithm is often a crucial part in network system, because good routing can contribute either greater throughput or lower average delays if all the other conditions being the same. In the paper, we propose two routing strategies. First of
Manuscript received March 12, 2007. This work was supported in part by the National Natural Science Foundation of China under Grant 30600143
Wen Yaofeng is with the State Specialized Laboratory of Biomedical Sensors, ZheJiang University, CO 310023, Hangzhou, China (phone: 86-0571-87951090; fax: 86-021-50273116; e-mail: [email protected]).
Chen Yuquan is with the Biomedical Engineering Department, ZheJiang University, Hangzhou, China (e-mail: [email protected]).
Qian Dahong is with Accel Semiconductor Corporation., CO 201203 Shanghai, China (e-mail: [email protected]).
all, we select the most power-efficient path and perform well in real time. Secondly, we avoid the heavy load links and preserve the load balancing of the distribution.
Algorithms which take inspiration from ants’ behavior in finding the best paths have recently been successfully applied into different fields including WSNs. Reference [1] Shows that some researchers introduced the ACO algorithm into WSNs and implemented it on the hardware. However, how to adjust the pheromone of each node by total energy level, throughput and delay of wireless networks is typically ignored. Reference [2] introduced the AntNet Algorithm into normal communications networks. However it seems to be unsatisfactory in WSNs. In this paper, in order to enhance the capability and network lifetime, we employ an adaptive dynamic algorithm based on ACO for routing operations. The ant routing-tables of each node are regularly updated by a back round ant holding network load and delay information. The rest of the paper is organized as follows: in Section II, we propose a practical ACO model for WSNs. In Section III, The scheme of routing algorithm are implemented, Section IV presents the simulation results. Finally in section V, some concluding remarks are made.
II. THE PROPOSED NETWORK MODEL ON ACO In DI CARO G’s paper [2], ants have the power of finding the shortest path from ant nests to foods. They use AntNet routing algorithm to select intermediate nodes to relay data packets on the overall energy efficiency of the network and the capability of ants is achieved by their releasing one kind of volatility pheromones along the path. Supposing a certain path is selected by more ants than other paths, more pheromones increments will be saved to the path, and as a result, more ants will select the path at the next time. Thus, the amount of the pheromones in the specific path will grow gradually because of accumulated positive feedback. In the end, ants will find the shortest path on a stable state. However, the key idea of our E&D ANTS scheme is taking advantages of the conjunction of energy and delay in wireless networks in order to update nodes’ pheromones.
The wireless network in consideration is modeled as a directed graphG N A( , ), where Nis the set of all the nodes which can queue and transfer packets and
A
is the set of all directed links( , )i j wherei j, ∈N. Leti
L
be the set of all nodes that can be reached by nodei
with a certain power level in its dynamicAn Ant-based approach to Power-Efficient
Algorithm for Wireless Sensor Networks
range. We assume that link( , )i j exists if and only if i
j∈L .
Each node ihas the residual energy
e
i (its initial value0
E .).
Assume that the transmission energy required for node
i
totransmit an information unit to its neighboring node
j
is ije
. Assume the ant routing-tables of nodeiaredenoted as follows:11 12 1
21 22 2
1 2
( ) ( ) ... ( )
( ) ( ) ... ( ) [ ( )]
( ) ( ) ... ( )
i i i
N
i i i
i N
i jd
i i i
L L LN
t t t
t t t
t
t t t
a
a
a
a
a
a
a
a
a
a
⎡ ⎤ ⎢ ⎥ ⎢ ⎥ = = ⎢ ⎥ ⎢ ⎥ ⎢ ⎥ ⎣ ⎦
Α
.i∈N j, ∈L d, ∈N (1)
Where each row in the upper matrix must meet the following constrained equation:
s. t. 1;
[ ]
1, i i jd j d N La
∈ = ∈∑
(2)Where i jd
a
represents the probability of selecting from thecurrent node
i
to destination nodedvia the node j[3].( ) (1 )
(1 )(| | 1) jd i j jd i t
a
N
ω ω ω ωη
τ
+ −=
+ − − (3) Whereω∈
[ ]
0,1 is a weighting factor and the denominator is a normalization term. The ant routing-tablesΑ
iare obtained by integrating partial pheromone trail values( )
i
jd
t
τ
and heuristic valuesj
η
. The pheromone trail values are calculated by (3):τ
ij(t+1)=ρτ
ij( )t + Δτ
ijbest (4)Whereρ∈
[ ]
0,1andΔτ
bestij =f
best( )t .The function
f
best( )t is the best solution of iteration. In thefollowing subsections, this function is our crucial object which needs further research on the tradeoff between power consumption and delay in wireless sensor networks. In [1], the heuristic values are set as the following equation:
[0,1] i i i n n N
e
e
η
∈ = ∈∑
(5)This enables an ant to make a decision according to neighbor nodes’ energy levels. A node will have less opportunity to be selected when it has a lower energy source.
III. DESCRIPTION OF ADAPTIVE DYNAMIC ACO ALGORITHM
A. The implementation of ACO
In this ACO algorithm, all the ants are identified into two types of artificial ants, a forwardFand a backwardBby their functions. An artificial antFrepresents an ant agent moves from a source node
s
to a destination nodedhopping from one node to the next till node d is reached. An artificial ant B represents an ant agent moves backward from a destination node dto a source nodes. Each ant researches for a minimum cost path between a pair of nodes of the network. All the ants are equally allocated from each network nodetowards destination nodes randomly selected to match the traffic load. Each ant has a memory
tab
kwhich contains the already visited nodes. The memory{
}
i
tab
kL
− is used to define, for each ant k, the set of nodes that an ant started from nodeistill has to visit. By exploiting{
}
k
tab
an antk
can buildfeasible solutions. That is to say, ant can try to avoid visit a node twice which is shown as follows:
( ) ( )
0 i
i jd k
jd
k t if j t if j
a
tab
p
tab
⎧ ∉ ⎪ = ⎨ ∈⎪⎩ (6) Where i ( )
jd t
p
is the probability of selecting the next nodej. The ant routing-tables of nodei
are denoted by i i ( )jd t
P
= ⎢⎡⎣p
⎤⎥⎦. Also, memory allows the ant to compute time delays and power consumption of the tour generated and to cover the same path backward to deposit pheromones on the visited nodes. When anFant arrives at its destination noded, the nodedwill produce oneBant to go back to the source nodesalong the same path{
}
k
tab
. At the same time, theBant will update pheromones of each node in{
}
k
tab
based on information of theFant’s collecting delays and power levels. The following two paragraphs describe the expressions of delay model and energy model.Each node in network will send packets by a certain speed. A split packet from each source is called and
F
kant whose destination node is selected by random probability. The intermediate nodes memorize and transferk
F
ants according to the FIFO principle. The strategy of transferringk
F
ants depends on the ant routing-tablesi
Α
in nodei
.The tables are applied to all the nodes unvisited by antk
. In forming the path from the source node to the destination node, antsk
F
use the same queue with numbers of packets to transfer. By this way, ants or data packets are totally delayed. So we record the delay time sd
D
that it costs when moving from the nodes
to the nodedas one important factor of evaluating the quality of the traffic of the path. LetDbe the set of time delay of each nodes which are denoted as the following matrix:11 12 1 21 22 2
1 2
, ;
i i i
N
i i i
N
i i i
L L LN
D j L d N
d
d
d
d
d
d
d
d
d
⎡ ⎤ ⎢ ⎥ ⎢ ⎥ =⎢ ⎥ ∈ ∈ ⎢ ⎥ ⎢ ⎥ ⎣ ⎦ (7) Where jd
d
represent the delay from the nodei
to thedestinationdvia the node
j
. In this paper Dis regarded as one factor of evaluating the modelf
best( )t . That is because thefactor of delay can show the quantities when an ant passes by, the capability of transferring packets and the performance of the link. Another reason is that it shows the status of congestion when artificial ants pass by the stagnated nodes.
always more power efficient compared to multi-hop under realistic environments when thinking of the basic consumption such as RF circuit, channel fading and path efficiency. Also it is pointed out that multi-hop network schemes will result in significant overhead when we assume a larger number of short hops replace a smaller number of long hops. In our optimization we minimize the network power consumption across all the nodes. So this optimization criterion maximizes average node lifetime in a long run if we assume that the data rate generated at each node is randomly changing to the same distribution, where the path length is a vector whose elements are the link costs given by
x ij ij
c
=e
. (8) Where x is nonnegative weighting factors for power consumption of the link, AssumeCis the set ofij
c
.Therefore, we formulate the power consumption problem with the objective of maximizing the system lifetime given the sets of source and destination nodes.B. Pheromones and E&D ANTS Model
As having been discussed above, energy and delay are two crucial factors in the update of pheromones which contribute on the best solution of the path. The best solution is to minimize the Energy∗Delay model. The mathematical expression is shown as follows:
( )
( ) ,
g t =Min Energy∗Delay (9)
However, generally increasing energy saving comes with a penalty of increased delay. Therefore there is a tradeoff between energy consumption spent and delay cost. Assume ant F passes along the path from the source
s
to the destinationd
denoted as the set P:{
s, ,... ,i i
1 k d}
. When ant B moves backward from the destination node d to the source nodes, we can calculate energy consumption and time delay of each stage in each agent. Further Integrating (7), (8) and (9), we determine the E&D ANTS module as follows:( ) | | ( )
i
s ij jd i P j
g t C D
L
c
d
∈ ∈
= × =
∑ ∑
∗ (10) Wherek is the number of solutions repeatedly constructed by all ants, their moving averagezis computed and each new solutionz
new is compared with z We can determine the increment of pheromones of the model as follows:0
( ) ( ) ( ) 1
( ) new ij
g t
t f t
z g t
z
τ
τ
⎛ − ⎞Δ = = ⎜ − − ⎟
⎝ ⎠
(11) Wherezis the average of the last k solutions, in order to achieve the optimal solution cost, we minimize theg t( )value to a low bound as much as possible. So in (10), we use RL algorithm to find the lowest value
g
best( )t which are shown asfollows:
( ) (1 ) ( 1) ijx ijd
g t = −ρ g t− +ρ
e d
(12)Whereρ is the learning rate,ρ∈[0,1), obviously, while the smaller the energy consumption is, the shorter delay time is on
the pathi→ j and the bigger the residual energy of node
i
has, the g t( )value will become smaller. That is to say, the model estimating value will approach to the best solution. As a result, the increment of pheromones on the path grows bigger and bigger. When the nodejis the best choice and ants have less chance to select other paths,the result of repeatedly searching is absolutely i ( ) 1jd t
p
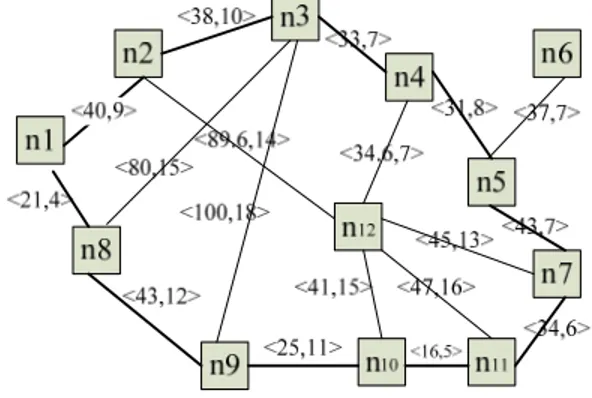
→ . It conforms to the constrained (2). IV. SIMULATIONTo evaluate the above analysis, we use network simulator OPNET to construct the network topology graph which is shown in Fig. 1. For the ACO implementation, program is written in C++. Besides, we also implement AntNet [2] algorithm in OPNET. The network is constructed by twelve nodes and eighteen links.
Fig 1: A Topology Graph of Wireless Network In Fig.1, the numbers within panes indicate node identifiers. Each line in the graph represents a bidirectional link and the original weights each link are indicated as <power consumption, propagation delay>, in which power consumption is measured in nJ/bit/message and propagation delay in millisecond (ms).
We assume the bandwidthBof each link is divided into two parts for bidirectional communications, and the links are constructed according to the Drop-Tail model (a finite FIFO queue). After source nodes produce a quantity of artificial ants or packets conforming to Poisson distribution, the destination nodes are randomly chosen by average probability. Each packet with an initial energy of 1 joule has a sequence number increased step by step. When one packet passes through a node by a certain speed, the node takes the first step to put all the ant agents into buffer storage and then selects the optimal path from its routing table to transfer packets. In this way all the ants disperse in as much paths as possible to achieve the balance of the load. The different sizes of one packet are considered in our simulations. So some of the experimental parameters used in the simulations are listed in Table I. In order to avoid cycles and
TABLE I
Poisson
Initial energy
e
0: 1 Joule per node Packet Size (S): 1 k, 2 k, 4 k, 8 k,32 k or 64 k bits Bandwidth (B): 1Mbit/s Traffic load (Load): 15 packets/s routing table’s freezing, we need initialize
0
τ to 1
i
L . In this
case, ant agents can adjust to the more efficient path when network traffic loads have changed and congestion fades away. Reference [4] introduced some simulation methods to find the best parametersxin (8). Considering (11) and (12), we assume the parameters of ρis 0.1.
In this paper, the performance metrics are used as follows: Energy: Power that all the nodes have consumed on sending a quantity of packets. We use the total energy consumed by sending messages as the indicator of the lifetime of network. Average delay time: It consists of waiting time in queues and transferring time, which is namely the average time delay of all the ants’ arriving at the destination node. We repeated experiments for more than ten times and calculated the average of those experimental data.
In Fig.2, comparing our simulation results with AntNet’s, we can see that our improved algorithm has better convergence properties. Otherwise, when we change the structure of network topology (to shut down the node
12
n
) or decrease thebandwidth of nodes to 0.5Mbit/s when t goes to 210, it is shown in Fig.2 that our model undergoes a short time fluctuation and approaches very fast back to the balance status. It has a wonderful robustness. Whereas, AntNet can not adapt to these changes, and the whole curve went up straightly.
(a)
(b)
Fig.2 The comparison of E&D ANTS and AntNet
Fig.3 Delay and Energy tradeoff each packet The tradeoff curve of delay and energy is shown in Fig3, where we conclude that E&D ANTS behaves better than AntNet in WSNs. In our experiments, we also found that the tradeoff curve is influenced by the topology graphs of networks and network load. Reference [7] proposed the tradeoff for different source rates and different network topologies in TDMA-based sensors networks.
V. CONCLUSIONS AND FUTURE WORK
In this paper, we propose a new algorithm model, E&D ANTS, which introduces a great energy-effective solution to communicate information from source nodes to destination nodes and significantly simplifies the topology of network at the same time. From the above research and simulation results, we obtained an amazing effect on determining the increment of pheromones by minimizing the model Energy ∗ Delay. Without founding an enormous model, we optimize it by using the RL algorithm. Our study shows that E&D ANTS achieves up to 127% higher communication throughput while consuming 80% less per packet energy than AntNet. However, in wireless sensor devices, the memory of each node is limited. So when network traffic load is heavy, retransmissions will consume a lot of energy because of high packet loss rate. So the next step is to develop a mechanism which allows a node to accurately estimate the traffic and adjust its wakeup rate accordingly.
REFERENCES
Conference on Adaptive Hardware and Systems (AHS’06), June,2006, pp.401-404.
[2] D. DORIGO and M. DI CARO, “AntNet: A mobile agents approach to adaptive routing,” Belgium: Universite Libré de Bruxelles, 1997. [3] D. DORIGO and M. DI CARO, “Ant Colony Optimization: A New
Meta-Heuristic,” Proceedings of the 1999 Congress on Evolutionary Computation, 1999, pp. 1470-1477.
[4] Chang J H, Tassiulas L, “Energy Conserving Routing in Wireless Ad-hoc Networks,” Proceedings of the Conf on Computer Communications (IEEE INFOCOM 2000), Mar. 2000, pp22-31.
[5] M. Haenggi, ”Twelve Reasons not to Route over Many Short Hops, ” In IEEE Vehicular Technology Conference (VTC’04 Fall), Los Angeles, CA, Sept. 2004.
[6] Qin Wang, Mark Hempstead and Woodward Yang, “A Realistic Power Consumption Model for Wireless Sensor Network Devices,” IEEE International Conference on Sensor and Ad Hoc Communications and Networks (SECON06), 2006.