DOI : 10.5121/ijwmn.2012.4418 243 1
S. Taruna,
2Sheena Kohli
, 3G.N.Purohit
Computer Science Department, Banasthali University, Rajasthan, India
1
2
A
BSTRACTWireless sensor networks (WSN) provide the availability of small and low-cost sensor nodes with capability of detecting, observing and monitoring the environment, along with data processing and communication. These sensor nodes have limited transmission range, processing and storage capabilities as well as their energy resources. Routing protocols for wireless sensor networks are responsible for maintaining the energy efficient paths in the network and have to ensure extended network lifetime. In this paper, we propose and analyze a new approach of cluster head selection by a homogeneous sensor node (having same initial energy) in wireless sensor network, which involves choosing the cluster head which lies closest to the midpoint of the base station and the sensor node. Our proposed routing algorithm is related with energy and distance factors of each nodes. This scheme is then compared with the traditional LEACH protocol which involves selecting the cluster head which is nearest to the particular node. We conclude that the proposed protocol effectively extends the network lifetime with less consumption of energy in the network.
K
EYWORDSWireless Sensor network, Cluster head, Routing protocol, Network lifetime, Dead nodes.
1. INTRODUCTION
A wireless sensor network (WSN) consists of numerous small autonomous devices called sensors or nodes, capable of sensing the environment, processing the information locally and sending it to the point of collection through wireless links in a particular geographical area. WSNs are scalable and smart. The sensors can communicate directly among themselves or to some base station deployed externally in the area. But being autonomous nodes , they have limited battery , processing power and bandwidth. Of all the resources constraints, limited energy is most concerning one . One of the main design goals of WSNs is to carry out energy efficient data communication while trying to prolong the lifetime of the network.[6]
Routing in wireless sensor networks is very challenging due to the essential characteristics that distinguish wireless sensor networks from other wireless networks. It is highly desirable to find the method for energy efficient route discovery and relaying of data from sensor node to base station so that lifetime of network is maximized.
244
In this paper, we analyze energy efficient homogeneous clustering head selection algorithm by a sensor node for WSN. We first describe the new distance based scheme, its pseudocode, flowchart, packet format, and its different scenarios, and then the simulation results in MATLAB[2].
Further, the performance analysis of the proposed scheme is compared with benchmark clustering algorithm LEACH[4].
2. RELATED WORK
Routing is a process of selecting a path in the network from source to destination along which the data can be transmitted. Various protocols [3] like LEACH, HEED, PEGASIS, TEEN, APTEEN are available to route the data from node to base station in WSN.
Sensors organize themselves into clusters and each cluster has a leader called as cluster head(CH), i.e. sensor nodes form clusters where the low energy nodes called cluster members (CM) are used to perform the sensing in the proximity of the phenomenon. For the cluster based wireless sensor network, the cluster information and cluster head selection are the basic issues. The cluster head coordinates the communication among the cluster members and manages their data.[1]. The process of clustering in routing provides an efficient method for maximizing the lifetime of a wireless sensor network by rotating the role of cluster head.
Low-energy adaptive clustering hierarchy (LEACH)[4] is a popular energy-efficient clustering algorithm for sensor networks. LEACH randomly selects a few sensor nodes as CHs and rotate this role to evenly load among the sensors in the network in each round. In LEACH, the cluster head (CH) nodes compress data arriving from nodes that belong to the respective cluster, and send an aggregated packet to the base station. A predetermined fraction of nodes, p, elect themselves as CHs in the following manner. A sensor node chooses a random number, r, between 0 and 1. If this random number is less than a threshold value, T(n), the node becomes a cluster-head for the current round. The threshold value is calculated based on an equation that incorporates the desired percentage to become a cluster-head, the current round, and the set of nodes that have not been selected as a cluster-head in the last (1/p) rounds, denoted by G. It is given by:
Here, G denotes the set of nodes involved in the selection of CH. Each elected CH broadcasts a message to the rest of the nodes in the network to inform that it is the new cluster-head. A sensor node or non- CH selects the CHs which is nearest to it .
LEACH clustering terminates in a finite number of iteration, but does not guarantee good cluster head distribution. Some nodes may choose a cluster so that the distance between its CH and sink (base station) is even further than the distance between the node itself and the sink. According to the energy model of LEACH protocol, the energy cost will increase as the distance increases. Battery power being limited in the sensor nodes, let the nodes to expire on full consumption of energy.
3.THE PROPOSED ALGORITHM
In order to save the total energy cost of the sensor networks and prolong its lifetime, we propose a distance-based clustering protocol, LEACH-MP (LEACH-minimal path). The basic idea of the protocol is as follows:
245 • All nodes can send data to Base station (BS).
• The BS has the information about the location of each node. It’s assumed that the cluster heads and nodes have the knowledge of its location.
• Data compression is done by the Cluster Head.
• In the first round, each node has a probability p of becoming the cluster head. • All nodes are of same specification.
• All nodes in the network are having the same energy at starting point and having
maximum energy.
• Energy of transmission depends on the distance (source to destination) and data size.
• Nodes are uniformly distributed in network in a random manner.
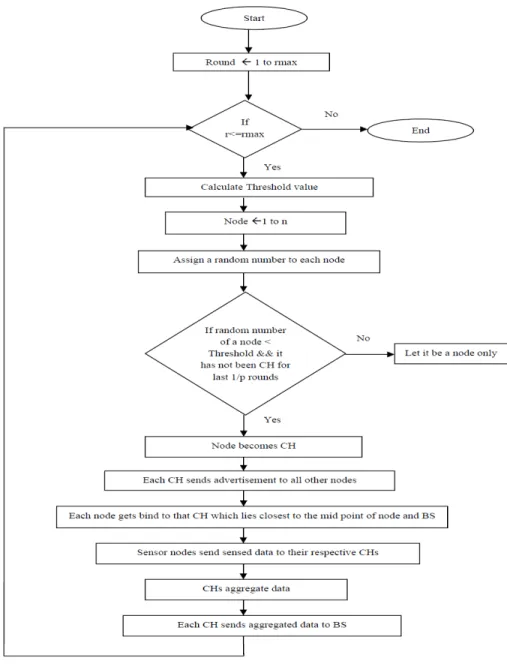
Like LEACH, the operation of LEACH-MP is also divided into rounds. Each round begins with a set-up phase and steady phase. We do not change the way LEACH elects its cluster heads but changed the cluster formation algorithm. After the cluster heads are selected, cluster-heads broadcast an advertisement message that includes their node ID as the cluster-head ID and location information to inform non-cluster head nodes. Non-cluster head nodes first record all the information from cluster heads within their communication range. Then the node finds the cluster head which is closest to the middle-point between the node itself and the sink and joins that cluster. In other words, we changed the way how nodes join the cluster in order to decrease the total energy cost of the network and prolong the network lifetime.
The round diagram of LEACH-MP can be seen in the following Figure 1.
Figure.1. Round Diagram of LEACH-MP
Next the mathematical analysis will be given about the new scheme.
4. NETWORK AND ENERGY CONSUMPTION MODEL
The transmission energy of transmitting a k-bit message over a distance t is given by: E TX(k,t) = E TX-elec(k) +E TX-amp(k,t)
= kEelec + kEfs t
2
246
Eelec isthe transmitter circuitry dissipation per bit , Eamp is the transmit amplifier dissipation per
bit and Efs is thedissipation energy per bit.
The receiving energy cost is: E RX(k) = E RX-elec(k)
= kEelec (2)
The total energy cost of a network is given by:
E total = ETX +ERX + EI +ES (3)
which needs to be minimized i.e.Min (E total )
Here , EI is the energy cost during idle state. ES is the energy cost while sensing.
Generally the three cost except the transmission cost are constant for a node. Only ETX needs to
be considered. So, we have to find Min (ETX).
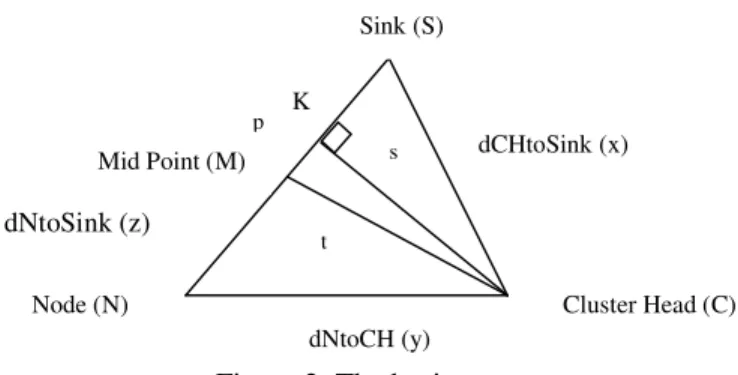
The energy cost mainly depends on the distance t , taking all other variable in the equation constant. Thus, we derive that we have to optimize Min (t2). The distance between a sensor node and a cluster head is denoted as dNtoCH and that between a cluster head and a sink as dCHtosink. According to the energy model, we further simplify the optimization goal to minimize t2 as Min (dNtoCH 2 + d CHtosink2). As shown it the Figure 2, let the triangle SNC depicts the position of node, CH and sink or Base Station respectively, where, S is the BS , C the CH and N the sensor node. The distance between sensor node N and sink S is dNtoSink = z , dNtoCH=y and dCHtosink=x
Figure 2. The basic concept
Further a perpendicular is drawn from C on line SN at point K. The length of this perpendicular is s . M is the mid point between node and sink. The distance between mid point of node and sink and that of CH is given by t.
Thus. KM=p , CM= t, CK=s
From the rule of trigonometry, applying pythagoras theorem,
In SKC,
dCHtoSink 2 = CK 2 + (dNtoSink / 2 – p ) 2
x2 = s 2 + (z/ 2 – p ) 2 (4)
In NKC,
dNtoCH 2 = CK 2 + (dNtoSink / 2 + p ) 2
y2 = s 2 + (z/ 2 + p ) 2 (5)
Combining both equations(4) and (5),
x2 + y2 = s 2 + (z/ 2 – p ) 2 + s 2 + (z/ 2 + p ) 2
= 2 s 2 + z2/ 2 + 2 p 2 (6) Sink (S)
Cluster Head (C)
Mid Point (M)
Node (N)
dNtoCH (y)
dCHtoSink (x) K
dNtoSink (z)
s
247
From MKC ,
t2 = p 2 + s 2 , so substituting p2 = t2 –s2
we get , x2 + y2 = z 2 / 2 + 2 t 2 (7)
We can see that when the value of dNtoSink is fixed , dNtoCH 2 + d CHtosink2 is only related to t i.e. Min (dNtoCH 2 + d CHtosink2) is equivalent to Min (t2). As a result , if a node chooses its CH which is closest to the mid point of this node and the sink , the squared distance of their communication is smallest. Min (dNtoCH 2 + d CHtosink2) is to actually minimize the distance between the CH and the midpoint of a node and the BS when the distance between the node and the BS is fixed. Thus, in LEACH–MP, non–cluster nodes select the CH which is nearest to the midpoint between itself and the BS as its communication CH for minimizing the communication cost.
The flowchart of the proposed scheme is as follows :
248
The pseudocode of the proposed scheme is as follows:
1. Deployment of Sensor Nodes and Base Station in the network
The nodes are randomly deployed in the given network area of predefined size and the Base Station (BS) is located at the desired position. The nodes are shown by symbol ‘o’ and BS by ‘x’.
2. Choosing Cluster Head
1 {For each round
2 Threshold is set to (P / (1 – P * (round % 1/P))) 3 {for each node
4 {if number of cluster head<= P && energy of node > 0 5 Assign a random number
6 { if (random number < threshold value) && (the node has not been cluster head) 7 Node is Cluster head //assign node id to cluster head list
8 Increment cluster head count //a new cluster head has been added 9 Else go to the next node}
10 Else go to the next node} 11}
After the cluster heads are chosen for a round, clusters are ready to be formed. Sensor nodes then choose a cluster head by the one that is the closest to the mid point between it and BS.
3. Forming Clusters
1 {For each node
2 if node is a cluster head 3 go to next node 4 {else
5 {for each cluster head
6{ node coordinate x is assigned to x1 7 node coordinate y is assigned to y1 8 cluster head coordinate x is assigned to x2 9 cluster head coordinate y is assigned to y2
10 mid point coordinate x of node coordinate and BS coordinate is assigned to x3 11 mid point coordinate y of node coordinate and BS coordinate is assigned to y3 12 }
13 the distance between mid point of node to BS and cluster head is the least distance 14 cluster head id is assigned as cluster head to that node
15} 16} 17}
Transmission and Reception of Data
The cost of transmitting a message is: ETX(k, t)=Eelec * k + Eamp * k * t2. The cost of receiving a message is: ERX(k)=Eelec * k.
18 {if distance between node and cluster head is <= the transmission range 19 Transmission cost is ETx(k, t)=Eelec * k + Efs * k * t2
20 Reception cost is ERx(k)=Eelec * k
21 Subtract the transmission cost from the sending node 22 {if remaining energy <= 0
249
24 exit the program 25 }
26 Subtract the reception cost from the receiving node 27 {if remaining energy <= 0
28 display node has died 29 exit the program 30 }
31 return the sum of transmission cost and reception cost and calculate the residual energy of each node
32} 33 }
The packet formats used in the proposed scheme will be :
1. Cluster head sends advertisement or JOIN request to all nodes in the network. The control packet comprises of following fields:
• Node ID or CH ID is the identifier of the node, which is a number ranging between 1 to 100 for 100 nodes.
• Node type is ‘CH’ if the node is cluster head else its ‘N’.
• Location gives the coordinates of the position of the node in the network field. • JOIN request is the advertisement sent by CH to other nodes to let nodes make
its presence. The bit is set to ‘0’.
• TTL is the Time To Live, here it is 1 round . The request will be valid for each round.
• A blank field is sent with the request to all nodes for attaching the node ID , by the node which accepts the request.
• The control packet size is 500 bits.
2. Nodes choose their Cluster Head and send ACK.
• The acknowledgement for the JOIN request is sent by setting the bit as ‘1’ , if the node accepts the request of the cluster head to get itself bind to the CH.
• Here the bit is set to ‘1’ and the node which sends the acceptance reply, attaches its ID in the blank field.
3. Nodes send data to that CH. The data packet comprises of following fields:
Node (CH) ID
Node type ‘CH’
Location JOIN Request =0
Node ID CH ID Data Node (CH)
ID
Node Type ‘CH’
Location JOIN Reply=1
Node ID
TTL
TTL Blank for
250 • Node ID is the identifier of the node, which is a number ranging between 1 to 100 for
100 nodes.
• CH ID is the identifier of the CH to which the node sends the data.
• Data is the actual data that has to be transmitted from node to CH and then further to BS after compression.
• The data packet size is 4000 bits.
4. The Cluster Head sends data to BS after compression. The Compression rate or fusion rate is taken as 0.6
• Node (CH) ID is the identifier of the node , which is a number ranging between 1 to 100
for 100 nodes.
• Aggregated data is the data obtained on compression by CH at cc of 0.6
• BS ID is the base station identifier which is needed by CH to send data to the base station , more specifically when there are more than one BS.
The tables to be maintained at each Cluster Head and Node are :
(1) At CHs CH ID Residual Energy Round no. when it becomes CH
Location Node IDs to which it sends the request Node IDs from which it gets the acceptance Data buffered BS ID ---- ---- ---- ---- ---- ---- ---- ---- --- ---- ---- ---- ---- --- --- ----
(2) At Nodes Node
ID
Location Residual energy
CH IDs from which request has
been obtained
CH IDs to which acceptance has been send
Data
--- ---- ---- ---- ---- ---- --- ---- ---- --- --- ----
5. SIMULATION AND PERFORMANCE EVALUATIONS
We choose MATLAB for simulation. The protocol is compared to the LEACH algorithm giving results on the comparison of energy consumption and network lifetime under different scenarios.
Node (CH) ID
251 5.1. Simulation Parameters
Table 1. Simulation Parameters
Parameter Values
Simulation Round 2000
Number of nodes 100
CH probability 0.1
Fusion rate (cc) 0.6
Initial node power 0.5 Joule
Nodes Distribution Nodes are randomly uniformly distributed
Packet size (k bits) 4000
Energy dissipation (Efs) 10*0.000000000001 Joule Energy for Transmission (ETX) 50*0.000000000001 Joule
Energy for Reception (ERX) 50*0.000000000001 Joule
Energy for Data Aggregation
(EDA) 5*0.000000000001 Joule
5.2. Simulation Results
5.2.1. Energy Consumption with different sink location
The energy consumption of LEACH-MP protocol has been compared with that of LEACH by changing the location of Base station. The simulation was done on a network of area 200 x 200 and the energy consumed in the network was calculated by letting BS to be at different locations i.e. (100,100), (100,200),(100,250) and (100,300). The graphs shown in Figure 4(a) and (b) depict that in each case, the energy consumption of LEACH-MP is always less than that of LEACH, even on changing different BS locations in the network .
Table 2. Energy consumption on changing BS position
Sim.Run
Energy consumption in µJ
BS(100,100) BS(100,200) BS(100,250) BS(100,300)
leach MP leach leach MP leach leach MP leach leach MP Leach
1 33.62 42.21 23.1 125.662 125.79 162.24 149.61 273.61
2 16.8 75.89 10.57 71.73 71.96 338.99 115.58 177.6
3 42 91.78 43.1 212.7 24.62 216.03 112.08 156.21
4 37.5 104.3 33.21 235.65 16.61 101.52 193.39 410.42
5 25.9 56.11 26.61 167.71 38.34 153.9 92.61 458.33
6 15 26.1 16.71 38.09 192.43 310.09 87.82 377.91
7 62.7 208.09 18.01 38.8 74.65 122.02 32.81 200.62
8 45.25 98.12 50.98 197.06 54.8 232.97 84.44 371.97
9 75.75 185.1 64.34 128.34 16.1 82.58 108.82 391.55
252
Figure 4(a). Energy consumption v/s simulation run on changing BS position
Figure 4(b). Energy consumption v/s simulation run on changing BS position
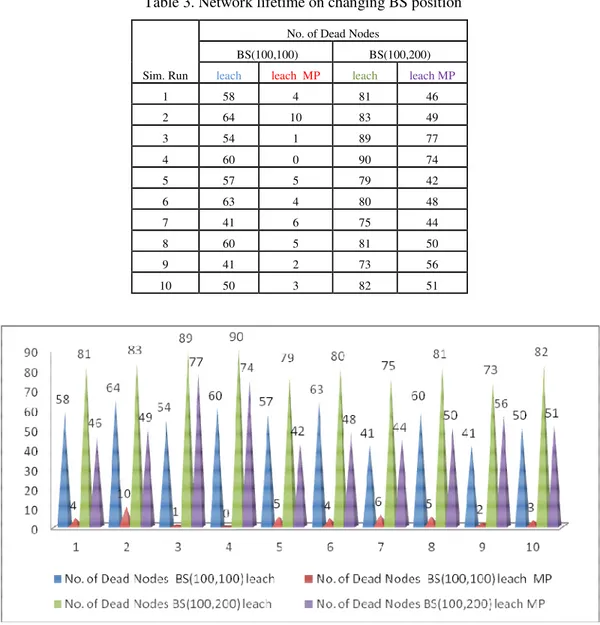
5.2.2. Network lifetime with different sink location
253 LEACH-MP than that in LEACH, no matter where the sink is located, keeping network size as 200x200. The result is shown in Figure 5.
Table 3. Network lifetime on changing BS position
Sim. Run
No. of Dead Nodes
BS(100,100) BS(100,200)
leach leach MP leach leach MP
1 58 4 81 46
2 64 10 83 49
3 54 1 89 77
4 60 0 90 74
5 57 5 79 42
6 63 4 80 48
7 41 6 75 44
8 60 5 81 50
9 41 2 73 56
10 50 3 82 51
Figure 5. No. of dead nodes v/s simulation run on changing BS position
5.2.3. Energy Consumption with different network size
Further the energy consumption of the network was calculated by changing the size of the network area. i.e. (50x50), (100x100), (200x200) and (500x500). The BS is located at the centre in each case.
254
Table 4. Energy consumption on changing network size
Sim.Run
Energy consumption in µJ
N/w size N/w size N/w size N/w size
50X50 100X100 200X200 500X500
leach MP leach leach MP leach leach MP leach leach MP Leach
1 2.48 6.07 11.2 39.7 122.21 259.93 539.64 763.5
2 3.92 6.26 10.59 31.25 107.43 172.88 88.99 367.39
3 2.28 5.68 13.28 21.8 93.02 178.58 289.07 363.14
4 2.58 8.1 7.04 12.32 7.53 112.22 42.22 138.91
5 4.2 14.56 19.9 61.34 55.51 352.21 577.64 840.96
6 8.48 11.17 6.25 14.18 11.37 20.08 175.02 554.44
7 1.92 6.01 2.64 17.7 53.19 140.38 185.17 639.78
8 3.38 4.52 10.96 38.71 19.04 50.78 364.85 991.69
9 1.87 5.2 13.31 20.71 66.2 261.34 30.78 144.05
10 1.35 8.31 18.38 31.67 82.84 275.05 141.52 493.33
255
Figure 6 (b). Energy consumption v/s simulation run on changing network size
5.2.4. Network lifetime with different network size
Similarly , we changed the network area size again and calculated the lifetime of the network with both the protocols. The results are shown in Figure 7.
It was concluded that the number of nodes becoming dead at the end of each simulation run was more in LEACH-MP as compared to LEACH in each case, whatever the network size be
Table 5. Network lifetime on changing network size
Sim. Run
No. of Dead Nodes
N/W Size 200x200 N/W size 500x500
leach leach MP leach leach MP
1 57 7 85 32
2 58 0 82 35
3 56 1 77 44
4 55 3 79 29
5 60 8 81 37
6 61 5 83 48
7 63 9 80 49
8 64 12 78 46
9 57 3 88 40
256
Figure 6. No. of dead nodes v/s simulation run on changing network size
6.
C
ONCLUSION AND FUTURE WORKEnergy consumption is the main design issue in routing of Wireless Sensor Networks. We concluded that energy consumed for the cluster head selection is less in the proposed algorithm, where we choose the cluster head which lies closest to the midpoint of the base station and the sensor node , which directly shows the increased network survivability. Further the network lifetime, in terms of number of nodes dead after each simulation, of the proposed algorithm has greater span than the LEACH protocol, even on changing the network size and sink position. The proposed algorithm is for the homogeneous network and we propose to extend this work for the heterogeneous network.
REFERENCES
[1] J. Al-Karaki, and A. Kamal, “Routing Techniques in Wireless Sensor Net-works: A Survey“, IEEE Communications Magazine, vol 11, no. 6, Dec. 2004, pp. 6-28.
[2] http://www.mathworks.in
[3] Ankita Joshi , Lakshmi Priya.M “A Survey of Hierarchical Routing Protocols in Wirless Sensor Network”, International Conference on Information Systems, May 2011, pp 67-71
[4] Wendi Rabiner Heinzelman et al.“Energy-Efficient Communication Protocol for WirelessMicrosensor Networks”, in Proceeding of the 33rd Hawaii International Confrence on System Sciences, January 2000,pp1-10
[5] S. Taruna, Jain Kusum Lata, Purohit G.N, “Zone Based Routing Protocol for Homogeneous Wireless Sensor Network”, International Journal of Ad hoc, Sensor & Ubiquitous Computing (IJASUC) Vol.2, No.3, September 2011, DOI : 10.5121/ijasuc.2011.2307 99
257
Authors
S.Taruna is an active researcher in the field of communication and mobile network, currently working as Assistant Professor in Department of Computer Science at Banasthali University (Rajasthan), India. She has done M.Sc from Rajasthan University and her PhD is in progress from Banasthali University (Rajasthan), India. She has presented many papers in National and International Conferences and published 6 papers in various journals.
Sheena Kohli received B.Tech degree in Information Technology from Rajasthan Technical University, Kota (Rajasthan) in 2010. She has completed her M.Tech in Information Technology from Banasthali University (Rajasthan), India, in May 2012. Her research interests include computer networks, wireless ad hoc and sensor networks.