Quantification of Diaphragm Mechanics in
Pompe Disease Using Dynamic 3D MRI
Katja Mogalle1*, Adria Perez-Rovira1,2, Pierluigi Ciet3,4, Stephan C. A. Wens5,6, Pieter A. van Doorn5,6, Harm A. W. M. Tiddens3,4, Ans T. van der Ploeg6,7, Marleen de Bruijne1,8*
1Biomedical Imaging Group Rotterdam, Departments of Medical Informatics & Radiology, Erasmus MC, Rotterdam, the Netherlands,2Department of Pediatric Pulmonology, Erasmus MC-Sophia Children’s Hospital, Rotterdam, the Netherlands,3Department of Radiology, Erasmus MC, Rotterdam, the Netherlands,4Department of Pediatrics, Respiratory Medicine and Allergology, Erasmus MC-Sophia, Rotterdam, the Netherlands,5Department of Neurology, Erasmus MC, Rotterdam, the Netherlands, 6Centre for Lysosomal and Metabolic Diseases, Erasmus MC-Sophia, Rotterdam, the Netherlands, 7Department of Pediatrics, Division of Metabolic Diseases and Genetics, Erasmus MC-Sophia, Rotterdam, the Netherlands,8Department of Computer Science, University of Copenhagen, Copenhagen, Denmark
*[email protected](KM);[email protected](MdB)
Abstract
Background
Diaphragm weakness is the main reason for respiratory dysfunction in patients with Pompe disease, a progressive metabolic myopathy affecting respiratory and limb-girdle muscles. Since respiratory failure is the major cause of death among adult patients, early identifica-tion of respiratory muscle involvement is necessary to initiate treatment in time and possibly prevent irreversible damage. In this paper we investigate the suitability of dynamic MR imaging in combination with state-of-the-art image analysis methods to assess respiratory muscle weakness.
Methods
The proposed methodology relies on image registration and lung surface extraction to quan-tify lung kinematics during breathing. This allows for the extraction of geometry and motion features of the lung that characterize the independent contribution of the diaphragm and the thoracic muscles to the respiratory cycle.
Results
Results in 16 3D+t MRI scans (10 Pompe patients and 6 controls) of a slow expiratory maneuver show that kinematic analysis from dynamic 3D images reveals important addi-tional information about diaphragm mechanics and respiratory muscle involvement when compared to conventional pulmonary function tests. Pompe patients with severely reduced pulmonary function showed severe diaphragm weakness presented by minimal motion of the diaphragm. In patients with moderately reduced pulmonary function, cranial displace-ment of posterior diaphragm parts was reduced and the diaphragm dome was oriented more horizontally at full inspiration compared to healthy controls.
a11111
OPEN ACCESS
Citation:Mogalle K, Perez-Rovira A, Ciet P, Wens SCA, van Doorn PA, Tiddens HAWM, et al. (2016) Quantification of Diaphragm Mechanics in Pompe Disease Using Dynamic 3D MRI. PLoS ONE 11(7): e0158912. doi:10.1371/journal.pone.0158912
Editor:Philipp Latzin, University Children’s Hospital Bern, SWITZERLAND
Received:January 4, 2016
Accepted:June 23, 2016
Published:July 8, 2016
Copyright:© 2016 Mogalle et al. This is an open access article distributed under the terms of the
Creative Commons Attribution License, which permits unrestricted use, distribution, and reproduction in any medium, provided the original author and source are credited.
Data Availability Statement:All relevant data are within the paper and its Supporting Information files. Representative, de-identified MRI images have been made available as Figures. In order to protect privacy and confidentiality of the study participants, complete MRI data is not publicly available.
Conclusion
Dynamic 3D MRI provides data for analyzing the contribution of both diaphragm and tho-racic muscles independently. The proposed image analysis method has the potential to detect less severe diaphragm weakness and could thus be used to determine the optimal start of treatment in adult patients with Pompe disease in prospect of increased treatment response.
Introduction
Pompe disease (glycogen storage disease, type 2) is an inherited neuromuscular disorder char-acterized by progressive limb-girdle weakness and pulmonary insufficiency [1,2]. Large varia-tions in disease progression and manifestation are typical between adults with Pompe disease. For example, both age and limb-girdle weakness lack correlation with respiratory function [3]. However, disease duration and degree of respiratory muscle involvement are significant predic-tors of disease severity and rapid progression [4,5]. Common consequences of diaphragm weakness are sleep-disordered breathing, ventilator dependency and respiratory failure, which is the major cause of death among patients [6,7]. Enzyme replacement therapy (ERT), which was approved in 2006, has been demonstrated to positively alter the course of Pompe disease and stabilize or improve motor function [8], although pulmonary function may also continue to deteriorate [9]. Observational studies showed that ERT has a higher effect on patients with less severe symptoms and therefore suggest to start treatment early, before muscle damage becomes possibly irreversible [10,11]. Quantitative methods for early and comprehensive diag-nosis of diaphragm impairment are essential to determine the optimal start of ERT and to monitor and predict treatment response.
In current clinical practice, pulmonary function tests (PFT) are used to evaluate general res-piration performance by breathing into a spirometer. In adult Pompe patients, early involve-ment of the diaphragm might stay undetected with PFT due to compensatory efforts of the intercostal, accessory and abdominal musculature [12,13]. High resolution muscle magnetic resonance imaging (MRI) and computed tomography (CT) have been reported to be useful modalities to assess skeletal [14,15] and respiratory muscle atrophy [16]. Yet, manual measur-ing of muscle thickness requires extensive anatomical knowledge and the structural analysis does not capture the actual functional effects on the respiratory system. In contrast, dynamic imaging enables direct functional analysis of the respiratory system. Lung and diaphragm motion have been previously investigated via x-ray fluoroscopy [17], ultrasonography [18–20], CT [21,22] and MRI [23–27].
In dynamic imaging, multiple images (referred to as frames) acquired at different time points are combined to an image sequence. This can be achieved in 2D (e.g. at mid-sagittal plane in right and left lung or mid-coronal plane) [28–32], or in 3D [26,33,34].
The characterization of the respiratory system based on dynamic images can be catego-rized into two main types of features: geometry and motion measurements. Geometry fea-tures can be obtained from a single frame, independent of the other frames in the sequence. Typical geometry features described in literature [23,24,28,30,31,35] are lung volume, lung size (in anterior-posterior, cranial-caudal and left-right direction), diaphragm length (2D images) or diaphragm surface area (3D images), both divided into zone of apposition and diaphragm dome. The diaphragm is a sheet of muscle that is attached to the ribs and sep-arates the thoracic from the abdominal cavity. As a consequence of contraction and
collection and analysis, decision to publish, or preparation of the manuscript.
relaxation of the diaphragm during breathing, a part of this big muscle rests against the rib cage (referred to as zone of apposition) and the other part rests against the lungs and heart (referred to as diaphragm dome). Vostatek et al. [32] additionally investigated inclination, flatness and position of the diaphragm dome. The extraction of motion features requires tracking of landmarks through the whole image sequence. Multiple studies have investigated the excursion of the diaphragm during breathing in healthy subjects based on the established point correspondences [25,29,31].
To facilitate the extraction of geometry features, image segmentation methods are usually used to partition the image into meaningful segments. The segment boundaries (e.g. lung surface or diaphragm) can be by manually tracing object silhouettes [23,24,29,31,32], semi-automatically including little user interaction [34,35], or fully automatically [27,36]. Manual segmentation of the diaphragm and lungs is a very time-consuming and tedious task, especially in 3D images or images sequences. The automatic extraction of the dia-phragm from radiological images is inherently difficult due to its small thickness (3.3 mm at full-expiration and mean thickening ratio of 1.8 at full-inspiration [37]). To the best of our knowledge, no methods have been reported to automatically segment the entire diaphragm (including zone of apposition) in either MR or CT images. In high-resolution CT images, the diaphragmatic dome has been segmented by fitting a quadratic surface [38] or a thin-plate model [39] to the most inferior voxels of a lung segmentation. Automated lung segmentation in static 3D MRI data has been proven feasible, e.g. by using 3D region growing [36], confi-dence-connectedness segmentation [26] or statistical shape models in combination with deformable mesh segmentation [40]. In dynamic MRI scans, the automatic delineation of the diaphragm is more challenging due to the poor quality of scans (i.e. low spatial image resolu-tion, low signal-to-noise ratio, artifacts at tissue borders) resulting from the high demands on temporal resolution.
Motion features have previously been extracted in two different ways: segmentation- and registration-based. Plathow et al. [27] applied deformable mesh segmentation successively to the 3D frames of an image sequence while incorporating temporal coherence. Yet, the robust-ness of this approach with respect to image artifacts (e.g. ghosting at lung tissue borders) was not addressed and spatial/temporal accuracy and smoothness of the segmentation were not evaluated. Lung motion has also been represented in terms of deformation fields which are esti-mated using intensity-based non-rigid image registration [22]. Recent advances in this field aimed at decreasing computation time [34,41] or incorporating temporal regularization to enforce smooth lung motion [42].
Materials and Methods
Ethics statement
Written informed consent was obtained from all participants. The study protocol was
approved by the Medical Ethics Committee at the Erasmus MC University Medical Center Rot-terdam (Amendment 7 to protocol MEC-2007-103).
Data acquisition
The presented study includes 16 adults, of which 10 were diagnosed with late-onset Pompe dis-ease (referred to asP01—P10) and 6 age- and gender-matched controls (referred to asC01—
C06). At data acquisition, the median age of the patients was 46 years (range: 32–66) and for controls 43 years (range: 27–55). Both groups consisted of 50% females. Three patients required nocturnal ventilation and one was wheelchair dependent. The median time since diagnosis was 16 (range: 9–30) years and all patients received enzyme replacement therapy (range: 0–7 years, median duration: 5.5 years).
All subjects were scanned on a 3T GE Signa 750 MRI scanner (General Electric Healthcare, Mil-waukee, USA) using a 32-channel torso coil. The exact parameters of the acquisition procedure are described in [43] and in the table ofS1 Table. Static, full-inspiration and full-expiration scans were acquired during 12-seconds breath-hold using a 3D RF-spoiled gradient echo sequence (sagittal volume acquisition, 3 mm slice thickness, 3.6 × 2.8 × 3.0 mm acquired resolution, approx. 1.4 × 1.4 × 1.5 mm interpolated voxel size). A dynamic sequence was also acquired while the sub-jects performed a slow exhalation maneuver from total lung capacity (TLC) to residual volume (RV). This sequence contains 48 3D volumes which were continuously acquired at a rate of approx-imately 2.5 volumes per second. Fast acquisition was achieved using the time resolved imaging of contrast kinetics (TRICKS) technique [44] and a reduced spatial resolution (sagittal volume acqui-sition, 12 mm slice thickness, 4.8 × 6.0 × 12.0 mm acquired resolution, approx. 1.9 × 1.9 × 6 mm interpolated voxel size). To guarantee the correct execution of the maneuver during static and dynamic imaging, both the preliminary training and the scanning were controlled with an MR-compatible spirometer and instructions were given by a certified lung function technician who also supervised the quality of the maneuver. An example of the acquired sequence for one Patient and one control are provided in the videos inS1andS2Videos.
The dynamic sequences were manually cropped, discarding the tidal breathing after full exhalation. The sequence lengthT(expressed as mean±std) for all subjects thus decreased to 36 ± 8.9 frames (patients: 33.6 ± 9.8, volunteers: 40 ± 5.3).
A trained medical observer manually segmented right and left lung in both static scans (inspi-ration and expi(inspi-ration) of each subject by tracing the lung surface in every second axial slice using 3D slicer (www.slicer.org). Slices without annotations were filled automatically via interpolation. Pulmonary function tests (PFT) were also performed prior to the MRI scan to measure vital capacity (VC), forced vital capacity (FVC), forced expiratory volume in one second (FEV1), peak expiratory flow (PEF) and maximum inspiratory and expiratory pressure (MIP, MEP). The mea-surements VC, FVC, FEV1 and PEF were acquired both in sitting and supine position and expressed as absolute values as well as percentage with respect to predicted values. The postural dropΔFVC was measured as the relative difference between FVC in sitting and supine position. A drop of>25% is commonly considered an indicator of diaphragm weakness [12,13].
Methods overview
dynamic image sequence resulting in a dense deformation field. Based on these deformation fields, the contribution of the different muscular groups involved in the respiratory maneuver is derived. By tracking the bottom of the lung surface the diaphragm motion can be investi-gated in detail, while the chest wall contribution is inferred by evaluating the movement of the anterior-posterior and left-right surfaces of the lung.
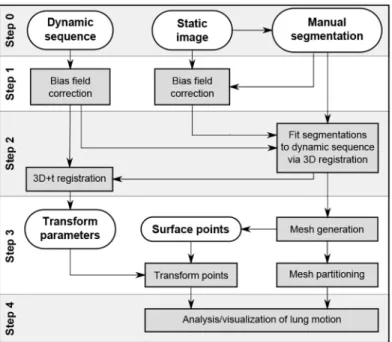
Fig 1shows a schematic overview of the proposed image processing pipeline. The main framework can be divided into four steps: preprocessing, deformation field estimation, lung surface partitioning, and motion analysis. The bash scripts for the first two steps as well as the MATLAB source code of the latter two steps are available upon request at [email protected] the following, all steps are presented in more detail.
Image preprocessing
The MRI images acquired in this study are affected by severe intensity inhomogeneity mostly due to the usage of surface coils (see video inS2 Video). Since motion estimation is performed via an intensity based registration approach in this framework, it is crucial to correct for this MRI artifact in order to correctly compute the motion of the diaphragm. Our framework uti-lizes the method N4ITK [45], an extension of the well-known inhomogeneity correction algo-rithm N3. The parameters of N4ITK, especially the spline distance, where finely tuned to obtain optimal results for the presented MRI acquisition setup. The parameter optimization resulted in the choice of two fitting levels (max. 500 iterations each) and an initial spline dis-tance, i.e. control point spacing, of 100 mm in spatial domain. For the correction of the dynamic scans two control points were used in the time dimension. The initial results could further be considerably improved by developing an iterative approach to generate masks that define the image regions from which the bias field is estimated. The mask includes the body but excludes all air-filled regions, specifically the lungs and the image background. To generate
Fig 1. Overview of the image analysis pipeline.The gray boxes present the general steps necessary to process the input images (dynamic sequence, static image and manual segmentation of the static image) and to derive motion and geometry features of the diaphragm and lung surface.
such masks, the image is thresholded using Otsu’s method [46] and the intensity bias field is computed using only the bright regions. The resulting image with reduced intensity inhomoge-neity is then thresholded again to obtain a new, more accurate, mask. In the next iteration this new mask is used to correct the original image with the N4ITK algorithm. Three iterations were used, as visual inspection showed that more than three iterations produced no further improvement, and the resulting images were of sufficient quality for the next image processing steps. During bias field correction of the static scans, the corresponding manually generated lung mask was subtracted from the mask obtained via Otsu’s method.
Motion estimation
The motion of the lungs in a dynamic sequence was estimated via 3D+t groupwise non-rigid registration as described by Metz et al. [42] using Elastix 4.7 [47]. The underlying deformation model uses a four-dimensional free-form B-spline that provides smoothness in the three spatial dimensions and in the time dimension. All 3D volumes of a sequence are aligned in an implic-itly defined mean reference frame by minimizing the variance of intensity values over time. Registration was achieved using an adaptive gradient descent optimizer and a multi-resolution scheme with four resolution levels. Besides the B-spline grid spacing of the estimated transfor-mation, all default values of the method described in [42] were used. The exact values of the chosen grid configuration are presented in the results section and the parameter files utilized by Elastix are provided inS1 File.
In order to restrict the registration to use image information in and around the lung, a lung mask was created in the following manner: The manual segmentations of the static full-inspira-tion and full-expirafull-inspira-tion scans,Ms
inandMsex(withsreferring to the static scans), were non-rig-idly registered onto thefirst and last frames of the dynamic sequence respectively. Mutual information and a 4-level coarse-to-fine pyramid approach with afinal B-spline spacing of 50 × 50 × 50 mm was used, resulting in the masksMd
1 andM
d
T(withdreferring to the dynamic scans, 1 denoting thefirst andTthe last frame). The union of the two binary masks was then dilated by 50 mm.
The above explained 3D+t non-rigid registration of the dynamic sequence estimates the B-spline coefficient vectors of the so-calledforward(B-spline) transformation, which transforms each 3D volume to a mean reference frame. Additionally, aninversetransformation has to be computed to transform volumes of the mean reference frame to any time point in the original coordinate system (see [42]). When bothforwardandinversetransformation are concatenated, a deformation field can be established which can be used to transform points or images of one specific time point, for instance the last frame (full-expiration), to any other time point.
Lung surface partitioning
All the hereafter presented methods are implemented in MATLAB (R2013b, MathWorks, Inc.). A lung surface mesh, consisting of a set of verticesVand a set of trianglesF, is obtained from the voxel-based full-expiration lung segmentationMd
T, by utilizing the CGAL 3.5 3D mesher (based on Delaunay refinement) which is accessed through the mesh processing toolboxiso2mesh[48]. The vertices of this 3D triangle mesh were propagated from the last time point to all other time points by applying the previously computed dense deformation
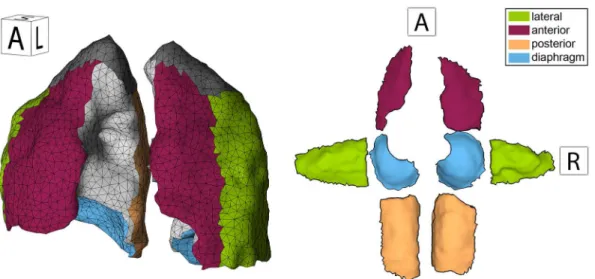
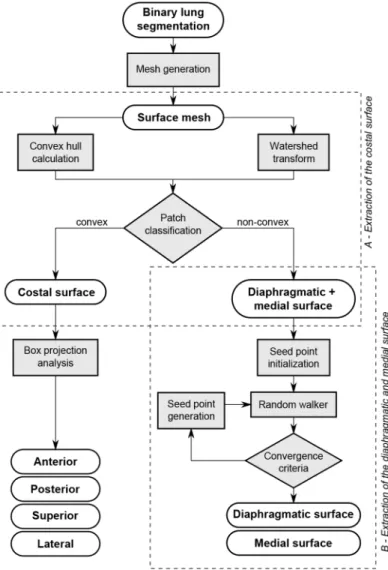
The main aim of our study was to assess the contribution of the different respiratory mus-cles during breathing. Therefore, chest wall and diaphragm motion were investigated sepa-rately by analyzing the movement of lung surface regions adjacent to the respective anatomical structures. To this end, the lung surface mesh at full exhalation was subdivided into three major subsurfaces (Fig 2, left) associated with the chest wall (anterior, posterior, lateral, and superior parts), mediastinum (medial parts adjacent to the heart), and diaphragm (inferior part). This subdivision is achieved, for each individual lung, in the two steps illustrated inFig 3 and detailed as follows.
Extraction of the costal surface. The extraction of the lung surface region adjacent to the chest wall, called costal surface, is based on the main anatomical observation that it is the only large surface area which is convex. Both the diaphragmatic and medial lung surface regions are non-convex due to the adjacent organs (heart and liver respectively). A watershed algorithm [49] is applied to the whole mesh in order to generate a subdivision into patches (watershed basins), where each patch has a relatively homogeneous curvature and nodes with high curvature (i.e. sur-face ridges) only lie on the boundary between patches. The maximal principal curvature of the surface, which is computed at each vertex of the mesh, serves as base feature for the watershed algorithm. The costal surface is extracted by merging the patches which have a small distance (at least one quarter of its triangles closer than 10 mm) to the convex hull of the lung.
For visualization purposes the costal surface is further subdivided into anterior, posterior, superior and lateral parts, based on which of the six faces (anterior, posterior, lateral, medial, superior, inferior) of the lung’s bounding box are intersected by the triangles normal vectors.
Extraction of the diaphragmatic and medial surface. Due to the high inter-subject vari-ability of lung and heart shape and size, the differentiation between medial and diaphragmatic lung surface is inherently difficult. A flexible and robust approach is the random walker strat-egy which was first described by Leo Grady [50] for interactive medical image segmentation. The random walker operates on arbitrary graphs consisting of a set of nodesPand a set of edgesE. Given seed nodes for each target region, it outputs a probability vector for each
non-Fig 2. Mesh representation of 3D lung segmentation.A 3D mesh of the lungs is presented in the left image. The surface is colored to distinguish between the different surface segments. On the right, the same mesh is shown after unfolding the individual surface segments into a plane. The orientation labels indicate the viewing direction.
seed node which expresses the probability that the node belongs to any of the specified target regions. The following four steps describe in detail how the random walker is applied to sepa-rate the medial from the diaphragmatic surface.
(1) Graph definition—A graph is constructed from the lung surface mesh, excluding the previously determined costal surface. Mesh triangle center points are used as graph nodes (pi2
P) and graph edges (eij2E) are established between adjacent triangles. After assigning labels to the graph nodes based on the presented procedure, node labels are transferred back to the cor-responding triangles of the original mesh.
(2) Edge weight computation—Each edgeeijof the graph is assigned a weightwijbetween 0 and 1 expressing the probability that nodepiandpjbelong to the same target region. The applied weight functionwij¼ expð d
2
ijÞuses a distance measurementdijwhich is adopted from Zhang et al. [51]. It takes the euclidean distance between the nodespiandpj, the deviation
Fig 3. Overview of the lung surface partitioning procedure.The diagram shows the individual steps to subdivide the surface mesh of a binary lung segmentation into six parts. In the two main parts the costal surface is extracted and the residual surface is divided into diaphragmatic and medial surface.
of their surface normalsniandnj, and the normal curvatureκpipjinto account:
dij¼w1jjpi pjjj þw2jjni njjj þw3fðkpipjÞ ð1Þ
The coefficientsw1,w2andw3are set according to [51]. Contrary to the adopted method where concave edges are considered relevant partition boundaries, in our case convex edges need to be emphasized:
fðkÞ ¼
(5k; k0
jkj; k<0
with normal curvaturek ð2Þ
(3) Initial seed node selection—The initial seed node selection is based on anatomical knowledge and the previously defined mesh patches from the watershed transform (see previ-ous section“Extraction of the costal surface”). After patch generation, patches are selected which can be assigned to one of the two target regions with high certainty. The most posterior patch can safely be assigned to the labeldiaphragmatic surface. The most superior patch and all patches which are at least partially occluded when viewed from a point centrally located below the lung are assigned to themedial surface. To further decrease the number of patches with an unknown membership, an unlabeled patch acquires the label of an adjacent patch if their nor-mals diverge less than 30°and if no high ridge separates the patches into different regions (based on average weightwij
between nodes of both patches). This procedure is repeated until no more patches can be labeled. In 15 out of 32 lung meshes, all patches were labeled, rendering the succeeding random walker step redundant. At last, a single seed node is obtained from every labeled patch by determining the graph node which is associated with the central triangle of the respective patch.
(4) Iterative random walker surface partitioning—Based on the edge weights defined in step (2) and initial seed nodes from step (3), the random walker algorithm is executed and the resulting probability maps are thresholded with high values (pdiaphragm>0.8 andpmedial>0.6) in order to derive a first partitioning of the diaphragmatic and medial surface. In the next itera-tion, seeds are randomly placed in the last-obtained partitions and added to the initial set of seed nodes. The iteration process is terminated when the partitions no longer change signifi-cantly (number of triangles is partition changed less than 3% to previous partition). Ultimately, the final partitioning results from assigning nodes withpdiaphragm>0.8 to the diaphragmatic surface and nodes withpdiaphragm0.8 to the medial surface.
Motion analysis and visualization
Using the deformation field and the partitioned surface of the lung, we extracted the following features to assess the motion of different respiratory muscles and highlight the diaphragmatic weakening caused by Pompe disease. All features listed below are extracted from both left and right lung separately.
Basic features. For each time pointt2[1..T] the volumeVðMd
tÞis computed from the lung mesh by using the method proposed in [52]. In addition to the time-dependent volume measurement, image-derived values for inspiratory volume (VðMd
1Þ), residual volume (B1:
VðMd
TÞ, also referred to as expiratory volume) and vital capacity (B2:VðMd1Þ VðM
d TÞ) were computed. Furthermore, the ratio between total lung capacity and residual volume (B3: VðMd
1Þ=VðM
d
TÞ) was determined.
wall. The CC size is defined by the vertical distance between the most superior point of the whole lung (lung apex) and the most superior point of the diaphragmatic surface (diaphragm apex). The AP size is defined as the distance between the most anterior point in the lung sur-face to the most posterior point in the AP direction. Time-dependent size measurements are derived by computing the CC and AP size of the lungs at each time pointt2[1..T]. Further-more, the increase in CC and AP size is computed (B4:CCðMd
1Þ=CCðM
d
TÞandB5:
APðMd
1Þ=APðM
d
TÞ) and the ratio between these two features (B6:B4/B5) is also reported.
Advanced features. Diaphragm and chest wall contribution can be measured by directly computing the volume displaced by the diaphragmatic surface and the costal surface. At first, the set of trianglesDFandCF, representing the diaphragmatic and costal surface respec-tively, are eroded by two triangle strips to eliminate unreliable measurements at the edges. The volume displaced by a single triangle f (f=4v1v2v32Fandvi2V) is obtained by computing the volume of the polyhedron that connects the vertices of the triangle at time pointtwith the vertices of the same triangle at time pointt+ 1. The polyhedron volume can be negative or pos-itive depending on whether the triangle moves in the direction of its normal vector or not. The volume displaced by the whole diaphragmatic surface between time pointstandt+ 1, denoted asDVt
D, is computed by accumulating the polyhedron volumes of all triangles inD:
DVt D¼
X
f2D
Vðvt
1v
t
2v
t
3v
tþ1 1 v
tþ1 2 v
tþ1
3 Þ ð3Þ
At last, the volume which is displaced during the entire breathing maneuver is obtained by summing the displaced volumesDVt
Dover all time points.
A1 : DV
D¼
XT
1
t¼1
DVt
D ð4Þ
The volume displaced by the costal surface,DVt
CandΔVC(A2), is computed in an analogous manner. Note that for inter-subject comparison, the featuresA1andA2are normalized based on the residual volume in order to compensate for differences between subjects (e.g. related to age, height and gender). Furthermore, we define the contribution of the diaphragm as:
A3 : DVD
DVCþDVD
ð5Þ
In literature it has been reported that in healthy subjects the cranial excursion of the dia-phragm is posteriorly greater than anteriorly. This especially applies to the right hemidiaph-ragm (half of the diaphhemidiaph-ragm) [53]. Excursion variations within the diaphragm have been observed with various imaging modalities, such as ultrasonography [18], fluoroscopy [53] and MRI [23,28]. In order to quantify anterior-posterior kinematic variations in our data, the mesh triangles of the diaphragmatic surfaceDwere divided into two groups based on their position at full-expiration. The mid-coronal plane of the lung bounding box was utilized as a threshold. Consequently, the maximum CC displacement of each triangle was calculated with respect to the full-inspiration state and a weighted average was computed for the anterior and posterior part separately, taking the triangle area into account. The ratio between mean ante-rior and posteante-rior diaphragm displacement was calculated for the diaphragmatic surface of the right lung (A5). The left lung was discarded from this analysis since a large portion of the left hemidiaphragm was missing due to the heart position. Additionally, the mean displacement of the whole diaphragmatic surface was reported (A4).
orientation (angle between normal vector and CC axis) is computed in the sagittal plane, using the triangle area as weights. Diaphragm orientation at full-inspiration (A6) and the largest signed difference between the orientation at the start of motion and any time point between start and end of motion (A7) were also obtained. The start and end of motion were defined as the time points at which 10% and 90% of the volume change was reached, respectively.
Visualization. A visual representation was developed to show the magnitude of displace-ment over the whole lung surface. To generate a 2D representation, the diaphragmatic sur-face and the anterior, posterior, left lateral and right lateral parts of the costal sursur-face were associated with the bottom, front, back, left and right side of a rectangular box respectively. Subsequently, the box was unfolded by rotating its sides into the bottom plane resulting in a 2D map which gives an overview of the entire lung surface (Fig 2, right). The maximum excursion of each point along one of the three major axes (LR, AP, CC) is visualized in color on the 2D surface maps. Thus, the eight displayed lung surface parts show the following type of movement:
• lateral lung surface parts: maximum excursion along LR axis (positive towards mid-sagittal plane),
• anterior/posterior lung surface parts: maximum excursion along AP axis (positive towards mid-coronal plane),
• diaphragm parts: maximum excursion along CC axis (positive in cranial direction).
Results
Motion estimation
Choice of registration parameters. For the B-spline based 3D+tforwardtransformation isotropic B-spline grid resolutions of 10, 20, 40 and 80 mm in spatial domain and a spacing of 1, 2, 3 and 5 frames in time domain were evaluated. The computed transformations were used to transform the manual segmentationsMd
1andM
d
Tof thefirst and last frame (respectively) to the mean reference frame. For every subject the Dice overlap scoring between both masks was computed and mean values and standard deviations were calculated for the whole population. A perfect overlap of both masks would result in a Dice score of 1. The results show that the best spatial resolution is 20 × 20 × 20 mm which gives a mean Dice overlap of 0.87 ± 0.015. How-ever, temporal spacing has very little effect on the deformationfields of thefirst and last frame (the only time-points with manual segmentations) and could not be optimized in this fashion. Visual inspection of the registration results showed that with a very large temporal spacing (e.g. 5 frames) the start and end of the main respiratory motion are not captured correctly. On the other hand, temporal smoothing is necessary to compensate for ghosting artifacts. A tem-poral spacing of 2 frames was chosen as a trade-off between accuracy and ghosting
compensation.
observations and is measured at full-expiration as:
ASEðf;gÞ ¼ jfðTÞ gðTÞj ð6Þ
and themean absolute residual error, that captures the variations once the systematic bias is removed:
MAREðf;gÞ ¼ 1
T
XT
t¼1
jðfðtÞ gðtÞÞ ðfðTÞ gðTÞÞj ð7Þ
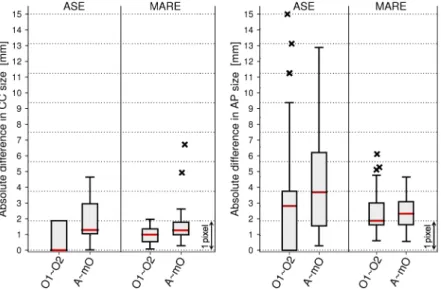
Fig 4shows the inter-observer difference and the difference between the computer aided method and the manual measurements. When determining the CC size at full-expiration, the two observers differ only marginally (mean 0.8 mm, median 0 mm) indicating that the dia-phragm edge is easily identifiable by a human observer. The highest point of the diaphragm is determined slightly differently for the automatic method compared to the manual annotation, which results in a median ASE of 1.3 mm (less than a voxel). In both comparisons the median MARE lies below one voxel (inter-observer: 1 mm, observers vs. automatic method: 1.3 mm). A paired, two-sided Wilcoxon signed rank test with significance level of 5% showed that there were statistically significant differences between the inter-observer variability and the manual vs. automatic error.
The exact and reliable identification of the anterior lung edge is much more difficult due to strong ghosting artifacts occurring at the chest region, resulting in a median inter-observer ASE of 2.8 mm. Median ASE between the automatic method and the observers was 3.7 mm. Median inter-observer MARE was computed as 1.9 mm and median MARE of mean observer vs. automatic method as 2.3 mm. For the AP size measurement, no significant difference was observed between the inter-observer error and the error between the automatic method and the mean observer (pASE= 0.26,pMARE= 0.41).
Fig 4. Deviation between manual and automatic lung size computation.The boxplots summarize the ASE and MARE error for CC (left plot) and AP (right plot) lung size measurements. Measurements are compared between observer 1 (O1), observer 2 (O2), mean of observer 1 and 2 (mO), and the automatic method (A). Median values are displayed as horizontal lines in the box, the box limits express the 25th and 75th percentile and outliers are plotted as crosses.
Motion features in health and disease
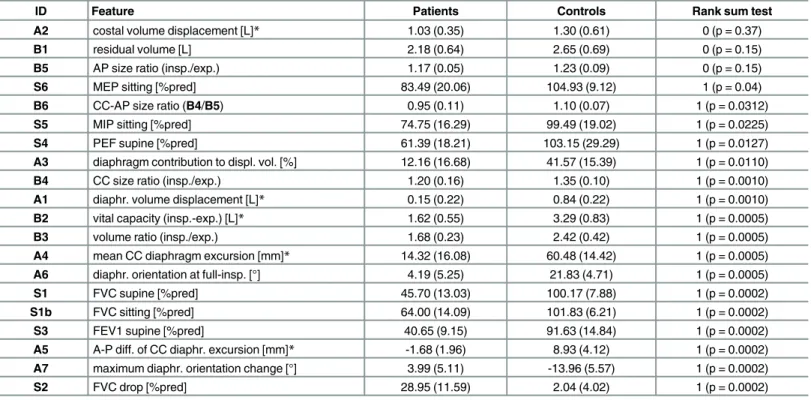
The extracted features were used to find differences between diseased and controls.Table 1 shows the detailed results for the proposed image-based features and the spirometry features. In patients where the diaphragm is severely affected by Pompe disease, almost no change in CC size (B4) can be observed during exhalation, indicating an impaired diaphragm. In 6 out of 10 patients the CC size at full-inspiration is less than 10% increased versus the full-expiration state. In contrast, 5 out of 6 controls show an increase in CC size of at least 30%. The increase of AP size (B5) is however not significantly different between patients and controls and ranges from 10% to 36%. This indicates that Pompe patients conserve the capabilities to partially inflate the lung using the chest muscles despite having an impaired diaphragm. The CC-AP-ratio (B6) shows that 5 out of 6 controls have a larger increase in CC than in AP size, while only 4 out of 10 patients present the same behavior.
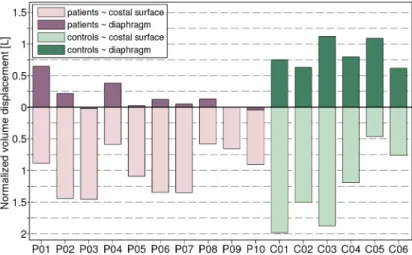
The volume that is displaced by the diaphragmatic surface and the costal surface is pre-sented both integrated over the whole maneuver (Fig 5), and as a time-dependent cumulative increase (Fig 6). In all but one subject (C05), the total volume displacement was higher for the costal surface (A2) than the (smaller) diaphragmatic surface (A1).Fig 5shows that in 8 out of 10 patients less than 217 ml were displaced by the diaphragm, whereas all controls displaced more than 617 ml. In contrast, the volume displaced by the costal surface is not significantly different between patients and controls, ranging from 581 ml to 1457 ml and 467 ml to 1986
Table 1. Comparison of spirometry- and image-based features.
ID Feature Patients Controls Rank sum test
A2 costal volume displacement [L]* 1.03 (0.35) 1.30 (0.61) 0 (p = 0.37)
B1 residual volume [L] 2.18 (0.64) 2.65 (0.69) 0 (p = 0.15)
B5 AP size ratio (insp./exp.) 1.17 (0.05) 1.23 (0.09) 0 (p = 0.15)
S6 MEP sitting [%pred] 83.49 (20.06) 104.93 (9.12) 1 (p = 0.04)
B6 CC-AP size ratio (B4/B5) 0.95 (0.11) 1.10 (0.07) 1 (p = 0.0312)
S5 MIP sitting [%pred] 74.75 (16.29) 99.49 (19.02) 1 (p = 0.0225)
S4 PEF supine [%pred] 61.39 (18.21) 103.15 (29.29) 1 (p = 0.0127)
A3 diaphragm contribution to displ. vol. [%] 12.16 (16.68) 41.57 (15.39) 1 (p = 0.0110)
B4 CC size ratio (insp./exp.) 1.20 (0.16) 1.35 (0.10) 1 (p = 0.0010)
A1 diaphr. volume displacement [L]* 0.15 (0.22) 0.84 (0.22) 1 (p = 0.0010)
B2 vital capacity (insp.-exp.) [L]* 1.62 (0.55) 3.29 (0.83) 1 (p = 0.0005)
B3 volume ratio (insp./exp.) 1.68 (0.23) 2.42 (0.42) 1 (p = 0.0005)
A4 mean CC diaphragm excursion [mm]* 14.32 (16.08) 60.48 (14.42) 1 (p = 0.0005) A6 diaphr. orientation at full-insp. [°] 4.19 (5.25) 21.83 (4.71) 1 (p = 0.0005)
S1 FVC supine [%pred] 45.70 (13.03) 100.17 (7.88) 1 (p = 0.0002)
S1b FVC sitting [%pred] 64.00 (14.09) 101.83 (6.21) 1 (p = 0.0002)
S3 FEV1 supine [%pred] 40.65 (9.15) 91.63 (14.84) 1 (p = 0.0002)
A5 A-P diff. of CC diaphr. excursion [mm]* -1.68 (1.96) 8.93 (4.12) 1 (p = 0.0002) A7 maximum diaphr. orientation change [°] 3.99 (5.11) -13.96 (5.57) 1 (p = 0.0002)
S2 FVC drop [%pred] 28.95 (11.59) 2.04 (4.02) 1 (p = 0.0002)
Evaluation of basic image features (B1—B6), advanced image features (A1—A7) and PFT features (S1—S6). Mean values and standard deviations are displayed for patients and controls separately. The two-sided Wilcoxon rank sum test (with 5% significance level) indicates significant differences between patient and control group. The table is sorted in descending order by p-value. Normalization with respect to residual volume was performed for features labelled with a star (*).
ml respectively. The contribution of the diaphragm to volume change (A3) is significantly smaller in patients than in controls. In patients, lung volume changes are thus strongly based on chest wall movement.Table 1presents further statistics for the featuresA1—A3.
InFig 6the changing orientation of the diaphragm dome is shown for three selected sub-jects. Both a representative patient (P03) and control (C02) are chosen as well as a patient with relatively good respiratory performance (P01). As seen in the example of subjectC02, the dia-phragm dome is tilted backwards at full-inspiration in healthy subjects. In the group of con-trols, the average diaphragm orientation (A6) was 22° ± 5° (range: 15°—29°). During exhalation the diaphragm rises and the posterior part of the muscle abuts the chest wall. The angle indicating diaphragm dome orientation thus decreases, resulting in a maximum orienta-tion difference (A7) of -14° ± 6° (range: -23°—-8°) in the healthy control group. In Pompe patients the mean orientation at full-inspiration was 4° ± 5° (range: -2°—17°). Compared to the healthy controls, the orientation change during exhalation behaved in the opposite manner for 8 out of 10 patients. On average, the maximum orientation change with respect to the start of exhalation was 4° ± 5° (range: -5°—10°). PatientsP04andP01showed characteristics of both groups (Fig 6). The course of diaphragm orientation was similar to healthy controls but dia-phragm orientation at full-inspiration was considerably reduced with respect to healthy subjects.
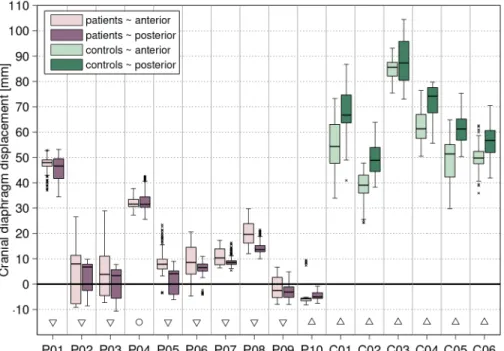
At last, the maximum craniocaudal excursion of diaphragm points was investigated. Aver-age cranial displacement (A4) in healthy controls was 61 mm (range: 51–81 mm) and 14 mm (range: -4–48 mm) in Pompe patients. The hypothesis that anterior and posterior part of the diaphragm move differently in patients and healthy controls (A5), was investigated for the right hemidiaphragm (Fig 7). In accordance with findings from literature, the median displace-ment was significantly larger in the posterior than in the anterior diaphragm part (difference in the range of 1.7–12.8 mm). The patient group presented the opposite behavior such that dis-placement is either in the caudal direction (P10,P09), no significant difference between ante-rior and posteante-rior diaphragm parts can be observed (P04), or the anterior part moves significantly more cranially than the posterior part (P01—P03,P05—P08).
Fig 5. Chest wall and diaphragm contribution to overall lung volume change.The bar plot shows the amount of volume displaced by the costal surface (upper bars) and diaphragm surface (lower bars) for all subjects. Patients (P01—P10) and controls (C01—C06) are sorted within their group in descending order with
respect to supine FVC (% of predicted).
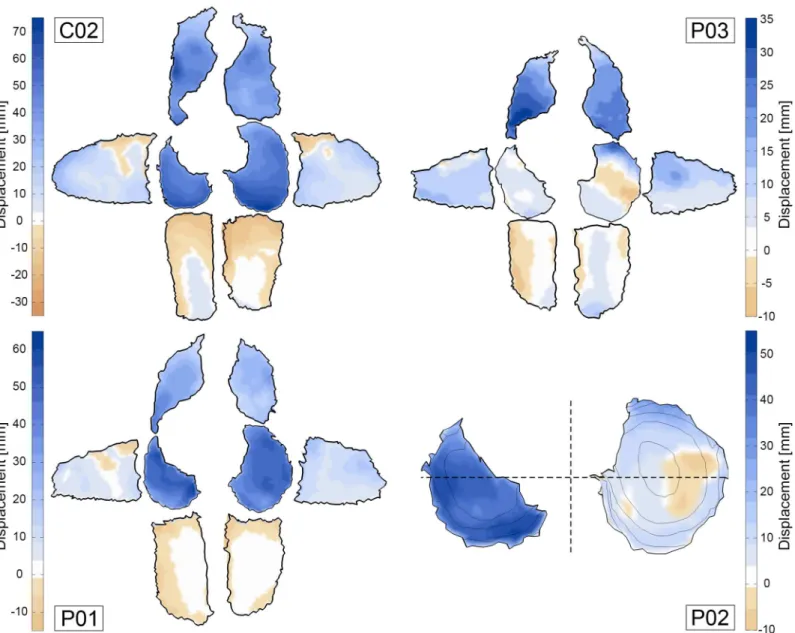
The 2D displacement maps inFig 8enable the visual investigation of maximal excursion in all relevant lung surface regions. Due to the supine position during the scan, the subjects back is resting on the scanner table which leads to a minimal movement of the posterior costal sur-face. The three displayed maps represent common motion patterns observed in the study pop-ulation. Patients with strongly reduced pulmonary function (e.g.P03) show less motion in the diaphragm parts than in the anterior costal surface. Even paradoxical motion can occur, which means that diaphragm points move caudally during exhalation (P03inFig 8). In healthy con-trols, the diaphragmatic surface displaces the most. Especially in the right hemidiaphragm a gradient can be observed with maximum displacement in the posterior and lateral parts, and less displacement in the anterior part. In patientP01, overall displacement of the diaphrag-matic surface is comparable with the healthy controls. However, the posterior parts in both left and right hemidiaphragm show less movement than the anterior parts.
Fig 6. Diaphragm orientation and volume displacement during exhalation.The orientation of the right diaphragm dome (black line: mean value, gray area: variance) is plotted for the exhalation maneuver of two patients (P01,P03) and a healthy control (C02). Start and end of motion are indicated by vertical, dotted lines. Frame-to-frame volume displacement (dashed red line: costal surface, dashed blue line: diaphragm surface) and total lung volume change (solid green line) are accumulated over the sequence and normalized with respect to total lung capacity.
MRI vs. PFT measurements
The relation between pre-scan spirometry features (S1—S6), basic image features (B1—B6) and advanced image features (A1—A7) was investigated by computing the Pearson correlation coefficient between all combinations of these features over the 16 subjects. The full matrix of significant correlation coefficients for every pairing of features is shown inS1 Fig. First, note that the spirometry features FVC and FEV1 highly correlate with each other (r = 0.95), indicat-ing that similar clinical conclusions can be drawn from both measurements. The residual vol-ume (B1) does not correlate well with any other features, likely because it is highly dependent on the subject’s gender, height and age. However, the image-derived volume ratio (B3: TLC/ RV) correlates well with FVC (r = 0.88), indicating that both features measure a similar aspect of pulmonary function.
The image-based features related to chest wall movement (B5,A2) correlated best with MIP (r = 0.67, r = 0.56). Compared to other spirometry features, only poor correlation was observed between MIP and features describing diaphragm motion (r0.65). Very high correlation (r = 0.94, r = 0.95, r = 0.97) was found between the image-derived features CC size ratio (B4), volume displaced by the diaphragm (A1) and mean CC diaphragm excursion (A4). All of these features use different computation methods, yet all express the overall diaphragmatic motion, revealing diaphragm impairment in Pompe patients (seeTable 1). Of the image-based features,
A1andA4correlate best with spirometry features. However,Table 1shows thatA5andA7
have better discriminative capabilities. This observation suggests that spirometry and image-based features capture different aspects of diaphragm weakness.
Fig 7. Cranial excursion of the right hemidiaphragm: anterior vs. posterior.The light and dark boxplots for each subject represent the cranial excursion of all points in the anterior and posterior part of the right diaphragm dome, respectively. Significant differences between anterior and posterior excursion are marked with triangles (down-pointing triangle: larger anterior excursion, up-pointing triangle: larger posterior excursion) and circles indicate no significant difference.
Discussion
With this study we showed that dynamic 3D MRI of the thorax is suitable to evaluate the func-tional interaction of respiratory muscles during breathing. Computer aided, quantitative analy-sis of diaphragm motion during slow exhalation was introduced to assess diaphragm weakness and characterize respiratory muscle involvement in patients with Pompe disease. Of the pro-posed features, diaphragm orientation and displacement difference between anterior and pos-terior parts of the diaphragm were the features with highest sensitivity to subtle
pathophysiological changes.
Fig 8. Maximum excursion of points on costal and diaphragm surface.The outer six segments of subjectsC02,P01andP03represent the left, right,
left/right-anterior and left/right-posterior parts of the costal surface. The maximum amplitude of surface excursion is measured in right, left, posterior and anterior direction, respectively. The left and right diaphragm surface segments of subjectsC02,P03,P01andP02display cranial excursion. Positive motion (towards lung center) is colored in blue. The dashed lines inP02indicate the separation line for the anterior-posterior comparison presented inFig 7.
Interpretation of results. In previous studies, PFT was performed in order to assess pulmo-nary function and involvement of respiratory muscles in Pompe patients [2,6,9]. Our image-based results indicate that at an early disease stage patients can compensate for diaphragm weakness with increased chest wall movement leading to relatively normal pulmonary func-tion. For instance, patientsP01andP02exhibit the highest supine FVC in the patient group (69% and 62% of predicted values respectively), however patientP02extensively uses rib cage expansion to maximally increase lung volume during inspiration as seen inFig 5.
The widely proposed analysis of CC and AP lung expansion [30,35,43,54,55] enables the assessment of general diaphragm and chest wall motion, though we experience that this method is not sensitive enough to detect early pathophysiological changes. For instance, patientP01and control subjectC02both present a CC lung size increase of 30% and compara-ble AP expansion of 17% and 21%, respectively. By evaluating the diaphragm orientation (Fig 6) and diaphragm displacement feature (Fig 8), moderate diaphragm weakness could be detected in patientP01. Note that all proposed image-based features can be obtained for left and right lung separately, e.g. revealing significant different elevation of right and left hemi-diaphragm in patientP02.
When interpreting the results of the diaphragm features one has to consider that only a part of the diaphragm, the diaphragm dome, can be evaluated with the presented procedure. In addition, according to Suwatanapongched et al. [56], diaphragm shape and position in sitting posture is also related to demographic and physiologic characteristics like weight, age and tho-racic dimensions. Gender dependent differences in lung volumes and diaphragm displacement have also been reported previously [19,57]. One should therefore take this normal variability into account when assessing diaphragm weakness based on geometry features. Furthermore, Kolar et al. [58] showed that diaphragm movement can be induced voluntarily and also non-related to breathing for spine stabilization. This aspect should be taken into account when selecting a breathing maneuver and instructing subjects during the scan.
Image acquisition procedures in comparison. Next to dynamic MRI, ultrasound has also been proposed as radiation-free technique to quantitatively evaluate diaphragm kinematics [19,20]. Some of the frequently presented advantages are its relatively low costs, portability, accessibility, applicability to a wider range of subjects and high temporal resolution. However, in order to assess kinematics of the respiratory system it is necessary to evaluate chest wall and diaphragm motion simultaneously and especially analyze diaphragm motion at defined loca-tions in a reproducible manner, which can be achieved with MRI.
Motion estimation and lung segmentation. Multiple strategies have previously been used to segment the lungs in dynamic and/or low resolution static MRI images. Most approaches, like in our pipeline, require the segmentation of a single frame and then adapt this segmenta-tion to fit other frames based on the deformasegmenta-tion fields obtained from deformable image regis-tration. In [34] the registration scheme was highly optimized to reduce computation time for tidal breathing sequences by reducing the amount of registrations between frames of very dif-ferent respiratory phases. The average Dice overlap between the automatic segmentations and ground truth was 0.96. The registration-based segmentation scheme has also been used to seg-ment the lungs in low resolution perfusion images by transforming automatically generated segmentations of high resolution structural images [36]. Comparison with manual segmenta-tions of the perfusion images resulted in a mean Dice overlap of 0.93 ± 1.23. With our pipeline we achieved a mean Dice overlap of 0.87 between the manual segmentation of the full-inhala-tion (first) frameMd
1 and the automatic segmentation of thefirst frame based on the
propaga-tion of the manual segmentapropaga-tion of the full-exhalapropaga-tion (last) frameMd
largest overlap error occurs in the area of the heart, the anterior chest wall and the costophrenic recess due to ghosting mainly appearing in these regions.
Motion and geometry features in healthy subjects. Studies investigating lung volume and lung dimension changes in healthy subjects between full expiration and full inspiration observed a volume increase of factor 2.5 [24] and 2.09 [35], compared to our observation of 2.42. The increase of craniocaudal/anteroposterior lung size was 1.24/1.18 [35], 1.43/1.27 [54] and 1.56/ 1.27 [29] which is also comparable to the values from our study (1.35/1.23). In literature, the con-tribution of the diaphragm to lung volume change has been estimated as 62.5% [30] and 60% [24] whereas our computations suggest a contribution of only 42% in healthy subjects. This is possibly due to different ways of computing the diaphragm contribution. The mean diaphragm excursion in absolute values varies considerably across studies, mostly due to different subject characteristics (especially gender) and different methods of measuring the displacement. Most studies were not spirometer-controlled which increases the dependence on the compliance of subjects. On average, women show less diaphragm excursion and the left hemidiaphragm moves less than the right. The average measurements obtained in our studies, i.e. 6.08 cm, lie in the range of reported values, 6.18 cm [19], 8.17 cm [31] and 8.27 cm [29], whereas the latter two studies only considered male subjects. Our results further confirm the main observation in healthy subjects that the diaphragm tilts backwards during inspiration due to the increased excursion of posterior parts of the diaphragm compared to anterior parts [23–25,28,30]. Similar to our study, Vostatek et al. [32] quantify this rotation by approximating the inclination of the manually traced diaphragm dome contour at maximum inspiration (tidal breathing maneuver). The mean inclination in the healthy groups of our study (21.83° ± 4.7°, based on 6 subjects) sup-port the measurements recently made in [32] (23.8° ± 7.1°, based on 16 subjects).
Image analysis in Pompe disease. Imaging methods have previously been used in the con-text of Pompe disease in order to characterize muscle involvement by grading the atrophy in high resolution structural MRI or CT images. In [14] significant trunk muscle involvement was observed except for intercostal muscles. Yet, patients with poorest respiratory function also fea-tured severe intercostal muscle impairment. Gaeta et al. [16] observed prominent diaphragm involvement in most of the patients whereas differences appeared between left and right hemi-diaphragm in half of the studied subjects. Abdominal muscles also showed involvement in many patients, yet intercostal muscles were less affected than other muscles. Based on these results, the reduced amplitude of diaphragm excursion observed in our study could be attrib-uted to both inspiratory and expiratory disabilities resulting from diaphragm and abdominal muscle involvement, respectively. The images in [16] also showed significantly reduced lung heights compared to healthy controls and a significant correlation between lung height and diaphragm atrophy grading can be deduced from the data in [16]. This observation supports our approach where diaphragm geometry and excursion are used as surrogate measurement for muscle involvement.
could not be investigated in [43] and [55] and the movement of different parts of the dia-phragm was not tracked and evaluated.
Limitations. The implemented pipeline currently requires an initial 3D segmentation of one time point of the dynamic scan. In this pilot study, manual segmentations of the static scan were utilized, though multiple publications show that automatic lung segmentation is feasible in 3D MRI [36,40] or CT [38,39,59]. Similarly to the manual step in our pipeline, automatic lung segmentation could be performed utilizing such methods in the high-resolution static scan. The segmentation can then be transformed to the dynamic sequence domain.
Due to the fact that an exhalation maneuver was analyzed in this study, the time-dependent features reflect the relaxation of the diaphragm and efforts of expiratory muscles (mostly abdominal and intercostal muscles) rather than the contraction of inspiratory muscles (dia-phragm and intercostal muscles). The proposed analysis should therefore also be applied to a tidal breathing and/or slow full inspiration maneuver, as differences between motion during inspiration and expiration can occur [31]. However, due to the spirometry-controlled scanning procedure used in this work, the frames showing full inspiration are considered to reliably pres-ent the state of maximum diaphragm contraction and calculated features can be used to com-pare to full exhalation frames.
Future work. MRI-based analysis presents a promising method which could be used to investigate the optimal start of treatment and to predict treatment response in late-onset Pompe disease. Further research, particularly with a larger and more diverse study population, is necessary to evaluate the whole spectrum of diaphragm involvement and select features which are most sensitive to subtle pathophysiological changes. This feature selection would also require a longitudinal study in order to evaluate their ability to track the disease state. Fur-thermore, reference values and patterns need to be established for average lung/diaphragm motion based on a larger population of healthy subjects in order to identify abnormal motion in Pompe patients. Future studies should also address the reproducibility of the MRI-based lung motion analysis regarding the breathing maneuvers and automatic image analysis. Both a tidal breathing maneuver and a slow inhalation maneuvers should be recorded in order to ana-lyze diaphragm contraction directly. The proposed methods are applicable to a large variety of medical cases where the diaphragm function itself, the effect of other conditions on the respira-tory muscles or general lung deformation needs to be investigated. Other areas of application for this kind of kinematic analysis are, for instance, other neuromuscular diseases affecting the diaphragm, congenital diaphragm hernia, chronic obstructive pulmonary disease, and adoles-cent idiopathic scoliosis.
Conclusion
Supporting Information
S1 Table. MRI acquisition parameters.For all MRI acquisitions a 3D SPGR sequence was used with the parameters as specified in the table.
(DOCX)
S2 Table. Spirometry- and image-based features of all study participants.The spreadsheet includes measurements from pulmonary function tests and image-based motion features for all patients and healthy controls.
(XLSX)
S1 Video. Dynamic MRI scan of a Pompe patient.The video shows a sagittal slice through the right lung of a Pompe patient during a slow exhalation maneuver.
(GIF)
S2 Video. Dynamic MRI scan of a healthy control.The video shows a sagittal slice through the right lung of a healthy control during a slow exhalation maneuver.
(GIF)
S1 Data. Lung meshes of a Pompe patient and a healthy control.The archive contains a STL file for every time point of the slow exhalation maneuver for a healthy control and a Pompe patient. The files are in VisCAM/SolidView format and contain the lung meshes including color information which indicates the different lung surface partitions.
(ZIP)
S1 Fig. Feature correlation matrix.The correlation matrix shows the Pearson correlation coefficient (ρ) for feature pairs with significant correlation (p<0.05). Cells with non-significant
correlation are rendered in plain white. (TIF)
S2 Fig. Diaphragm orientation diagrams for all study participant.Further explanations are contained inFig 6.
(PDF)
S3 Fig. Maximum excursion color maps for all study participant.Further explanations are contained inFig 8.
(PDF)
S1 File. Elastix parameter files.The archive contains the parameter files used to estimate the forward and inverse transformations. Both files are based on the parameter files which where introduced by Metz et al. [42] and published onhttp://elastix.bigr.nl/wiki/index.php/Par0012. (ZIP)
Author Contributions
Conceived and designed the experiments: PC APR HAWMT PAVD MDB ATVDP KM. Per-formed the experiments: PC KM. Analyzed the data: KM APR MDB. Contributed reagents/ materials/analysis tools: SCAW. Wrote the paper: KM APR MDB PC SCAW PAVD HAWMT ATVDP.
References
2. van der Beek NAME, van Capelle CI, van der Velden-van Etten KI, Hop WCJ, van den Berg B, Others. Rate of progression and predictive factors for pulmonary outcome in children and adults with Pompe disease. Molecular Genetics and Metabolism. 2011; 104:129–136. doi:10.1016/j.ymgme.2011.06.012 PMID:21763167
3. Pellegrini N, Laforet P, Orlikowski D, Pellegrini M, Caillaud C, Others. Respiratory insufficiency and limb muscle weakness in adults with Pompe’s disease. The European Respiratory Journal. 2005; 26:1024–1031. doi:10.1183/09031936.05.00020005PMID:16319331
4. Hagemans MLC, Winkel LPF, Van Doorn PA, Hop WCJ, Loonen MCB, Others. Clinical manifestation and natural course of late-onset Pompe’s disease in 54 Dutch patients. Brain. 2005; 128:671–677. doi: 10.1093/brain/awh384PMID:15659425
5. van der Beek NAME, de Vries JM, Hagemans MLC, Hop WCJ, Kroos MA, Others. Clinical features and predictors for disease natural progression in adults with Pompe disease: a nationwide prospective observational study. Orphanet Journal of Rare Diseases. 2012; 7(1):88. doi:10.1186/1750-1172-7-88 PMID:23147228
6. Mellies U, Ragette R, Schwake C, Baethmann M, Voit T, Teschler H. Sleep-disordered breathing and respiratory failure in acid maltase deficiency. Neurology. 2001; 57:1290–1295. doi:10.1212/WNL.57.7. 1290PMID:11591850
7. Güngör D, de Vries JM, Hop WCJ, Reuser AJJ, van Doorn PA, Others. Survival and associated factors in 268 adults with Pompe disease prior to treatment with enzyme replacement therapy. Orphanet Jour-nal of Rare Diseases. 2011; 6:34. doi:10.1186/1750-1172-6-34PMID:21631931
8. Angelini C, Semplicini C, Ravaglia S, Bembi B, Servidei S, Pegoraro E, et al. Observational clinical study in juvenile-adult glycogenosis type 2 patients undergoing enzyme replacement therapy for up to 4 years. Journal of Neurology. 2012; 259(5):952–958. doi:10.1007/s00415-011-6293-5PMID: 22081099
9. de Vries JM, van der Beek NAME, Hop WCJ, Karstens FPJ, Wokke JH, Others. Effect of enzyme ther-apy and prognostic factors in 69 adults with Pompe disease: an open-label single-center study. Orpha-net Journal of Rare Diseases. 2012; 7:73. doi:10.1186/1750-1172-7-73PMID:23013746
10. Ravaglia S, Pichiecchio A, Ponzio M, Danesino C, Garaghani KS, Others. Changes in skeletal muscle qualities during enzyme replacement therapy in late-onset type II glycogenosis: Temporal and spatial pattern of mass vs. strength response. Journal of Inherited Metabolic Disease. 2010; 33:737–745. doi: 10.1007/s10545-010-9204-5PMID:20844963
11. van der Ploeg AT, Clemens PR, Corzo D, Escolar DM, Florence J, Groeneveld GJ, et al. A randomized study of alglucosidase alfa in late-onset Pompe’s disease. The New England journal of medicine. 2010; 362(15):1396–1406. doi:10.1056/NEJMoa0909859PMID:20393176
12. Fromageot C, Lofaso F, Annane D, Falaize L, Lejaille M, Clair B, et al. Supine fall in lung volumes in the assessment of diaphragmatic weakness in neuromuscular disorders. Archives of Physical Medicine and Rehabilitation. 2001; 82:123–128. doi:10.1053/apmr.2001.18053PMID:11239298
13. Remiche G, Lo Mauro A, Tarsia P, Ronchi D, Bordoni A, Magri F, et al. Postural effects on lung and chest wall volumes in late onset type II glycogenosis patients. Respiratory Physiology and Neurobiol-ogy. 2013; 186:308–314. doi:10.1016/j.resp.2013.03.004PMID:23501539
14. Carlier RY, Laforet P, Wary C, Mompoint D, Laloui K, Others. Whole-body muscle MRI in 20 patients suffering from late onset Pompe disease: Involvement patterns. Neuromuscular Disorders. 2011; 21:791–799. doi:10.1016/j.nmd.2011.06.748PMID:21803581
15. Alejaldre A, Díaz-Manera J, Ravaglia S, Tibaldi EC, D’Amore F, Morís G, et al. Trunk muscle involve-ment in late-onset Pompe disease: Study of thirty patients. Neuromuscular Disorders. 2012; 22. doi: 10.1016/j.nmd.2012.05.011PMID:22980766
16. Gaeta M, Barca E, Ruggeri P, Minutoli F, Rodolico C, Others. Late-onset Pompe disease (LOPD): Cor-relations between respiratory muscles CT and MRI features and pulmonary function. Molecular Genet-ics and Metabolism. 2013 Jul; 110(3):290–296. doi:10.1016/j.ymgme.2013.06.023PMID:23916420 17. Verschakelen JA, Deschepper K, Jiang TX, Demedts M. Diaphragmatic displacement measured by
fluoroscopy and derived by Respitrace. Journal of applied physiology (Bethesda, Md: 1985). 1989; 67 (2):694–698.
18. Harris RS, Giovannetti M, Kim BK. Normal ventilatory movement of the right hemidiaphragm studied by ultrasonography and pneumotachography. Radiology. 1983; 146:141–144. doi:10.1148/radiology.146. 1.6849035PMID:6849035
19. Gerscovich EO, Cronan M, McGahan JP, Jain K, Jones CD, McDonald C. Ultrasonographic evaluation of diaphragmatic motion. Journal of ultrasound in medicine: official journal of the American Institute of Ultrasound in Medicine. 2001; 20:597–604.
21. Yang D, Lu W, Low DA, Deasy JO, Hope AJ, Others. 4D-CT motion estimation using deformable image registration and 5D respiratory motion modeling. Medical Physics. 2008; 35(10):4577–4590. doi:10. 1118/1.2977828PMID:18975704
22. Boldea V, Sharp GC, Jiang SB, Sarrut D. 4D-CT lung motion estimation with deformable registration: Quantification of motion nonlinearity and hysteresis. Medical Physics. 2008; 35(3):1008–1018. doi:10. 1118/1.2839103PMID:18404936
23. Gauthier A, Verbanck S, Estenne M, Segebarth C, Macklem P, Others. Three-dimensional reconstruc-tion of the in vivo human diaphragm shape at different lung volumes. Journal of Applied Physiology. 1994 Feb; 76(2):495–506. PMID:8175555
24. Cluzel P, Similowski T, Chartrand-Lefebvre C, Zelter M, Derenne J, Others. Diaphragm and Chest Wall: Assessment of the Inspiratory Pump with MR Imaging—Preliminary Observations. Radiology. 2000; 215(2):574–583. doi:10.1148/radiology.215.2.r00ma28574PMID:10796942
25. Takazakura R, Takahashi M, Nitta N, Murata K. Diaphragmatic Motion in the Sitting and Supine Posi-tions: Healthy Subject Study Using a Vertically Open Magnetic Resonance System. Journal of Mag-netic Resonance Imaging. 2004; 19:605–609. doi:10.1002/jmri.20051PMID:15112310
26. Tokuda J, Schmitt M, Sun Y, Patz S, Tang Y, Others. Lung motion and volume measurement by dynamic 3D MRI using a 128-channel receiver coil. Academic Radiology. 2009 Jan; 16(1):22–27. doi: 10.1016/j.acra.2008.07.021PMID:19064208
27. Plathow C, Schoebinger M, Herth F, Tuengerthal S, Meinzer HP, Others. Estimation of pulmonary motion in healthy subjects and patients with intrathoracic tumors using 3D-dynamic MRI: initial results. Korean Journal of Radiology. 2009; 10(6):559–567. doi:10.3348/kjr.2009.10.6.559PMID:19885311 28. Gierada DS, Curtin JJ, Erickson SJ, Prost RW, Strandt JA, Others. Diaphragmatic motion: fast
gradi-ent-recalled-echo MR imaging in healthy subjects. Radiology. 1995; 194:879–884. doi:10.1148/ radiology.194.3.7862995PMID:7862995
29. Suga K, Tsukuda T, Awaya H, Takano K, Koike S, Others. Impaired respiratory mechanics in pulmo-nary emphysema: Evaluation with dynamic breathing MRI. Journal of Magnetic Resonance Imaging. 1999; 10:510–520. doi:10.1002/(SICI)1522-2586(199910)10:4%3C510::AID-JMRI3%3E3.3.CO;2-7 PMID:10508317
30. Kondo T, Kobayashi I, Taguchi Y, Ohta Y, Yanagimachi N. A dynamic analysis of chest wall motions with MRI in healthy young subjects. Respirology. 2000; 5(1):19–25. doi:10.1046/j.1440-1843.2000. 00221.xPMID:10728727
31. Kiryu S, Loring SH, Mori Y, Rofsky NM, Hatabu H, Takahashi M. Quantitative analysis of the velocity and synchronicity of diaphragmatic motion: dynamic MRI in different postures. Magnetic Resonance Imaging. 2006; 24(10):1325–1332. doi:10.1016/j.mri.2006.08.009PMID:17145404
32. Vostatek P, Novák D, Rychnovský T, Rychnovská S. Diaphragm postural function analysis using mag-netic resonance imaging. PloS one. 2013; 8:e56724. doi:10.1371/journal.pone.0056724PMID: 23516397
33. Plathow C, Schoebinger M, Fink C, Ley S, Puderbach M, Others. Evaluation of Lung Volumetry Using Dynamic Three-Dimensional Magnetic Resonance Imaging. Investigative Radiology. 2005; 40(3):173–
179. doi:10.1097/00004424-200503000-00007PMID:15714092
34. Yang Y, Van Reeth E, Poh CL, Tan CH, Tham IWK. A Spatiotemporal-Based Scheme for Efficient Reg-istration-Based Segmentation of Thoracic 4-D MRI. IEEE Journal of Biomedical and Health Informatics. 2014 May; 18(3):969–977. doi:10.1109/JBHI.2013.2282183PMID:24058039
35. Chu WCW, Li AM, Ng BKW, Chan DFY, Lam Tp, Lam WWM, et al. Dynamic magnetic resonance imag-ing in assessimag-ing lung volumes, chest wall, and diaphragm motions in adolescent idiopathic scoliosis versus normal controls. Spine. 2006; 31(19):2243–2249. doi:10.1097/01.brs.0000232822.74349.32 PMID:16946662
36. Kohlmann P, Strehlow J, Jobst B, Krass S, Kuhnigk JM, Anjorin A, et al.. Automatic lung segmentation method for MRI-based lung perfusion studies of patients with chronic obstructive pulmonary disease; 2014.
37. Boon AJ, Harper CJ, Ghahfarokhi LS, Strommen JA, Watson JC, Sorenson EJ. Two-dimensional ultra-sound imaging of the diaphragm: Quantitative values in normal subjects. Muscle and Nerve. 2013; 47 (6):884–889. doi:10.1002/mus.23702PMID:23625789
38. Rangayyan RM, Vu RH, Boag GS. Automatic delineation of the diaphragm in computed tomographic images. Journal of Digital Imaging. 2008; 21(1):S134–S147. doi:10.1007/s10278-007-9091-yPMID: 18213486
40. Heimann T, Münzing S, Meinzer HP, Wolf I. A shape-guided deformable model with evolutionary algo-rithm initialization for 3D soft tissue segmentation. Information Processing in Medical Imaging. 2007 Jan; 20:1–12. doi:10.1007/978-3-540-73273-0_1PMID:17633684
41. Buerger C, Schaeffter T, King AP. Hierarchical adaptive local affine registration for fast and robust respiratory motion estimation. Medical Image Analysis. 2011; 15(4):551–564. doi:10.1016/j.media. 2011.02.009PMID:21454119
42. Metz CT, Klein S, Schaap M, van Walsum T, Niessen WJ. Nonrigid registration of dynamic medical imaging data using nD+t B-splines and a groupwise optimization approach. Medical Image Analysis. 2011 Apr; 15(2):238–249. doi:10.1016/j.media.2010.10.003PMID:21075672
43. Wens SC, Ciet P, Perez-Rovira A, Logie K, Salamon E, Wielopolski P, et al. Lung MRI and impairment of diaphragmatic function in Pompe disease. BMC Pulmonary Medicine. 2015; 15(1):1–7. doi:10.1186/ s12890-015-0058-3
44. Korosec FR, Frayne R, Grist TM, Mistretta CA. Time-resolved contrast-enhanced 3D MR angiography. Magnetic Resonance in Medicine. 1996; 36:345–351. doi:10.1002/mrm.1910360304PMID:8875403 45. Tustison NJ, Avants BB, Cook PA, Zheng Y, Egan A, Others. N4ITK: Improved N3 Bias Correction.
IEEE Transactions on Medical Imaging. 2010; 29(6):1310–1320. doi:10.1109/TMI.2010.2046908 PMID:20378467
46. Otsu N. A Threshold Selection Method from Gray-Level Histograms. IEEE Transactions on Systems, Man, and Cybernetics. 1979; 9(1):62–66. doi:10.1109/TSMC.1979.4310076
47. Klein S, Staring M, Murphy K, Viergever MA, Pluim JPW. Elastix: A toolbox for intensity-based medical image registration. IEEE Transactions on Medical Imaging. 2010; 29(1):196–205. doi:10.1109/TMI. 2009.2035616PMID:19923044
48. Fang Q, Boas DA. Tetrahedral mesh generation from volumetric binary and grayscale images. In: IEEE International Symposium on Biomedical Imaging; 2009. p. 1142–1145.
49. Beucher S, Lantuejoul C. Use of Watersheds in Contour Detection. In: International Workshop on Image Processing: Real-time Edge and Motion Detection/Estimation. Rennes, France; 1979. p. 12–21. 50. Grady L. Random walks for image segmentation. IEEE Transactions on Pattern Analysis and Machine
Intelligence. 2006; 28:1768–1783. doi:10.1109/TPAMI.2006.233PMID:17063682
51. Zhang J, Zheng J, Cai J. Interactive Mesh Cutting Using Constrained Random Walks. IEEE Transac-tions on Visualization and Computer Graphics. 2011; 17(3):357–367. doi:10.1109/TVCG.2010.57 PMID:20421684
52. Zhang CZC, Chen TCT. Efficient feature extraction for 2D/3D objects in mesh representation. In: Pro-ceedings 2001 International Conference on Image Processing. vol. 3. Thessaloniki, Greece; 2001. p. 935–938.
53. Nason LK, Walker CM, McNeeley MF, Burivong W, Fligner CL, Others. Imaging of the Diaphragm: Anatomy and Function. RadioGraphics. 2012; 32(2):51–71. doi:10.1148/rg.322115127
54. Plathow C, Ley S, Fink C, Puderbach M, Heilmann M, Others. Evaluation of Chest Motion and Volume-try During the Breathing Cycle by Dynamic MRI in Healthy Subjects—Comparison With Pulmonary Function Tests. Investigative Radiology. 2004 Apr; 39(4):202–209. doi:10.1097/01.rli.0000113795. 93565.c3PMID:15021323
55. Gaeta M, Musumeci O, Mondello S, Ruggeri P, Montagnese F, Cucinotta M, et al. Clinical and patho-physiological clues of respiratory dysfunction in late-onset Pompe disease: New insights from a com-parative study by MRI and respiratory function assessment. Neuromuscular Disorders. 2015; 25 (11):852–858. doi:10.1016/j.nmd.2015.09.003PMID:26410244
56. Suwatanapongched T, Gierada DS, Slone RM, Pilgram TK, Tuteur PG. Variation in diaphragm position and shape in adults with normal pulmonary function. Chest. 2003; 123:2019–2027. doi:10.1378/chest. 123.6.2019PMID:12796184
57. Hankinson JL, Odencrantz JR, Fedan KB. Spirometric reference values from a sample of the general U.S. population. American Journal of Respiratory and Critical Care Medicine. 1999; 159:179–187. doi: 10.1164/ajrccm.159.1.9712108PMID:9872837
58. KolářP, Neuwirth J,Šanda J, Suchánek V, Svatá Z, Volejník J, et al. Analysis of diaphragm movement
during tidal breathing and during its activation while breath holding using MRI synchronized with spi-rometry. Physiological Research. 2009; 58:383–392. PMID:18637703