Plasma Proteome Biomarkers of
Inflammation in School Aged Children in
Nepal
Sun Eun Lee1*, Keith P. West, Jr.1, Robert N. Cole2, Kerry J. Schulze1, Parul Christian1, Lee Shu-Fune Wu1, James D. Yager3, John Groopman3, Ingo Ruczinski4
1Center for Human Nutrition, Department of International Health, Johns Hopkins Bloomberg School of Public Health, Baltimore, Maryland, United States of America,2Mass Spectrometry and Proteomics Facility, Department of Biological Chemistry, Johns Hopkins School of Medicine, Baltimore, Maryland, United States of America,3Department of Environmental Health Sciences, Johns Hopkins Bloomberg School of Public Health, Baltimore, Maryland, United States of America,4Department of Biostatistics, Johns Hopkins Bloomberg School of Public Health, Baltimore, Maryland, United States of America
Abstract
Inflammation is a condition stemming from complex host defense and tissue repair mecha-nisms, often simply characterized by plasma levels of a single acute reactant. We attempted to identify candidate biomarkers of systemic inflammation within the plasma proteome. We applied quantitative proteomics using isobaric mass tags (iTRAQ) tandem mass spectrome-try to quantify proteins in plasma of 500 Nepalese children 6–8 years of age. We evaluated
those that co-vary with inflammation, indexed byα-1-acid glycoprotein (AGP), a conven-tional biomarker of inflammation in population studies. Among 982 proteins quantified in
>10% of samples, 99 were strongly associated with AGP at a family-wise error rate of 0.1%.
Magnitude and significance of association varied more among proteins positively (n = 41) than negatively associated (n = 58) with AGP. The former included known positive acute phase proteins including C-reactive protein, serum amyloid A, complement components, protease inhibitors, transport proteins with anti-oxidative activity, and numerous unexpected intracellular signaling molecules. Negatively associated proteins exhibited distinct differ-ences in abundance between secretory hepatic proteins involved in transporting or binding lipids, micronutrients (vitamin A and calcium), growth factors and sex hormones, and pro-teins of largely extra-hepatic origin involved in the formation and metabolic regulation of extracellular matrix. With the same analytical approach and the significance threshold, sev-enty-two out of the 99 proteins were commonly associated with CRP, an established bio-marker of inflammation, suggesting the validity of the identified proteins. Our findings have revealed a vast plasma proteome within a free-living population of children that comprise functional biomarkers of homeostatic and induced host defense, nutrient metabolism and tissue repair, representing a set of plasma proteins that may be used to assess dynamics and extent of inflammation for future clinical and public health application.
a11111
OPEN ACCESS
Citation:Lee SE, West KP, Jr., Cole RN, Schulze KJ, Christian P, Wu LS-F, et al. (2015) Plasma Proteome Biomarkers of Inflammation in School Aged Children in Nepal. PLoS ONE 10(12): e0144279. doi:10.1371/ journal.pone.0144279
Editor:Clark Chen, University of California, San Diego, UNITED STATES
Received:April 3, 2015
Accepted:November 13, 2015
Published:December 4, 2015
Copyright:© 2015 Lee et al. This is an open access article distributed under the terms of theCreative Commons Attribution License, which permits unrestricted use, distribution, and reproduction in any medium, provided the original author and source are credited.
Introduction
Inflammation is an evolutionarily conserved body response for protecting the host from poten-tially lethal stresses [1]. It is often understood as a process to isolate and eliminate pathogens or other non-self or intolerant agents by immune cells [2] followed by processes that resolve inflammation, repair damaged tissues and restore homeostasis [3]. However, when the transi-tion to tissue repair fails, inflammatory processes can persist and cause harm [4]. It is well doc-umented that chronic inflammation, often viewed as subclinical, contributes to chronic disease processes leading to obesity, diabetes, atherosclerosis, rheumatoid arthritis and cancer [4]. In addition, inflammation in response to continuous exposure to infectious agents [5–7] and envi-ronmental toxins [8,9] may contribute to childhood undernutrition and developmental defi-cits in impoverished areas of the world where poor sanitation and frequent infections are common.
An observable characteristic of inflammation is an increase or decrease in the release and concentration of certain proteins in the bloodstream, a process regarded as an acute phase reac-tion, although it can occur in response to either acute or chronic inflammatory stress [1]. At least 50 acute phase proteins (APP) are known to increase or decrease by at least 25% in humans, a commonly used cut-off, from their baseline concentrations during inflammation [10,11]. This quantitative alteration is mainly regulated by inflammatory mediators that induce reactions within innate and adaptive immune, neuroendocrine, vascular endothelial, hematopoietic, metabolic, and other defense and repair systems [10]. Due to these systemic effects, APPs are widely used as clinical diagnostic and prognostic indicators of disease pro-cesses [12]. Also, APPs are often recommended for use in population studies as correction fac-tors for assessing status with respect to micronutrients, whose indicator concentrations may decrease (e.g., serum retinol for vitamin A) or rise (e.g, serum ferritin for iron) with inflamma-tion [13–15]. Although large in number, only a few APP, primarilyα-1-acid glycoprotein
(AGP) and C-reactive protein (CRP), are typically assessed in population studies as indicators of inflammation [15]. This is because their responses and prognostic values are different and well-defined, with concentrations that reliably increase during infection, responding to numer-ous systemic infections and other pathological conditions, and decrease with resolution [10, 14,16]. Yet this nearly sole reliance on AGP and CRP may also, in part, be due to an incom-plete understanding of the many and varied molecular mediators and responders to inflamma-tion, a general inability to measure and interpret their responses to inflammatory stresses, limited resources to quantify multiple APPs, and a general lack of awareness in the public health research community of the highly varied dynamics of inflammation that coexist in populations.
The unbiased approach of plasma proteomics offers a unique opportunity to discover, quan-tify and explore the utility of a wider array of proteins that respond to, initiate, maintain and resolve inflammation. In a given population, all phases of the inflammatory response are likely to be present, highlighting the potential utility of accessing and interpreting a larger inventory of biomarkers with which to understand homeostatic mechanisms, disease processes, types of inflammation and the range of inflammatory exposures in an environment.
In this population study of 6–8 year old Nepalese children [17], we rely primarily on the cir-culating concentration of AGP to define inflammation as a continuous measure. AGP, or oro-somucoid (ORM), is present in plasma as a mixture of ORM1 and ORM2 each of which is encoded by two tandomly arranged genes,ORM1andORM2[18]. Because the concentration of AGP slowly rises and remains elevated during recovery or convalescence, AGP may be con-sidered more sensitive in detecting chronic and subclinical inflammation in populations than CRP, which tends to react, spike and resolve more quickly, and thus be less often detected in
Funding:This work was supported by: 1. The Bill and Melinda Gates Foundation, Seattle, WA, USA. Grants OPP5241 (Yiwu He, Senior Program Officer) and OPP614 (Ellen Piwoz, Senior Program Officer),
http://www.gatesfoundation.org/. 2. The Office of Health, Infectious Diseases and Nutrition, US Agency for International Development, Washington, DC. Grant number (HRN-A-00-97-00015-00),http://www. usaid.gov/who-we-are/organization/bureaus/bureau-global-health. 3. The Sight and Life Global Nutrition Research Institute, Baltimore, MD, USA,http://www. sightandlife.org/andhttp://www.jhsph.edu/ departments/international-health/news/dsm-sight-and-life.html. The funders had no role in study design, data collection and analysis, decision to publish, or preparation of the manuscript.
prevalence surveys [14]. We refer to the entire set of plasma proteins that definitively and quantitatively co-vary with AGP, as a“population plasma inflammasome”whose members may include but extend beyond classical acute phase proteins, contain proteins of hepatic ori-gin as well as those secreted or leaked from extra-hepatic tissues [19,20], and include proteins involved in constitutive and induced homeostatic immune, coagulative and repair processes associated with inflammation. We verify the reliability of this set of inflammatory proteins by repeating the same analysis using CRP, and evaluating overlap. We distinguish the compound term, population plasma inflammasome, from“inflammasome”, used to describe an intracellu-lar multiprotein complex that is responsible for activating the processing of pro-inflammatory cytokines [21]. While limited animal and human subject experimentations have described an endotoxin-induced plasma inflammasome and compilations of inflammatory plasma proteins from databases for clinical use exist in the literature [22–24], definition of a human population plasma inflammasome remains incomplete.
In this population sample [17], 31% and 6% of children exhibited elevated plasma concen-trations of AGP and CRP above conventional, clinical disease thresholds of 1g/L and 5 mg/L, respectively, reflecting a population affected by chronic inflammation [13] but not acutely ill, providing an opportunity to explore markers of low-grade (“subclinical”) inflammation that may nonetheless be useful for population assessment [25]. We hypothesized the existence of a quantifiable population plasma inflammasome, defined as a suite of plasma proteins tracking AGP with high confidence, which we verified by also evaluating their concordance of associa-tion with plasma CRP concentraassocia-tions.
Materials and Methods
Field study and assessment of inflammatory biomarkers
In 1999–2001, a community-randomized, placebo-controlled field trial was carried out in the District of Sarlahi, Nepal to assess effects of 4 combinations of antenatal supplemental micro-nutrients on birth outcomes [26]. Of 3,892 children exiting the trial as infants, 3,524 were fol-lowed-up at 6–8 years of age for a nutritional, health and socio-demographic assessment by methods previously described [27,28].
During home visits, children of consenting parents were asked to fast overnight, and phle-botomists collected venous blood samples the next morning from 94% (n = 3,305) of eligible children. Bio-specimens were brought to a field laboratory for plasma extraction. Plasma sam-ples were stored in liquid nitrogen tanks and shipped to the Center for Human Nutrition, Johns Hopkins Bloomberg School of Public Health in Baltimore, MD, USA. Among the plasma samples, 2,130 samples (64%) were selected based on having multiple plasma aliquots, com-plete epidemiologic data from both the original trial and follow-up assessment, and valid birth size measures (birth weight measured<72 hours after birth). Of the 2,130, 1,000 child plasma
Ethics statement
The original prenatal micronutrient supplementation trial was approved by the institutional review board (IRB) at Johns Hopkins University, Baltimore, MD, USA and the Nepal Health Research Council (NHRC) in Kathmandu, Nepal and registered with ClinicalTrials.gov: NCT00115271. The follow-up study with biospecimen collection was approved by the IRB and NHRC. During follow-up home visits, oral consent was obtained from mothers of eligible chil-dren after being explained the purpose, activities and risks of participation by trained field staff following an approved script. Oral consent was deemed appropriate due to high levels of illiter-acy in the study population. Consent was documented by field staff and entered into the study database.
Proteomics and data analysis
Immuno-depletion and proteomics assays have been previously described [17]. Briefly, a mas-ter plasma pool was prepared by combining plasma aliquots of 25μL from each of the 1,000 samples comprising the micronutrient archive. The 500 specimens selected for proteomics analysis each comprised 40μL of plasma. Individual specimens plus master pool aliquots were depleted of six high abundance proteins (albumin, transferrin, IgG, IgA, anti-trypsin, and hap-toglobin) using a Human-6 Multiple Affinity Removal System LC column (Agilent Technolo-gies). Proteomics analysis was performed at the Proteomics and Mass Spectrometry Core within the Johns Hopkins School of Medicine. Immno-depleted samples (100μg of protein) were digested overnight with trypsin (Promega, sequencing grade). Peptide samples of 7 indi-viduals and one masterpool sample were randomly labeled with 8-plex Isobaric Tag for Rela-tive and Absolute Quantification (iTRAQ) reagents that contained different reporter ions which can be used as measures of peptide relative abundance in the original sample. The com-bined sample was fractionated into 24 fractions by strong cation exchange chromatography. iTRAQ-labeled peptides were loaded on to a reverse-phase nanobore column. Eluted peptides were sprayed into an LTQ Orbitrap Velos mass spectrometer (Thermo Scientific) and inter-faced with a NanoAcquity ultra-HPLC (Waters). Full MS scans and fragmented MS/MS scans were acquired and these spectra were searched against Refseq 40 protein database using MAS-COT (Matrix Science v2.3) through Proteome Discoverer software (v1.3, Thermo Scientific). Peptides were identified with a confidence threshold of<5% false discovery rate. A total of 72
iTRAQ experiments were performed for this study.
Observed sample sizes were different among proteins due to missing values from the mass-spectrometry [32]. We report summary statistics for the association between plasma protein abundance and AGP as percent change in AGP per 2-fold (100%) increase in protein relative abundance (derived from the slope of the LME model) and its statistical significance (p-value), and the correlation between estimated absolute protein abundance and plasma AGP concentration. We controlled the family-wise error rate (FWER) at the 0.1% level using a Bon-ferroni correction, to only select proteins truly associated with AGP (P<1.02e-06). We also
present in Supporting Information, proteins passing a false discovery rate threshold of 1% (q<0.01).
Additional analyses were conducted to examine the validity of the identified proteins. Spe-cifically, we applied the same analytical approach and significance threshold to identify, quan-tify and evaluate the direction and strength of association between plasma protein relative abundance and CRP concentration. In addition, we identified differentially abundant proteins between children who reported at least one day of symptomatic morbidity (fever, diarrhea, pro-ductive cough, or rapid breathing) and children without any symptoms in the week prior to blood sampling. All CRP and morbidity-related results are presented in Supporting Informa-tion tables.
Since we expected that proteins associated with AGP might be co-regulated or co-vary in the same biological systems, we examined relationships between proteins by constructing a correlation matrix and performed principal component analysis (PCA). Pairwise protein:pro-tein correlation coefficients were calculated within each iTRAQ experiment and averaged coef-ficients across iTRAQ experiments to construct a correlation matrix and to perform PCA. Bi-plots were constructed to visualize the 1st, 2nd, and 3rdprincipal components of each protein from PCA [33].
Corresponding gene symbols of protein genInfo identifier (gi) numbers were derived from the Human Genome Organisation (HUGO) gene annotation and used in tables and figures, once linked to protein names in initial descriptive tables, to conserve space [34]. Resources of general description of proteins including cellular compartment, biological/molecular functions, and mRNA expression across tissues were extracted from the NCBI protein database, UniProt beta, Gene ontology Annotation (Uniprot-GOA) database, BioGPS, COMPARTMENTS, and in-depth review of literature [35–39].
All analyses were performed using the R Environment for Statistical Computing (version 3.1.0; R Foundation for Statistical Computing, Vienna, Austria).
Results
Study participant characteristics
Demographic, nutritional, and health characteristics of study children (Table 1) were similar to children in the original, larger follow-up cohort [28]. Children were undernourished, com-pared to the WHO reference population, reflected by prevalence rates of 40%, 15%, and 50% for stunting, thinness, and underweight. More than half and approximately 30% of children consumed dairy food and dark green leafy vegetables equal to or greater than 3 times in the past week, respectively, but meat, fish, and eggs were less frequently consumed by children. Approximately 8% of children reported at least one episode of fever in the past week, but the prevalence of other symptoms was low (<5%). Fourteen percent of children reported any
symptoms of fever, diarrhea, productive cough, or rapid breathing in the past week. Median (interquartile range) of plasma AGP and CRP concentrations were 0.84 (0.70, 1.05) g/L and 0.28 (0.13, 0.78), with 30% and 6% of children having an elevated AGP concentration (>1 g/L)
Plasma proteins associated with AGP
A total of 3,933 proteins were identified and quantified among 72 iTRAQ experiments required to analyze the 500 child plasma samples, of which 982 proteins were quantified in>10% of all
samples (n>50). Ninety-nine proteins (~10% of all proteins adequately quantified)
signifi-cantly co-varied with plasma AGP passing a Bonferroni corrected significance level, of which 41 and 58 proteins were positively and negatively associated with AGP, respectively. Among Table 1. Demographic, nutritional, and health characteristics of 6–8 year old children in rural Nepal
(n = 500).a
Characteristics Values
Age, years 7.5 (0.4)
Girls, % 50.2
Ethnicity (Pahadi), % 31.8
Anthropometric measurementsb
Height, cm 114.1 (5.8)
Weight, kg 18.2 (2.2)
BMI, kg/m2 14.0 (1.0)
Mid-upper arm circumference, cm 15.4 (1.1)
Height-for-age -1.77 (0.95)
BMI-for-age -1.20 (0.89)
Weight-for-age -1.99 (0.85)
Stunted, %c 39.1
Thin, %c 16.4
Underweight, %c 48.5
Dietary,3 intake in the past week, %
Dairy 56.6
Meat 8.6
Fish 9.0
Eggs 2.2
Dark green leafy vegetables 32.4
Morbidity, symptoms reported in the past week, %
Fever 8.2
Diarrhea 3.2
Productive cough 3.8
Rapid breathing 2.8
Any of above symptoms 14.0
Plasma Concentration of AGP
AGP, g/L 0.84 (0.70, 1.05)d
AGP>1.0 g/Le, % 29.8
CRP, mg/L 0.28 (0.13, 0.78)d
CRP>5.0 mg/Le, % 6.0
Abbreviations: AGP,α-1-acid glycoprotein; BMI, body mass index; CRP, C-reactive protein. aValues are means (SD) or percentages (95% CI).
bOne outlier was excluded (n = 499).
cZ-scores were calculated based on World Health Organization reference for 5
–19 years. Underweight, weight-for-age Z-score<-2; stunted, height-for-age Z-score<-2; thin, BMI-for-age Z-score<-2 [40]. dMedian (Interquartile range).
eCut-off for in
flammation [41].
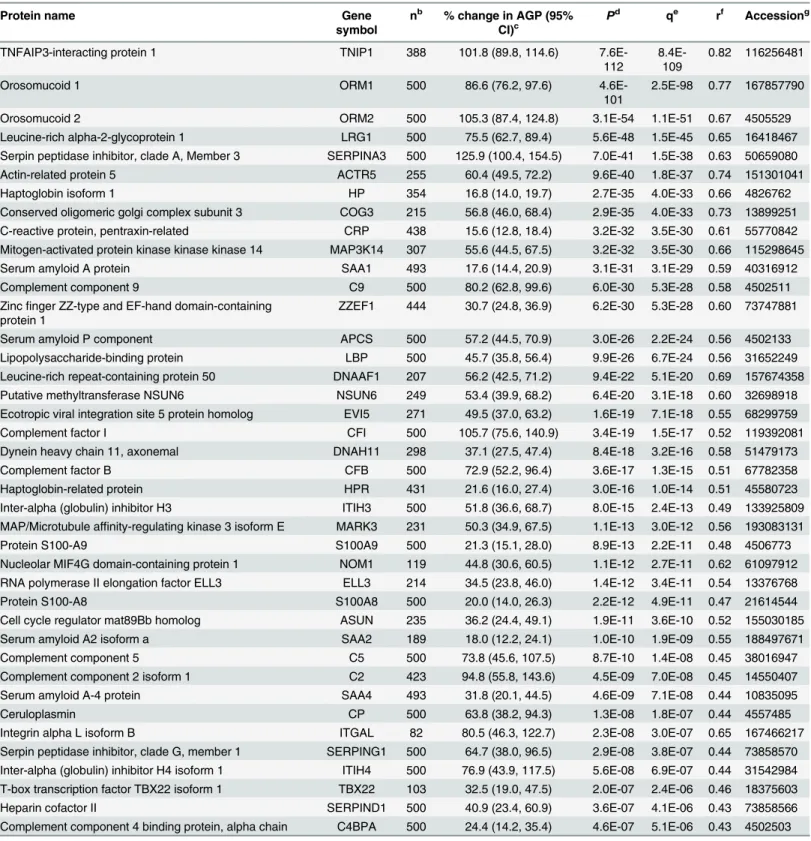
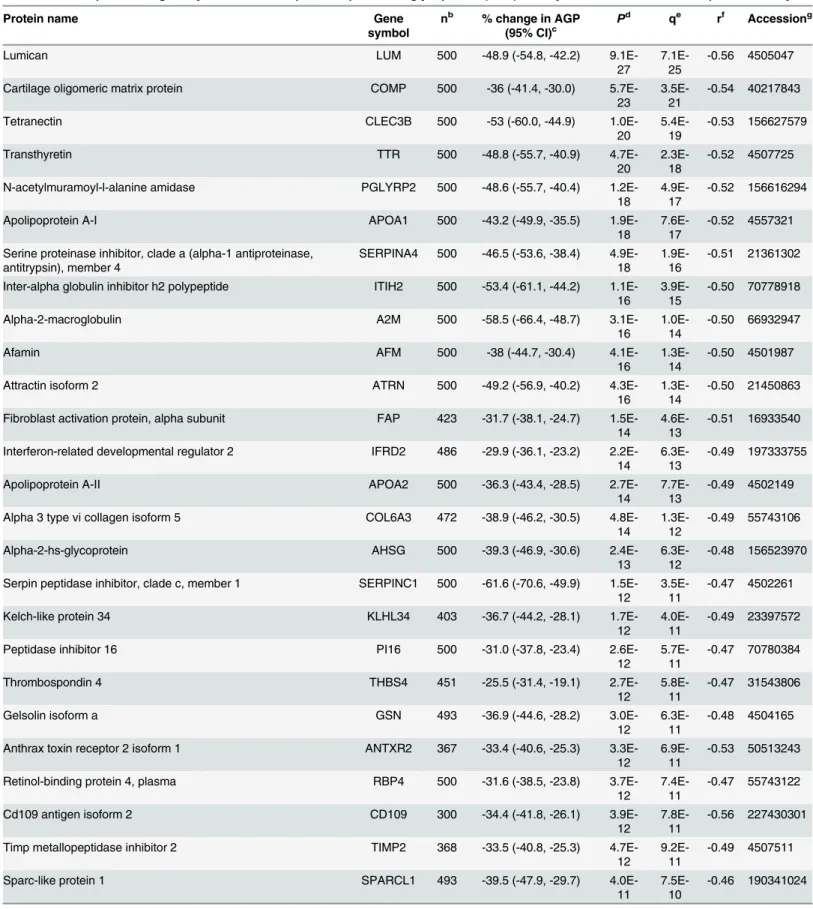
proteins positively associated with AGP, TNFAIP3 interacting protein 1 (Gene symbol: TNIP1) (P= 7.6x10-112) and orosomucoid 1 (ORM1) (P= 4.6x10-101) showed the strongest associations, followed by orosomucoid 2 (ORM2) (P= 3.1x10-54) (Table 2). Lumican (LUM) (P= 9.1x10⁻²⁷) and cartilage oligomeric matrix protein (COMP) (P= 5.7x10⁻²³) were most strongly associated among negative correlates (Table 3). A volcano plot shows distinct patterns within the population plasma inflammasome (Fig 1A–1C). Specifically, the percent change in AGP (95% confidence intervals) and strength of significance of association varied more widely within the group of positively than negatively associated proteins. A 86.6 (76.2, 97.6)% and 105.3 (87.4, 124.8)% increase in AGP concentration was associated with a 100% (two-fold) increase in relative abundance of ORM1 and ORM2, respectively (Fig 1C). A comparable 73~105% increase in AGP was also associated with a 100% increase in complement compo-nents 2, 5, and 9 (C2/5/9) and complement factors F and I (CFB and CFI). On the other hand, a smaller 15~18% increase in AGP was associated with a 2-fold rise in other acute phase pro-teins such as CRP, haptoglobin (HP), and serum amyloid A 1 and 2 (SAA1/2) (Fig 1C). Overall, a narrower range in reduction in AGP, 20~40%, was associated with a 2-fold increase in the rel-ative abundance of 46 out of the 58 negrel-atively associated proteins (Fig 1A). A total of 206 plasma proteins passed a false discovery significance threshold of q<0.01 (~20% of all
ana-lyzed), representing a larger plasma proteome that appears to covary with plasma AGP, as listed in Supporting Information (S1andS2Tables).
Separate verification analyses identified 41 (S3 Table) and 40 (S4 Table) proteins that were positively and negatively associated with CRP, respectively, passing the same Bonferroni cor-rected significance level as applied to the AGP analysis, of which 72 proteins were associated with both AGP and CRP. The 9“non-overlapping”CRP-associated proteins (marked in red in S3andS4Tables) were still associated with AGP but less significantly (allP<0.003). In
addi-tion, 27 proteins were differentially abundant between children with at least one episode of any morbidity symptom (fever, diarrhea, productive cough or rapid breathing) and children with-out any symptoms, passing a false discovery significance threshold of q<0.01 (S5 Table). All
but one of the 27 proteins associated with morbidity symptoms were strongly correlated with AGP.
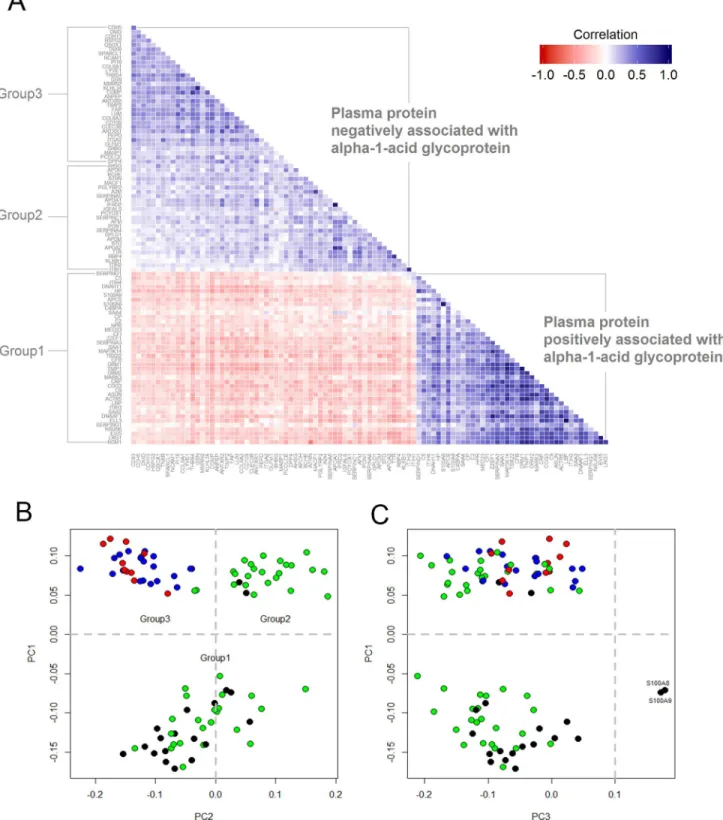
We anticipated that proteins positively and negatively associated with AGP would also be correlated with each other. The correlation matrix, shown inFig 2A, shows that plasma pro-teins positively associated with AGP were more highly correlated with each other (i.e., darker blue cells) than plasma proteins negatively associated with AGP (i.e., lighter blue cells). There were 83 and 5 protein-pairs, respectively, whose correlation coefficients (r) were greater than 0.6 within the positive and negative population plasma inflammasomes. Within the former, high correlations were observed among pairs involving ORM1-TNIP1-MAP3K14-CO-G3-ACTR5-NOM1 (all r>0.80), especially between LBP-ELL3 (r = 0.92), and LRG1-EVI5
(r = 0.86).
As expected, principal components (PC) analysis divided the population plasma inflamma-some into proteins that were positively (PC1<0, referred to as Group 1) and negatively
associ-ated with AGP (PC1>0). (Fig 2B). However, two subgroups further emerged among proteins
Table 2. Plasma proteins positively associated with plasmaα-1-acid glycoprotein (AGP) in 6–8 year old children in rural Nepal, ordered byP.a
Protein name Gene
symbol
nb % change in AGP (95% CI)c
Pd qe rf Accessiong
TNFAIP3-interacting protein 1 TNIP1 388 101.8 (89.8, 114.6)
7.6E-112
8.4E-109
0.82 116256481
Orosomucoid 1 ORM1 500 86.6 (76.2, 97.6)
4.6E-101
2.5E-98 0.77 167857790
Orosomucoid 2 ORM2 500 105.3 (87.4, 124.8) 3.1E-54 1.1E-51 0.67 4505529
Leucine-rich alpha-2-glycoprotein 1 LRG1 500 75.5 (62.7, 89.4) 5.6E-48 1.5E-45 0.65 16418467 Serpin peptidase inhibitor, clade A, Member 3 SERPINA3 500 125.9 (100.4, 154.5) 7.0E-41 1.5E-38 0.63 50659080
Actin-related protein 5 ACTR5 255 60.4 (49.5, 72.2) 9.6E-40 1.8E-37 0.74 151301041
Haptoglobin isoform 1 HP 354 16.8 (14.0, 19.7) 2.7E-35 4.0E-33 0.66 4826762
Conserved oligomeric golgi complex subunit 3 COG3 215 56.8 (46.0, 68.4) 2.9E-35 4.0E-33 0.73 13899251 C-reactive protein, pentraxin-related CRP 438 15.6 (12.8, 18.4) 3.2E-32 3.5E-30 0.61 55770842 Mitogen-activated protein kinase kinase kinase 14 MAP3K14 307 55.6 (44.5, 67.5) 3.2E-32 3.5E-30 0.66 115298645
Serum amyloid A protein SAA1 493 17.6 (14.4, 20.9) 3.1E-31 3.1E-29 0.59 40316912
Complement component 9 C9 500 80.2 (62.8, 99.6) 6.0E-30 5.3E-28 0.58 4502511
Zincfinger ZZ-type and EF-hand domain-containing protein 1
ZZEF1 444 30.7 (24.8, 36.9) 6.2E-30 5.3E-28 0.60 73747881
Serum amyloid P component APCS 500 57.2 (44.5, 70.9) 3.0E-26 2.2E-24 0.56 4502133
Lipopolysaccharide-binding protein LBP 500 45.7 (35.8, 56.4) 9.9E-26 6.7E-24 0.56 31652249 Leucine-rich repeat-containing protein 50 DNAAF1 207 56.2 (42.5, 71.2) 9.4E-22 5.1E-20 0.69 157674358 Putative methyltransferase NSUN6 NSUN6 249 53.4 (39.9, 68.2) 6.4E-20 3.1E-18 0.60 32698918 Ecotropic viral integration site 5 protein homolog EVI5 271 49.5 (37.0, 63.2) 1.6E-19 7.1E-18 0.55 68299759
Complement factor I CFI 500 105.7 (75.6, 140.9) 3.4E-19 1.5E-17 0.52 119392081
Dynein heavy chain 11, axonemal DNAH11 298 37.1 (27.5, 47.4) 8.4E-18 3.2E-16 0.58 51479173
Complement factor B CFB 500 72.9 (52.2, 96.4) 3.6E-17 1.3E-15 0.51 67782358
Haptoglobin-related protein HPR 431 21.6 (16.0, 27.4) 3.0E-16 1.0E-14 0.51 45580723
Inter-alpha (globulin) inhibitor H3 ITIH3 500 51.8 (36.6, 68.7) 8.0E-15 2.4E-13 0.49 133925809 MAP/Microtubule affinity-regulating kinase 3 isoform E MARK3 231 50.3 (34.9, 67.5) 1.1E-13 3.0E-12 0.56 193083131
Protein S100-A9 S100A9 500 21.3 (15.1, 28.0) 8.9E-13 2.2E-11 0.48 4506773
Nucleolar MIF4G domain-containing protein 1 NOM1 119 44.8 (30.6, 60.5) 1.1E-12 2.7E-11 0.62 61097912 RNA polymerase II elongation factor ELL3 ELL3 214 34.5 (23.8, 46.0) 1.4E-12 3.4E-11 0.54 13376768
Protein S100-A8 S100A8 500 20.0 (14.0, 26.3) 2.2E-12 4.9E-11 0.47 21614544
Cell cycle regulator mat89Bb homolog ASUN 235 36.2 (24.4, 49.1) 1.9E-11 3.6E-10 0.52 155030185
Serum amyloid A2 isoform a SAA2 189 18.0 (12.2, 24.1) 1.0E-10 1.9E-09 0.55 188497671
Complement component 5 C5 500 73.8 (45.6, 107.5) 8.7E-10 1.4E-08 0.45 38016947
Complement component 2 isoform 1 C2 423 94.8 (55.8, 143.6) 4.5E-09 7.0E-08 0.45 14550407
Serum amyloid A-4 protein SAA4 493 31.8 (20.1, 44.5) 4.6E-09 7.1E-08 0.44 10835095
Ceruloplasmin CP 500 63.8 (38.2, 94.3) 1.3E-08 1.8E-07 0.44 4557485
Integrin alpha L isoform B ITGAL 82 80.5 (46.3, 122.7) 2.3E-08 3.0E-07 0.65 167466217
Serpin peptidase inhibitor, clade G, member 1 SERPING1 500 64.7 (38.0, 96.5) 2.9E-08 3.8E-07 0.44 73858570 Inter-alpha (globulin) inhibitor H4 isoform 1 ITIH4 500 76.9 (43.9, 117.5) 5.6E-08 6.9E-07 0.44 31542984 T-box transcription factor TBX22 isoform 1 TBX22 103 32.5 (19.0, 47.5) 2.0E-07 2.4E-06 0.46 18375603
Heparin cofactor II SERPIND1 500 40.9 (23.4, 60.9) 3.6E-07 4.1E-06 0.43 73858566
Complement component 4 binding protein, alpha chain C4BPA 500 24.4 (14.2, 35.4) 4.6E-07 5.1E-06 0.43 4502503
Localization and functions of plasma proteins associated AGP
Proteins associated with AGP are summarized by their most often described cellular localiza-tion and biological or molecular funclocaliza-tions inTable 4. More than half of the proteins positively associated with AGP were primarily extracellular, secreted into circulation from the liver, and known to promote or regulate innate immune responses and inhibit oxidative activity. These included ORM1/2, CRP, SAA 1/2/4, bacterial lipopolysaccharide binding protein (LBP), LRG1 (a protein involved in granulocyte differentiation), components of the complement cascade, free hemoglobin scavengers, a copper-carrier, and several protease inhibitors. Other positively associated proteins are mainly localized in the membrane or intracellular space and involved in diverse functions, including leukocyte recruitment and trafficking, cell signaling, transcription, translation, DNA repair, protein methylation, modulation of cell cycle, cytokinesis and cyto-skeleton, and endoplasmic reticulum-Golgi vesicle transport.
About half of the proteins negatively correlated with AGP (i.e., that decline in relative abun-dance with inflammation) are also considered hepatic proteins released into the bloodstream, but more involved in transport and metabolism of nutrients and small molecules (e.g., RBP4 and TTR for vitamin A; apolipoproteins A1/A2/H/M for lipid or cholesterol transport and metabolism; and AHSG for calcium and phosphate metabolism), sex hormone and growth fac-tor binding (e.g., SHBG and IGFALS) or serine endopeptidase or proteinase inhibition in regu-lating blood coagulation and complement cascades, among other roles. Other negative
correlates are physical constituents of the extracellular matrix (ECM), including collagens [e.g, collagen types VIα1 and 3 (COL6A1, COL6A3)], glycoproteins, glucosaminoglycans and bone
matrix proteins. Proteins known to facilitate interaction between cells and ECM are aminopro-teinases/peptidases (e.g. PCOLCE and PEPD), protease inhibitors (e.g. TIMP2) and numerous cell-cell or cell-matrix adhesion molecules (e.g. CDH5 and ANTRX1).
Discussion
This study provides evidence of a population plasma inflammasome, defined in relation to the continuous distribution of an established biomarker of inflammation,α-1-acid glycoprotein.
We virtually ensured identification of nearly 100 plasma proteins associated with AGP by applying a stringent family-wise error rate threshold of 0.1%. Approximately three-quarters of the same proteins were similarly correlated with a second acute phase reactant in plasma, CRP. Study children in rural Nepal were undernourished, similar to many child populations in rural Asia, but were active and not acutely ill, with only 14% reporting any illness symptom in the previous week. As such, the set of proteins observed to covary with AGP can be inferred to Table 2. (Continued)
Protein name Gene
symbol
nb % change in AGP (95%
CI)c P
d qe rf Accessiong
Mediator of RNA polymerase II transcription subunit 23 isoform b
MED23 196 41.7 (23.2, 62.9) 8.6E-07 9.2E-06 0.48 28558969
aPlasma proteins that achieved a Bonferroni corrected signi
ficance level (P<0.001/982 = 1.02e-06). bThe number of child plasma samples of each listed protein (50<n500).
cPercent change (%) in plasma AGP per two-fold (100%) increase in relative abundance of protein. dPvalue for the hypothesis test of null association between plasma AGP and protein.
eAdjustedPvalue correcting multiple hypothesis testing (false discovery rate). fCorrelation between plasma AGP concentration and protein.
gGenInfo Identi
fier for protein sequence assigned by the National Center for Biotechnology Information.
Table 3. Plasma proteins negatively associated with plasma alpha-1-acid glycoprotein (AGP) in 6–8 year old children in rural Nepal, ordered byP.a
Protein name Gene
symbol
nb % change in AGP (95% CI)c
Pd qe rf Accessiong
Lumican LUM 500 -48.9 (-54.8, -42.2)
9.1E-27
7.1E-25
-0.56 4505047
Cartilage oligomeric matrix protein COMP 500 -36 (-41.4, -30.0) 5.7E-23
3.5E-21
-0.54 40217843
Tetranectin CLEC3B 500 -53 (-60.0, -44.9)
1.0E-20
5.4E-19
-0.53 156627579
Transthyretin TTR 500 -48.8 (-55.7, -40.9)
4.7E-20
2.3E-18
-0.52 4507725
N-acetylmuramoyl-l-alanine amidase PGLYRP2 500 -48.6 (-55.7, -40.4) 1.2E-18
4.9E-17
-0.52 156616294
Apolipoprotein A-I APOA1 500 -43.2 (-49.9, -35.5)
1.9E-18
7.6E-17
-0.52 4557321
Serine proteinase inhibitor, clade a (alpha-1 antiproteinase, antitrypsin), member 4
SERPINA4 500 -46.5 (-53.6, -38.4) 4.9E-18
1.9E-16
-0.51 21361302
Inter-alpha globulin inhibitor h2 polypeptide ITIH2 500 -53.4 (-61.1, -44.2) 1.1E-16
3.9E-15
-0.50 70778918
Alpha-2-macroglobulin A2M 500 -58.5 (-66.4, -48.7)
3.1E-16
1.0E-14
-0.50 66932947
Afamin AFM 500 -38 (-44.7, -30.4)
4.1E-16
1.3E-14
-0.50 4501987
Attractin isoform 2 ATRN 500 -49.2 (-56.9, -40.2)
4.3E-16
1.3E-14
-0.50 21450863
Fibroblast activation protein, alpha subunit FAP 423 -31.7 (-38.1, -24.7) 1.5E-14
4.6E-13
-0.51 16933540
Interferon-related developmental regulator 2 IFRD2 486 -29.9 (-36.1, -23.2) 2.2E-14
6.3E-13
-0.49 197333755
Apolipoprotein A-II APOA2 500 -36.3 (-43.4, -28.5)
2.7E-14
7.7E-13
-0.49 4502149
Alpha 3 type vi collagen isoform 5 COL6A3 472 -38.9 (-46.2, -30.5) 4.8E-14
1.3E-12
-0.49 55743106
Alpha-2-hs-glycoprotein AHSG 500 -39.3 (-46.9, -30.6)
2.4E-13
6.3E-12
-0.48 156523970
Serpin peptidase inhibitor, clade c, member 1 SERPINC1 500 -61.6 (-70.6, -49.9) 1.5E-12
3.5E-11
-0.47 4502261
Kelch-like protein 34 KLHL34 403 -36.7 (-44.2, -28.1)
1.7E-12
4.0E-11
-0.49 23397572
Peptidase inhibitor 16 PI16 500 -31.0 (-37.8, -23.4)
2.6E-12
5.7E-11
-0.47 70780384
Thrombospondin 4 THBS4 451 -25.5 (-31.4, -19.1)
2.7E-12
5.8E-11
-0.47 31543806
Gelsolin isoform a GSN 493 -36.9 (-44.6, -28.2)
3.0E-12
6.3E-11
-0.48 4504165
Anthrax toxin receptor 2 isoform 1 ANTXR2 367 -33.4 (-40.6, -25.3) 3.3E-12
6.9E-11
-0.53 50513243
Retinol-binding protein 4, plasma RBP4 500 -31.6 (-38.5, -23.8) 3.7E-12
7.4E-11
-0.47 55743122
Cd109 antigen isoform 2 CD109 300 -34.4 (-41.8, -26.1)
3.9E-12
7.8E-11
-0.56 227430301
Timp metallopeptidase inhibitor 2 TIMP2 368 -33.5 (-40.8, -25.3) 4.7E-12
9.2E-11
-0.49 4507511
Sparc-like protein 1 SPARCL1 493 -39.5 (-47.9, -29.7)
4.0E-11
7.5E-10
-0.46 190341024
Table 3. (Continued)
Protein name Gene
symbol
nb % change in AGP
(95% CI)c P
d qe rf Accessiong
Cadherin 5, type 2 CDH5 500 -34.1 (-41.9, -25.1)
1.1E-10
2.0E-09
-0.46 166362713
Olfactomedin related er localized protein isoform 1 OLFM1 465 -36.8 (-45.1, -27.2) 1.5E-10
2.6E-09
-0.47 17136143
Apolipoprotein M APOM 500 -33.8 (-41.7, -24.8)
1.9E-10
3.4E-09
-0.46 22091452
Anthrax toxin receptor 1 isoform 1 ANTXR1 339 -28.1 (-35.1, -20.4) 2.4E-10
4.1E-09
-0.49 14149904
Plasma serine protease inhibitor SERPINA5 500 -31.9 (-39.7, -23.1) 5.2E-10
8.8E-09
-0.45 194018472
Cadherin 13 CDH13 465 -34.4 (-42.6, -24.9)
7.6E-10
1.3E-08
-0.46 4502719
Tenascin xb isoform 1 TNXB 500 -29.5 (-37.1, -21.1)
1.2E-09
1.9E-08
-0.45 188528648
Dipeptidyl peptidase 4 DPP4 416 -35.3 (-43.9, -25.4)
2.0E-09
3.1E-08
-0.43 18765694
Cd93 antigen CD93 416 -28.2 (-35.8, -19.7)
4.9E-09
7.4E-08
-0.47 88758613
Xaa-pro dipeptidase isoform 1 PEPD 466 -31.2 (-39.4, -21.9)
6.5E-09
9.7E-08
-0.45 149589008
Microtubule-actin cross-linking factor 1, isoforms 1/2/3/5 isoform a
MACF1 430 -28.2 (-35.8, -19.6) 6.6E-09
9.7E-08
-0.47 33188445
Procollagen c-endopeptidase enhancer 1 PCOLCE 500 -35.3 (-44.2, -25.0) 6.7E-09
9.8E-08
-0.44 157653329
Prenylcysteine oxidase 1 PCYOX1 493 -27.1 (-34.5, -18.8)
7.7E-09
1.1E-07
-0.44 166795301
Sulfhydryl oxidase 1 isoform a QSOX1 500 -49.3 (-59.9, -36.0)
1.0E-08
1.5E-07
-0.44 13325075
Apolipoprotein H APOH 500 -29.6 (-37.7, -20.5)
1.5E-08
2.1E-07
-0.44 153266841
Integrin alpha 2 ITGA2 187 -33.7 (-42.5, -23.5)
1.6E-08
2.1E-07
-0.49 116295258
Membrane alanine aminopeptidase ANPEP 500 -35.2 (-44.5, -24.3)
4.0E-08
5.3E-07
-0.44 157266300
Inter-alpha (globulin) inhibitor h1 isoform a ITIH1 500 -41.2 (-51.3, -28.9) 4.0E-08
5.3E-07
-0.44 156119625
Biotinidase BTD 500 -35.5 (-44.9, -24.5)
4.2E-08
5.4E-07
-0.44 4557373
Insulin-like growth factor binding protein, acid labile subunit isoform 2
IGFALS 500 -23.7 (-30.7, -15.9) 4.3E-08
5.4E-07
-0.44 4826772
Phosphatidylinositol-glycan-specific phospholipase d isoform 1 GPLD1 500 -30.1 (-38.6, -20.5) 5.0E-08
6.3E-07
-0.44 29171717
Basement membrane-specific heparan sulfate proteoglycan core protein
HSPG2 493 -40.2 (-50.3, -28.0) 5.4E-08
6.7E-07
-0.43 126012571
Lymphatic vessel endothelial hyaluronic acid receptor 1 LYVE1 479 -22.9 (-29.8, -15.2) 6.8E-08
8.3E-07
-0.45 40549451
Butyrylcholinesterase BCHE 500 -31.4 (-40.3, -21.2)
8.9E-08
1.1E-06
-0.44 4557351
Osteomodulin OMD 465 -24.9 (-32.4, -16.5)
9.0E-08
1.1E-06
-0.47 4826876
Plasma kallikrein b1 KLKB1 500 -36.6 (-46.4, -25.0)
9.4E-08
1.1E-06
-0.44 78191798
Table 3. (Continued)
Protein name Gene
symbol
nb % change in AGP
(95% CI)c P
d qe rf Accessiong
Sex hormone-binding globulin isoform 1 SHBG 486 -19.6 (-25.9, -12.6) 2.3E-07
2.6E-06
-0.43 7382460
Multimerin-2 MMRN2 444 -26.3 (-34.5, -17.2)
2.7E-07
3.1E-06
-0.45 221316695
Mannan-binding lectin serine protease 1 isoform 2 MASP1 486 -26.6 (-34.8, -17.4) 2.9E-07
3.3E-06
-0.43 21264359
Paraoxonase 1 PON1 500 -21.1 (-28.0, -13.5)
3.7E-07
4.1E-06
-0.43 19923106
Neural cell adhesion molecule 1 isoform 3 NCAM1 453 -31.9 (-41.4, -20.8) 5.4E-07
5.8E-06
-0.45 115529478
Collagen, type vi, alpha 1 COL6A1 472 -24.3 (-32.2, -15.4)
7.9E-07
8.5E-06
-0.45 87196339
aPlasma proteins that achieved a Bonferroni corrected signi
ficance level (P<0.001/982 = 1.02e-06). bThe number of child plasma samples of each listed protein (50<n500).
cPercent change (%) in plasma AGP per two-fold (100%) increase in relative abundance of protein. dPvalue for the hypothesis test of null association between plasma AGP and protein.
eAdjustedPvalue correcting multiple hypothesis testing (false discovery rate). fCorrelation between plasma AGP concentration and protein.
gGenInfo Identi
fier for protein sequence assigned by the National Center for Biotechnology Information.
doi:10.1371/journal.pone.0144279.t003
Fig 1. Volcano plot of plasma proteins associated with plasmaα-1-acid glycoprotein (AGP) in 6–8 year old children in rural Nepal.Plot (A) and (C)
are enlarged rectangles in plot (B). (A) Plasma proteins negatively associated with AGP, presented by gene symbol (n = 58); (B) Plasma proteins associated with AGP were colored in red and blue (n = 99); (C) Plasma proteins positively associated with AGP, presented by gene symbol (n = 41). x- and y-axes are logarithmic.
Fig 2. Correlation matrix and bi-plots from principal components (PC) analysis using plasma proteins associated withα-1-acid glycoprotein in 6–8 year old children in rural Nepal.(A) Bottom-triangle is the correlation matrix of plasma proteins positively associated with AGP (Group1). Upper-triangle is the correlation matrix of plasma protein negatively associated with AGP (Group 2 & 3). (B and C) Bi-plot was constructed by the first three principle components. Color depicts representative tissue origins or subcellular localization of proteins: black-intracellular space; green-hepatic origin and secreted into plasma; red-extracellular matrix; blue-extracellular matrix membrane binding. Proteins with PC1 less than 0 were assigned into group 1, proteins with PC1 and PC2 greater than 0 were assigned into group 2, and proteins with PC1 greater than 0 and PC2 less than 0 were assigned into group 3 (4 proteins were not included due to missing values and lack of information about subcellular localization).
reflect homeostatic control of inflammation within the environment of this typical South Asian rural setting.
Positive plasma inflammasome proteins exhibited stronger associations with AGP and greater variation in their degree of change per unit difference in AGP concentration than nega-tively associated proteins, possibly reflecting higher metabolic priority and functional specific-ity. In addition to established acute phase proteins, our quantitative proteomics approach identified numerous intracellular signaling, membrane-bound, and extracellular matrix mole-cules not widely regarded as acute phase reactants, appearing to reflect a systemic repertoire of proteins that respond to inflammation.
Table 4. Cellular localizati4on and molecular/biological functions of plasma proteins associated withα-1-acid glycoprotein (AGP) in 6–8 year old children in rural Nepal.a
Association Cellular localization Molecular/biological function Protein
Positively associated with AGP (n = 40)
Extracellular (plasma) (n = 23)
Immune system ORM1/2, APCS, LBP, LRG1
Lipoproteins SAA1/2/4
Complement system C2/5/9, CFB, CFI, C4BPA, CRP Transport/scavenger protein HP/HPR, CP
Serine proteases inhibitor SERPINA3, SERPING1, SERPIND1, ITIH3/4 Extracellular (plasma
membrane) (n = 1)
Leukocyte-endothelial interaction ITGAL
Extra- & intra-cellular (n = 2) Leukocyte trafficking S100A8/9 Intracellular (n = 14) Regulation of cell signaling MAP3K14, TNIP1
Transcription and translation regulation, DNA/RNA binding
ELL3, NOM1, TBX22, MED23, NSUN6, ACTR5, MARK3
Cell cycle, Cell division, Mitosis EVI5, ASUN
Cytoskeleton DNAAF1, DNAH11
ER-Golgi vesicle-mediated transport COG3 Negatively associated with
AGP (n = 56)
Extracellular (plasma) (n = 25)
Transport RBP4, TTR, AFM, AHSG
Lipoproteins APOA1/2, APOH, APOM
Serine proteinase inhibitor SERPINA5, SERPINC1, A2M, SERPINA4, ITIH1/ ITIH2
Serine type endopeptidase KLKB1, MASP1
Other enzymes BCHE, PON1, BTD, PCYOX1, GPLD1
Inflammatory response ATRN
Growth factor/Hormone binding IGFALS, SHBG Peptidoglycan recognition PGLYRP2
Extracellular matrix (n = 11) Collagen COL6A1/3
Non-collagenous glycoprotein COMP, THBS4, TNXB, SPARCL1, MMRN2
Proteoglycan HSPG2, LUM
Bone matrix, mineralization CLEC3B, OMD Extracellular (plasma
membrane) (n = 20)
Aminoprotease or peptidase PCOLCE, PEPD, DPP4, FAP, ANPEP
Cell-cell/cell-ECM adhesion CDH13, CDH5, NCAM1, OLFM1, CD93, ANTRX1, ANTRX2, QSOX1, ITGA2 Cytoskeleton modulation GSN, MACF1
Peptidase inhibitor TIMP2, PI16, CD109
Hyaluronan receptor LYVE1
aProteins of unknown function were not presented (KLHL34, IFRD2, and ZZEF1).
Acute phase proteins, complement components, protease inhibitors and transport proteins with anti-oxidant activity positively covaried with plasma AGP, in accordance with their expected roles in responding to stress [1]. Many of these biomarkers are produced in the liver and secreted into plasma [10]. As AGP abundance in plasma is attributable to expression of homologousORM1 (AGP1)andORM2 (AGP2)genes [42], ORM1 and ORM2 were expected, and observed, to be among the strongest correlates of AGP (measured by radial immunodiffu-sion), offering evidence that mass spectrometry is a valid method to detect and quantify relative protein abundance. LRG1, HP, SERPINA3, CRP, SAA1, C9, and LBP were positively associated with AGP (allP<1.0x10⁻²⁵), suggesting these proteins increase in circulation during
inflam-mation [10]. Substantial variation in the strength of association with AGP likely reflects wide differences in expression across acute and chronic phase proteins [43–45]. It is likely that rises in complement components, LRG1 and SERPINA3 reflect a persistent inflammation that accompanies a modest elevation in AGP where exposure to parasites, bacteria [46–48] and environmental toxins, such as aflatoxin and arsenic, are common [49,50]. Positively associated proteins we observed are known to largely be involved in immune activation (e.g., CRP, SAA, LBP, and complement components), proteolytic attack processes (SERPINA3, SERPING1, and SEPRIND1), and transport of pro-oxidative metabolites (CP and HP) [44]. ORM1/2 and LRG1 are involved in immunomodulation and granulocyte differentiation, respectively, although their molecular roles have not been fully elucidated [51–53]. Collectively, our results suggest that hepatic-driven proteins that positively covary with inflammation are involved in host defense.
Fourteen of 41 positive correlates of AGP are intracellular proteins whose larger numbers of missing values (Table 2) support the notion that these proteins may be low in abundance, and leaked or secreted from tissues as part of normal metabolism and tissue maintenance. The strongest positive correlate (P= 7.6x10-112), sharing a nearly 1:1 association with AGP, was TNIP1, suggesting their co-regulation during inflammation, although no study to our knowl-edge has drawn this direct metabolic linkage. TNIP1 regulates inflammation by inhibiting cell signal transduction such as in the NF-kappa-B activation pathway [54]. However, unknown extracellular functions of TNIP1 leave its positive association with AGP in plasma unexplained. A 30~60% increase in AGP concentration was associated with a 100% increase in intracellular proteins involved in signal transduction, and protein transcription, translation, maturation and secretion. High correlations between intracellular proteins and circulating ORM1, LBP, and LRG1 suggest their abundance in plasma could reflect biosynthesis of inflammatory medi-ators [55], or act themselves as acute phase proteins.
Among proteins negatively correlated with plasma AGP, about half are known to transport and regulate bioavailability of nutrients and hormones. Correlations among these proteins were negligible, suggesting independent regulation and metabolic pathways, while still being susceptible to hepatic-directed reduction during inflammation [56]. Some negative correlates are components of lipoprotein particles, involved in anti-inflammation (APOA1/2), antioxi-dant functions (PON1, PON3, and PCYOX1) and reverse cholesterol transport (PLTP, CLU and LCAT) (allP<1.0x10⁻⁴). These observations coupled with those of increased abundance
in pro-inflammatory serum amyloid A (SAAs) apoliporoteins with AGP support considerable alterations in plasma lipoprotein composition during homeostatic regulation of inflammation [57]. RBP4, TTR, AHSG, and APOA1/2 are well-known negative acute phase proteins [10] that are consistent with known redistributions of vitamin A, calcium, phosphate and lipids dur-ing inflammation [57–60].
globulin (SHBG), insulin-like growth factor (IGF) acid labile subunit and IGF binding protein (BP) 3 (allP<1.0x10⁻⁵), consistent with expected reductions in insulin-like growth factor 1
and androgens during inflammation [10,61]. IGFALS and IGFBP3 form a ternary complex with most plasma IGFs which regulate somatic growth and development [62,63]. SHBG binds and regulates circulating androgens and estrogens [64]. Population studies have revealed inverse associations between SHBG and inflammatory markers and adiposity-related early onset of puberty among girls [65,66]. Observed inverse associations between AGP and hepatic proteins may reflect metabolic adaptation to altered endocrine signaling in response to inflammation.
Proteins that serve as components or regulators of the extracellular matrix (ECM) were neg-atively associated with inflammation [67]. Our PCA results revealed that variance in the abun-dance of these proteins differed from those of hepatic origin, possibly due to differences in intravascular concentration between classic plasma and extravascular proteins. Lumican (LUM), cartilage oligomeric matrix protein (COMP), tetranectin (CLEC3B), osteomodulin (OMD), and collagenα-1 and -3 type VI (COL6A1/3) are enriched in cartilage, bone matrix,
skeletal muscle and adipose tissues [68–72]. Beyond structural and functional components of ECM, many cell surface molecules or enzymatic proteins are involved in penetrating the vascu-lar endothelial cells, regulation of pericelluvascu-lar proteolysis of ECM, and cell migration into inflamed tissues, critical to tissue repair and turnover [73–81]. Our results suggest that proteins that maintain integrity of the ECM are down-regulated, possibly reflecting metabolic rebalanc-ing between host defense and healrebalanc-ing mechanisms [82]. These proteins are particularly impor-tant in chronic inflammatory conditions that commonly accompany degradation of connective tissue [83–86].
Our findings corroborate those in -omics studies in animals that have examined changes in gene or protein expression levels of acute phase proteins during inflammation. Yooet al. showed in mice that 898 out of 8,551 protein-encoding genes (~7%) in the hepatic transcrip-tome were altered, equally up and down, by endotoxin-induced inflammation [87]. Similarly, we observed that half of the population plasma inflammasome was primarily hepatic in origin, equally divided across positive and negative correlates of AGP, and possibly reflecting a need to maintain protein equilibria in the vascular compartment [44]. Kelly-Sprattet al. reported that a third of ~500 plasma proteins detected in mice increased or decreased by more than 1.25 fold in response to induced-inflammation [22]. We observed that a large fraction (~20%) of our measured plasma proteome covaried with inflammation, at a false discovery rate below 1% (S1andS2Tables). The study also showed that induced-inflammation reduced the abundance of proteins involved in ECM and collagen network remodeling [22], which were also similarly observed in the present study.
or environmental toxins that could reveal greater specificity of protein associations with causal agents. We depleted, but did not completely remove, plasma samples of 6 highly abundant pro-teins, and the employed iTRAQ technology could not quantify low abundant cytokines and chemokines which mediate inflammation. These limitations reveal challenges of profiling a whole plasma inflammasome of a likely vast dynamic range in protein abundance. However, it may be promising to investigate and integrate less abundant proteins from different spectrums of abundance to build a more complete profile of a population plasma inflammasome. Lastly, although many proteins are involved in non-specific response to inflammation, the findings of this study will be most likely generalizable to populations living in areas where undernutrition, infections and environmental hazards are common.
Conclusions
This study provides evidence of strong association between an index biomarker of chronic inflammation and proteins of host defense, nutrient and hormonal metabolism and tissue remodeling. It is tempting to speculate that the low-grade inflammation seen in this study of young children could reflect mild pathological processes early in life, and thus risk, of adult chronic diseases of rising prominence in impoverished societies of South Asia.
Supporting Information
S1 Table. Plasma Proteins Positively Associated withα-1-Acid Glycoprotein (AGP) in 500
children (q<0.01, proteins ordered by q).
(XLSX)
S2 Table. Plasma Proteins Negatively Associated withα-1-Acid Glycoprotein (AGP) in 500
children (q<0.01, proteins ordered by q).
(XLSX)
S3 Table. Plasma Proteins Positively Associated with C-reactive protein (CRP) in 500 chil-dren.
(XLSX)
S4 Table. Plasma Proteins Negatively Associated with C-reactive protein (CRP) in 500 chil-dren.
(XLSX)
S5 Table. Differentially abundant plasma proteins between children with at least one mor-bidity episode and children without any symptoms (q<0.01, proteins ordered by q).
(XLSX)
Acknowledgments
The Johns Hopkins Nutriproteomics Research Team, in addition to co-authors, includes Margia Arguello, Raghothama Chaerkady, Hongie Cui, Lauren R. DeVine, Jaime Johnson, Robert O’ Me-ally, Subarna K. Khatry, Ashika Nanayakkara-Bind, Hee-Sool Rho, Sudeep Shrestha and Fredrick Van Dyke. We thank C. Conover Talbot, Jr. for assistance with the HUGO gene annotation.
Author Contributions
References
1. Kushner I. The phenomenon of the acute phase response. Ann N Y Acad Sci. 1982; 389:39–48. PMID: 7046585
2. Ceciliani F, Giordano A, Spagnolo V. The systemic reaction during inflammation: the acute-phase pro-teins. Protein Pept Lett. 2002; 9(3):211–223. PMID:12144517
3. Kumar V, Abbas AK, Aster JC. Inflammation and Repair. In: Kumar V, Abbas AK, Aster JC, editors. Robbins Basic Pathology. 9th ed. Philadelphia, U.S.: ELSEVIER Saunders; 2012.
4. Nathan C, Ding A. Nonresolving inflammation. Cell. 2010; 140(6):871–882. doi:10.1016/j.cell.2010.02. 029PMID:20303877
5. Mal-Ed Network Investigators. The MAL-ED study: a multinational and multidisciplinary approach to understand the relationship between enteric pathogens, malnutrition, gut physiology, physical growth, cognitive development, and immune responses in infants and children up to 2 years of age in resource-poor environments. Clin Infect Dis. 2014; 59 Suppl 4:S193–206. doi:10.1093/cid/ciu653PMID: 25305287
6. Prendergast AJ, Rukobo S, Chasekwa B, Mutasa K, Ntozini R, Mbuya MN, et al. Stunting is character-ized by chronic inflammation in Zimbabwean infants. PLoS One. 2014; 9(2):e86928. doi:10.1371/ journal.pone.0086928PMID:24558364
7. Rodriguez L, Cervantes E, Ortiz R. Malnutrition and gastrointestinal and respiratory infections in chil-dren: a public health problem. Int J Environ Res Public Health. 2011; 8(4):1174–1205. doi:10.3390/ ijerph8041174PMID:21695035
8. Ahmed S, Moore SE, Kippler M, Gardner R, Hawlader MD, Wagatsuma Y, et al. Arsenic exposure and cell-mediated immunity in pre-school children in rural bangladesh. Toxicol Sci. 2014; 141(1):166–175. doi:10.1093/toxsci/kfu113PMID:24924402
9. Turner PC. The molecular epidemiology of chronic aflatoxin driven impaired child growth. Scientifica (Cairo). 2013; 2013:152879.
10. Gabay C, Kushner I. Acute-phase proteins and other systemic responses to inflammation. N Engl J Med. 1999; 340(6):448–454. PMID:9971870
11. AmiGO2. acute-phase response (GO:0006953): the Gene Ontology; 2014. 2.1.4. Available:http:// amigo.geneontology.org/amigo/term/GO:0006953/.
12. Whicher T, Bienvenu J, Price CP. Molecular biology, measurement and clinical utility of the acute phase proteins. Pure and Applied Chemistry. 1991; 63(8):1111–1116.
13. Schulze KJ, Christian P, Wu LS, Arguello M, Cui H, Nanayakkara-Bind A, et al. Micronutrient deficien-cies are common in 6- to 8-year-old children of rural Nepal, with prevalence estimates modestly affected by inflammation. J Nutr. 2014; 144(6):979–987. doi:10.3945/jn.114.192336PMID:24744314
14. Thurnham DI, McCabe GP. Influence of infection and inflammation on biomarkers of nutritional status with an emphasis on vitamin A and iron In: World Health Organization, editor. Priorities in the Assess-ment of Vitamin A and Iron Status in Populations. Geneva, Switzerland: World Health Organization; 2012. p. 63–80.
15. Raiten DJ, Sakr Ashour FA, Ross AC, Meydani SN, Dawson HD, Stephensen CB, et al. Inflammation and Nutritional Science for Programs/Policies and Interpretation of Research Evidence (INSPIRE). J Nutr. 2015; 145(5):1039S–1108S. doi:10.3945/jn.114.194571PMID:25833893
16. Ceciliani F, Pocacqua V. The acute phase protein alpha1-acid glycoprotein: a model for altered glyco-sylation during diseases. Curr Protein Pept Sci. 2007; 8(1):91–108. PMID:17305563
17. Cole RN, Ruczinski I, Schulze K, Christian P, Herbrich S, Wu L, et al. The plasma proteome identifies expected and novel proteins correlated with micronutrient status in undernourished Nepalese children. J Nutr. 2013; 143(10):1540–1548. doi:10.3945/jn.113.175018PMID:23966331
18. Yuasa I, Umetsu K, Suenaga K, Robinet-Levy M. Orosomucoid (ORM) typing by isoelectric focusing: evidence of two structural loci ORM1 and ORM2. Hum Genet. 1986; 74(2):160–161. PMID:3770743
19. Anderson NL, Anderson NG. The human plasma proteome: history, character, and diagnostic pros-pects. Mol Cell Proteomics. 2002; 1(11):845–867. PMID:12488461
20. Kalmovarin N, Friedrichs WE, O'Brien HV, Linehan LA, Bowman BH, Yang F. Extrahepatic expression of plasma protein genes during inflammation. Inflammation. 1991; 15(5):369–379. PMID:1757124
21. Petrilli V, Papin S, Tschopp J. The inflammasome. Curr Biol. 2005; 15(15):R581. PMID:16085473
22. Kelly-Spratt KS, Pitteri SJ, Gurley KE, Liggitt D, Chin A, Kennedy J, et al. Plasma proteome profiles associated with inflammation, angiogenesis, and cancer. PLoS One. 2011; 6(5):e19721. doi:10.1371/ journal.pone.0019721PMID:21589862
24. Qian WJ, Jacobs JM, Camp DG 2nd, Monroe ME, Moore RJ, Gritsenko MA, et al. Comparative prote-ome analyses of human plasma following in vivo lipopolysaccharide administration using multidimen-sional separations coupled with tandem mass spectrometry. Proteomics. 2005; 5(2):572–584. PMID: 15627965
25. Calder PC, Ahluwalia N, Albers R, Bosco N, Bourdet-Sicard R, Haller D, et al. A consideration of bio-markers to be used for evaluation of inflammation in human nutritional studies. Br J Nutr. 2013; 109 Suppl 1:S1–34. doi:10.1017/S0007114512005119PMID:23343744
26. Christian P, Khatry SK, Katz J, Pradhan EK, LeClerq SC, Shrestha SR, et al. Effects of alternative maternal micronutrient supplements on low birth weight in rural Nepal: double blind randomised com-munity trial. BMJ. 2003; 326(7389):571. PMID:12637400
27. Stewart CP, Christian P, Schulze KJ, Leclerq SC, West KP Jr., Khatry SK. Antenatal micronutrient sup-plementation reduces metabolic syndrome in 6- to 8-year-old children in rural Nepal. J Nutr. 2009; 139 (8):1575–1581. doi:10.3945/jn.109.106666PMID:19549749
28. Stewart CP, Christian P, LeClerq SC, West KP Jr., Khatry SK. Antenatal supplementation with folic acid + iron + zinc improves linear growth and reduces peripheral adiposity in school-age children in rural Nepal. Am J Clin Nutr. 2009; 90(1):132–140. doi:10.3945/ajcn.2008.27368PMID:19474130
29. Herbrich SM, Cole RN, West KP Jr., Schulze K, Yager JD, Groopman JD, et al. Statistical inference from multiple iTRAQ experiments without using common reference standards. J Proteome Res. 2013; 12(2):594–604. doi:10.1021/pr300624gPMID:23270375
30. Harville DA. Maximum Likelihood Approaches to Variance Component Estimation and to Related Prob-lems. Journal of the American Statistical Association. 1977; 72(358):320–338.
31. Robinson GK. That BLUP is a good thing: the estimation of random effects. Stat Sci. 1991; 6:15–32.
32. Luo R, Zhao H. Protein quantitation using iTRAQ: Review on the sources of variations and analysis of nonrandom missingness. Stat Interface. 2012; 5(1):99–107. PMID:23888187
33. Gower JC, Lubbe SG, Roux NJL. Understanding Biplots: Wiley; 2011.
34. Gray KA, Yates B, Seal RL, Wright MW, Bruford EA. Genenames.org: the HGNC resources in 2015. Nucleic Acids Res. 2015; 43(Database issue):D1079–1085. doi:10.1093/nar/gku1071PMID: 25361968
35. Binder JX, Pletscher-Frankild S, Tsafou K, Stolte C, O'Donoghue SI, Schneider R, et al. COMPART-MENTS: unification and visualization of protein subcellular localization evidence. Database (Oxford). 2014; 2014:bau012.
36. Geer LY, Marchler-Bauer A, Geer RC, Han L, He J, He S, et al. The NCBI BioSystems database. Nucleic Acids Res. 2010; 38(Database issue):D492–496. doi:10.1093/nar/gkp858PMID:19854944
37. Huntley RP, Sawford T, Mutowo-Meullenet P, Shypitsyna A, Bonilla C, Martin MJ, et al. The GOA data-base: Gene Ontology annotation updates for 2015. Nucleic Acids Res. 2015; 43(Database issue): D1057–1063. doi:10.1093/nar/gku1113PMID:25378336
38. UniProt C. Activities at the Universal Protein Resource (UniProt). Nucleic Acids Res. 2014; 42(Data-base issue):D191–198. doi:10.1093/nar/gkt1140PMID:24253303
39. Wu C, Orozco C, Boyer J, Leglise M, Goodale J, Batalov S, et al. BioGPS: an extensible and customiz-able portal for querying and organizing gene annotation resources. Genome Biol. 2009; 10(11):R130. doi:10.1186/gb-2009-10-11-r130PMID:19919682
40. de Onis M, Onyango AW, Borghi E, Siyam A, Nishida C, Siekmann J. Development of a WHO growth reference for school-aged children and adolescents. Bull World Health Organ. 2007; 85(9):660–667. PMID:18026621
41. Thurnham DI, Mburu AS, Mwaniki DL, De Wagt A. Micronutrients in childhood and the influence of sub-clinical inflammation. Proc Nutr Soc. 2005; 64(4):502–509. PMID:16313694
42. Nakamura H, Yuasa I, Umetsu K, Nakagawa M, Nanba E, Kimura K. The rearrangement of the human alpha(1)-acid glycoprotein/orosomucoid gene: evidence for tandemly triplicated genes consisting of two AGP1 and one AGP2. Biochem Biophys Res Commun. 2000; 276(2):779–784. PMID:11027547
43. Kushner I, Mackiewicz A. Acute phase proteins as disease markers. Dis Markers. 1987; 5(1):1–11. PMID:2458880
44. Mackiewicz A, Kushner I, Baumann H. Acute Phase Proteins: Molecular Biology, Biochemistry, and Clinical Applications. Florida: CRC Press; 1993.
46. Navitsky RC, Dreyfuss ML, Shrestha J, Khatry SK, Stoltzfus RJ, Albonico M. Ancylostoma duodenale is responsible for hookworm infections among pregnant women in the rural plains of Nepal. J Parasitol. 1998; 84(3):647–651. PMID:9645880
47. Chowdhury R, Huda MM, Kumar V, Das P, Joshi AB, Banjara MR, et al. The Indian and Nepalese pro-grammes of indoor residual spraying for the elimination of visceral leishmaniasis: performance and effectiveness. Ann Trop Med Parasitol. 2011; 105(1):31–35. doi:10.1179/
136485911X12899838683124PMID:21294947
48. Coles CL, Sherchand JB, Khatry SK, Katz J, Leclerq SC, Mullany LC, et al. Nasopharyngeal carriage of S. pneumoniae among young children in rural Nepal. Trop Med Int Health. 2009; 14(9):1025–1033. doi: 10.1111/j.1365-3156.2009.02331.xPMID:19563428
49. Groopman JD, Egner PA, Schulze KJ, Wu LS, Merrill R, Mehra S, et al. Aflatoxin exposure during the first 1000 days of life in rural South Asia assessed by aflatoxin B(1)-lysine albumin biomarkers. Food Chem Toxicol. 2014; 74:184–189. doi:10.1016/j.fct.2014.09.016PMID:25308602
50. Thakur JK, Thakur RK, Ramanathan A, Kumar M, Singh SK. Arsenic Contamination of Groundwater in Nepal—An Overview. Water. 2010; 3(1):1–20.
51. Hochepied T, Berger FG, Baumann H, Libert C. Alpha(1)-acid glycoprotein: an acute phase protein with inflammatory and immunomodulating properties. Cytokine Growth Factor Rev. 2003; 14(1):25–34. PMID:12485617
52. Wang X, Abraham S, McKenzie JA, Jeffs N, Swire M, Tripathi VB, et al. LRG1 promotes angiogenesis by modulating endothelial TGF-beta signalling. Nature. 2013; 499(7458):306–311. doi:10.1038/ nature12345PMID:23868260
53. O'Donnell LC, Druhan LJ, Avalos BR. Molecular characterization and expression analysis of leucine-rich alpha2-glycoprotein, a novel marker of granulocytic differentiation. J Leukoc Biol. 2002; 72(3):478– 485. PMID:12223515
54. Ramirez VP, Gurevich I, Aneskievich BJ. Emerging roles for TNIP1 in regulating post-receptor signal-ing. Cytokine Growth Factor Rev. 2012; 23(3):109–118. doi:10.1016/j.cytogfr.2012.04.002PMID: 22542476
55. Fey GH, Gauldie J. The acute phase response of the liver in inflammation. Prog Liver Dis. 1990; 9:89– 116. PMID:1690438
56. Aldred AR, Schreiber G. The Negative Acute Phase Proteins. In: Mackiewicz A, Kushner I, Baumann H, editors. Acute Phase Proteins Molecular Biology, Biochemistry, and Clinical Applications: Taylor & Francis; 1993. p. 21–38.
57. Khovidhunkit W, Kim MS, Memon RA, Shigenaga JK, Moser AH, Feingold KR, et al. Effects of infection and inflammation on lipid and lipoprotein metabolism: mechanisms and consequences to the host. J Lipid Res. 2004; 45(7):1169–1196. PMID:15102878
58. Moody BJ. Changes in the serum concentrations of thyroxine-binding prealbumin and retinol-binding protein following burn injury. Clin Chim Acta. 1982; 118(1):87–92. PMID:6797761
59. Rosales FJ, Ross AC. Acute inflammation induces hyporetinemia and modifies the plasma and tissue response to vitamin A supplementation in marginally vitamin A-deficient rats. J Nutr. 1998; 128(6):960– 966. PMID:9614154
60. Jahnen-Dechent W, Heiss A, Schafer C, Ketteler M. Fetuin-A regulation of calcified matrix metabolism. Circ Res. 2011; 108(12):1494–1509. doi:10.1161/CIRCRESAHA.110.234260PMID:21659653
61. Tsilidis KK, Rohrmann S, McGlynn KA, Nyante SJ, Lopez DS, Bradwin G, et al. Association between endogenous sex steroid hormones and inflammatory biomarkers in US men. Andrology. 2013; 1 (6):919–928. doi:10.1111/j.2047-2927.2013.00129.xPMID:24124163
62. Le Roith D, Bondy C, Yakar S, Liu JL, Butler A. The somatomedin hypothesis: 2001. Endocr Rev. 2001; 22(1):53–74. PMID:11159816
63. Baxter RC. Insulin-like growth factor binding proteins in the human circulation: a review. Horm Res. 1994; 42(4–5):140–144. PMID:7532612
64. Anderson DC. Sex-hormone-binding globulin. Clin Endocrinol (Oxf). 1974; 3(1):69–96.
65. Liao CH, Li HY, Yu HJ, Chiang HS, Lin MS, Hua CH, et al. Low serum sex hormone-binding globulin: marker of inflammation? Clin Chim Acta. 2012; 413(7–8):803–807. doi:10.1016/j.cca.2012.01.021 PMID:22293276
66. Pinkney J, Streeter A, Hosking J, Mohammod M, Jeffery A, Wilkin T. Adiposity, chronic inflammation, and the prepubertal decline of sex hormone binding globulin in children: evidence for associations with the timing of puberty (earlybird 58). J Clin Endocrinol Metab. 2014; 99(9):3224–3232. doi:10.1210/jc. 2013-3902PMID:24926948
68. Byron A, Humphries JD, Humphries MJ. Defining the extracellular matrix using proteomics. Int J Exp Pathol. 2013; 94(2):75–92. doi:10.1111/iep.12011PMID:23419153
69. Wilson R. The extracellular matrix: an underexplored but important proteome. Expert Rev Proteomics. 2010; 7(6):803–806. doi:10.1586/epr.10.93PMID:21142880
70. Wewer UM, Ibaraki K, Schjorring P, Durkin ME, Young MF, Albrechtsen R. A potential role for tetranec-tin in mineralization during osteogenesis. J Cell Biol. 1994; 127(6 Pt 1):1767–1775. PMID:7798325
71. Khan T, Muise ES, Iyengar P, Wang ZV, Chandalia M, Abate N, et al. Metabolic dysregulation and adi-pose tissue fibrosis: role of collagen VI. Mol Cell Biol. 2009; 29(6):1575–1591. doi:10.1128/MCB. 01300-08PMID:19114551
72. Urciuolo A, Quarta M, Morbidoni V, Gattazzo F, Molon S, Grumati P, et al. Collagen VI regulates satel-lite cell self-renewal and muscle regeneration. Nat Commun. 2013; 4:1964. doi:10.1038/ncomms2964 PMID:23743995
73. Arora PD, Glogauer M, Kapus A, Kwiatkowski DJ, McCulloch CA. Gelsolin mediates collagen phagocy-tosis through a rac-dependent step. Mol Biol Cell. 2004; 15(2):588–599. PMID:14617805
74. Bell SE, Mavila A, Salazar R, Bayless KJ, Kanagala S, Maxwell SA, et al. Differential gene expression during capillary morphogenesis in 3D collagen matrices: regulated expression of genes involved in basement membrane matrix assembly, cell cycle progression, cellular differentiation and G-protein sig-naling. J Cell Sci. 2001; 114(Pt 15):2755–2773. PMID:11683410
75. Fukasawa K, Fujii H, Saitoh Y, Koizumi K, Aozuka Y, Sekine K, et al. Aminopeptidase N (APN/CD13) is selectively expressed in vascular endothelial cells and plays multiple roles in angiogenesis. Cancer Lett. 2006; 243(1):135–143. PMID:16466852
76. Hotchkiss KA, Basile CM, Spring SC, Bonuccelli G, Lisanti MP, Terman BI. TEM8 expression stimu-lates endothelial cell adhesion and migration by regulating cell-matrix interactions on collagen. Exp Cell Res. 2005; 305(1):133–144. PMID:15777794
77. Kim SH, Turnbull J, Guimond S. Extracellular matrix and cell signalling: the dynamic cooperation of integrin, proteoglycan and growth factor receptor. J Endocrinol. 2011; 209(2):139–151. doi:10.1530/ JOE-10-0377PMID:21307119
78. Korpos E, Wu C, Sorokin L. Multiple roles of the extracellular matrix in inflammation. Curr Pharm Des. 2009; 15(12):1349–1357. PMID:19355973
79. Man XY, Finnson KW, Baron M, Philip A. CD109, a TGF-beta co-receptor, attenuates extracellular matrix production in scleroderma skin fibroblasts. Arthritis Res Ther. 2012; 14(3):R144. doi:10.1186/ ar3877PMID:22694813
80. O'Brien P O'Connor BF. Seprase: an overview of an important matrix serine protease. Biochim Biophys Acta. 2008; 1784(9):1130–1145. doi:10.1016/j.bbapap.2008.01.006PMID:18262497
81. Yucel G, Oro AE. Cell migration: GSK3beta steers the cytoskeleton's tip. Cell. 2011; 144(3):319–321. doi:10.1016/j.cell.2011.01.023PMID:21295692
82. Schreiber G. Synthesis and secretion of APP. In: Glaumann H, Theodore P, Redman C, editors. Plasma protein secretion by the liver. London: Academic Press; 1983.
83. Redlich K, Smolen JS. Inflammatory bone loss: pathogenesis and therapeutic intervention. Nat Rev Drug Discov. 2012; 11(3):234–250. doi:10.1038/nrd3669PMID:22378270
84. Ademowo OS, Staunton L, FitzGerald O, Pennington SR. Biomarkers of inflammatory arthritis and pro-teomics. In: Stanilova SA, editor. Genes and Autoimmunity—Intracellular Signaling and Microbiome Contribution: InTech; 2013. p. 237–267.
85. Delano MJ, Moldawer LL. The origins of cachexia in acute and chronic inflammatory diseases. Nutr Clin Pract. 2006; 21(1):68–81. PMID:16439772
86. Tseng S, Reddi AH, Di Cesare PE. Cartilage Oligomeric Matrix Protein (COMP): A Biomarker of Arthri-tis. Biomark Insights. 2009; 4:33–44. PMID:19652761