Bayesian Geostatistical Model-Based
Estimates of Soil-Transmitted Helminth
Infection in Nigeria, Including Annual
Deworming Requirements
Akinola S. Oluwole1, Uwem F. Ekpo1*, Dimitrios-Alexios Karagiannis-Voules2,3, Eniola M. Abe1,4, Francisca O. Olamiju5, Sunday Isiyaku6, Chukwu Okoronkwo7, Yisa Saka7, Obiageli J. Nebe7, Eka I. Braide4, Chiedu F. Mafiana8, Jürg Utzinger2,3,
Penelope Vounatsou2,3
1Department of Biological Sciences, Federal University of Agriculture, Abeokuta, Nigeria,2Department of Epidemiology and Public Health, Swiss Tropical and Public Health Institute, Basel, Switzerland,3University of Basel, Basel, Switzerland,4Department of Zoology, Federal University, Lafia, Nigeria,5Mission to Save the Helpless (MITOSATH), Jos, Nigeria,6Sightsavers, Nigeria Country Office, Kaduna, Nigeria,
7Department of Public Health, Federal Ministry of Health, Abuja, Nigeria,8National Universities Commission, Abuja, Nigeria
Abstract
Background
The acceleration of the control of soil-transmitted helminth (STH) infections in Nigeria, em-phasizing preventive chemotherapy, has become imperative in light of the global fight against neglected tropical diseases. Predictive risk maps are an important tool to guide and support control activities.
Methodology
STH infection prevalence data were obtained from surveys carried out in 2011 using stan-dard protocols. Data were geo-referenced and collated in a nationwide, geographic informa-tion system database. Bayesian geostatistical models with remotely sensed environmental covariates and variable selection procedures were utilized to predict the spatial distribution of STH infections in Nigeria.
Principal Findings
We found that hookworm,Ascaris lumbricoides, andTrichuris trichiurainfections are en-demic in 482 (86.8%), 305 (55.0%), and 55 (9.9%) locations, respectively. Hookworm and
A.lumbricoidesinfection co-exist in 16 states, while the three species are co-endemic in 12 states. Overall, STHs are endemic in 20 of the 36 states of Nigeria, including the Federal Capital Territory of Abuja. The observed prevalence at endemic locations ranged from 1.7% to 51.7% for hookworm, from 1.6% to 77.8% forA.lumbricoides, and from 1.0% to 25.5% forT.trichiura. Model-based predictions ranged from 0.7% to 51.0% for hookworm, from OPEN ACCESS
Citation:Oluwole AS, Ekpo UF, Karagiannis-Voules D-A, Abe EM, Olamiju FO, Isiyaku S, et al. (2015) Bayesian Geostatistical Model-Based Estimates of Soil-Transmitted Helminth Infection in Nigeria, Including Annual Deworming Requirements. PLoS Negl Trop Dis 9(4): e0003740. doi:10.1371/journal. pntd.0003740
Editor:Claudia Munoz-Zanzi, University of Minnesota, UNITED STATES
Received:August 20, 2014
Accepted:April 5, 2015
Published:April 24, 2015
Copyright:© 2015 Oluwole et al. This is an open access article distributed under the terms of the
Creative Commons Attribution License, which permits unrestricted use, distribution, and reproduction in any medium, provided the original author and source are credited.
Data Availability Statement:All disease data are available from thehttp://www.gntd.org/database after registration, and from the Federal Ministry of Health, Abuja, Nigeria: Contact Dr Obiageli Nebe ([email protected]).
0.1% to 82.6% forA.lumbricoides, and from 0.0% to 18.5% forT.trichiura. Our models sug-gest that day land surface temperature and dense vegetation are important predictors of the spatial distribution of STH infection in Nigeria. In 2011, a total of 5.7 million (13.8%) school-aged children were predicted to be infected with STHs in Nigeria. Mass treatment at the local government area level for annual or bi-annual treatment of the school-aged population in Nigeria in 2011, based on World Health Organization prevalence thresholds, were esti-mated at 10.2 million tablets.
Conclusions/Significance
The predictive risk maps and estimated deworming needs presented here will be helpful for escalating the control and spatial targeting of interventions against STH infections in Nigeria.
Author Summary
Infections with three kinds of parasitic worms—hookworm, roundworm, and whipworm —are collectively known as soil-transmitted helminths (STHs). These parasitic worm in-fections are widespread in Nigeria, but the exact distribution is poorly understood. In view of the global commitment to control STH infections, there is a need to accelerate the map-ping of STH infections to guide control interventions, such as large-scale administration of deworming drugs. In this study, we collated survey data from the year 2011 for Nigeria. The data were utilized to predict the distribution of STH infection based on environmental and socioeconomic covariates, and employing a Bayesian geostatistical modeling ap-proach. Our results indicated that STH infections are widely distributed across Nigeria with prevalence estimates as high as 83% for roundworm, 50% for hookworm, and 19% for whipworm infections at specific survey locations. We predict that 5.7 million school-aged children were infected with STHs. The numbers of deworming tablets for annual or bi-annual treatment of the school-aged population at local government areas level in Nige-ria for 2011 were estimated to be 10.2 million.
Introduction
Soil-transmitted helminth (STH) infections belong to the neglected tropical diseases (NTDs). In terms of at-risk population and number of people infected, the STHs are the most frequent NTDs worldwide. The three common STHs are the roundworm (Ascaris lumbricoides), the whipworm (Trichuris trichiura), and the hookworms (Ancylostoma duodenaleandNecator americanus) [1–3]. The most recent estimates suggest that 819 million people worldwide are infected withA.lumbricoides, 465 million withT.trichiura, and 439 million with hookworm [4]. STH infections thrive where there are poor hygiene practices, including limited environ-mental sanitation, unsafe water sources, inadequate toilet facilities, and poor fecal disposal methods, coupled with poverty and low household income [5–7]. School-aged children (5–14 years), in particular, are at high risk of infection and morbidity due to STHs, and hence, are the main target of preventive chemotherapy [8,9].
Nigeria has the highest total number of people infected with STHs in sub-Saharan Africa [10–12]. However, there is a paucity of empirical data on the spatial distribution of STH infec-tions and this has hindered control. The planning, implementation, and rigorous monitoring Foundation (http://www.snf.ch; project no.
PDFMP3-137156) and ASO was funded through EFINTD grant no: AZ:86527. The funders had no role in study design, data collection and analysis, decision to publish, or preparation of the manuscript.
of a national control program targeting STH infection can be enhanced with detailed knowl-edge of the spatial and temporal distribution of infection and morbidity [13]. In light of the global commitment to escalate the control of NTDs [14–17], knowledge of the spatial distribu-tion of STH infecdistribu-tions is a necessary prerequisite for the implementadistribu-tion of control and elimi-nation measures, such as large-scale administration of anthelmintic drugs.
Thus far, two NTD-specific risk maps have been published for Nigeria; onchocerciasis [18] and schistosomiasis [19]. As the country prepares to implement large-scale preventive chemo-therapy campaigns against STH infection, a nationwide map of the spatial distribution of STH using available survey data can help in advocacy, resource sourcing for funds, and implementa-tion of control/eliminaimplementa-tion activities. The purpose of the current study was to produce high-resolution STH infection risk maps, including estimated number of school-aged children in-fected withA.lumbricoides,T.trichiura, and hookworm in Nigeria. We used recently obtained survey data and employed Bayesian geostatistical models to predict STH infection risk across Nigeria. Additionally, we computed annualized treatment requirements with the anthelmintic drugs albendazole and mebendazole. An important aspect of this study is to provide STH pro-gram managers with information for effective implementation of STH control activities.
Methods
Ethics Statement
The work presented here is derived from an in-depth analysis of STH infection survey data obtained from the Federal Ministry of Health (FMoH) of Nigeria in 2011. Ethical clearance, informed consent procedures, and treatment were according to FMoH guidelines and recom-mendations. The data are aggregated and do not contain identifiable individual or household level information. Thus, no specific ethical approval was required for the secondary analysis presented here.
STH Infection Data
In 2011, a national survey was carried out in Nigeria, pertaining to STH infection among chil-dren aged 5–14 years. The overreaching goal of the survey was to prepare the country for mass drug administration with albendazole or mebendazole, provide evidence-based data for advo-cacy, funding, and support of preventive chemotherapy. The survey was conducted by FMoH, in collaboration with State Ministries of Health and non-governmental organizations using trained field workers. The survey used standard protocols put forth by the World Health Orga-nization (WHO) for rapid mapping of STH infection in schools, collection of stool samples, and laboratory work-up. The diagnostic method used was the Kato-Katz technique, with dupli-cate Kato-Katz thick smears prepared from fresh stool samples; one per participant [20]. In each community/school, 60 school-aged children were examined. Data were collected at 555 locations across Nigeria, with the exception of areas in the north-eastern part of the country, where the state of security at the time of the survey did not allow doing so. Study locations were geo-referenced, using a hand-held global positioning system (GPS) device (Garmin Etex; Garmin Corp, Kansas, United States of America). Quality checks were performed to authenti-cate that the coordinates indeed corresponded to specific locations using readily available Goo-gle Map and GooGoo-gle Earth tools.
Environmental Data
day and night land surface temperature (LST), altitude, soil acidity, and soil moisture. Environ-mental data were processed as described elsewhere [21]. Annual averages for the year 2011 were calculated and used in all subsequent analyses. Maps showing the variation of the covari-ates across the country are shown in the Supporting Information (S2 Fig).
Socioeconomic and Population Data
Data on rural and urban extents for Nigeria were downloaded from the Center for Internation-al Earth Science Information Network [22]. Population data for 2010, at 100 x 100 m spatial resolution, was downloaded from the Afripop population database hosted by the World Popu-lation. The data were adjusted to 2011 by multiplying each pixel value with the Nigerian annual growth rate of 2.8% (http://data.worldbank.org/indicator/SP.POP.GROW). The total popula-tion for 2011 was 154,731,365 of which 26.8% correspond to school-aged children (http:// www.census.gov/population/international/data/idb/region.php).
Statistical Analysis
We applied Bayesian binomial geostatistical models to relate STH infection risk with environ-mental and socioeconomic predictors. We used integrated nested Laplace approximations (INLA) [23] and a stochastic partial differential equations approach [24] for fast approximate Bayesian inference. Analysis was carried out in R [25] and the INLA package (www.r-inla.org). Details of how models were implemented are provided in Supporting Information (S1 Text) [24,26,27].
We followed an approach detailed by Karagiannis-Vouleset al. [28], which has also been used for STH geostatistical modeling in Cambodia [29], to select the best predictive model. In brief, we fitted Bayesian bivariate geostatistical models to select the functional form of the effect of each predictor based on the cross-validated logarithmic score [30,31]. We considered linear and categorical functional forms of effects. The categorical functional form of the covariates was generated using 25th, 50th, and 75thpercentile to group each covariate into specific catego-ries. Non-linearity was addressed through random walk processes of order 1 and 2 [32]. The form of each predictor giving the lowest mean logarithmic score was chosen. To identify the set of the most important predictors, we fitted geostatistical models with all possible combination Table 1. Sources of environmental and socioeconomic data used to model soil-transmitted helminth infection risk in Nigeria.
Data type Source Date Temporal resolution Spatial resolution
Altitude SRTM1 2011 1 km
Rainfall FEWS NET2 2011 Yearly 1 km
Normalized difference vegetation index MODIS/Terra3 2009
–2011 16 days 1 km
Day land surface temperature MODIS/Terra3 2009–2011 8 days 1 km
Night land surface temperature MODIS/Terra3 2009–2011 8 days 1 km
Soil pH/soil moisture ISRIC-WISE4 10 km
Population density Afripop5 2010 1 km
Urban-rural classification SEDAC6 1 km
1Shuttle Radar Topography Mission (SRTM);http://www.worldclim.org/(accessed on 20 July 2014).
2Famine Early Warning System (FEWS) Network;http://earlywarning.usgs.gov/fews/index.php/(accessed on 20 July 2014). 3
Moderate Resolution Imaging Spectroradiometer (MODIS);https://lpdaac.usgs.gov/(accessed on 20 July 2014). 4Global soil profile data ISRIC-WISE database v.1.2;http://www.isric.org/(accessed on 20 July 2014).
5World Population database;http://www.clas.ufl.edu/users/atatem/index_files/Nigeria.htm(accessed on 20 July 2014). 6
Socioeconomic Data and Applications Center;http://sedac.ciesin.columbia.edu/data/dataset/grump-v1-urban-extents(accessed on 20 July 2014).
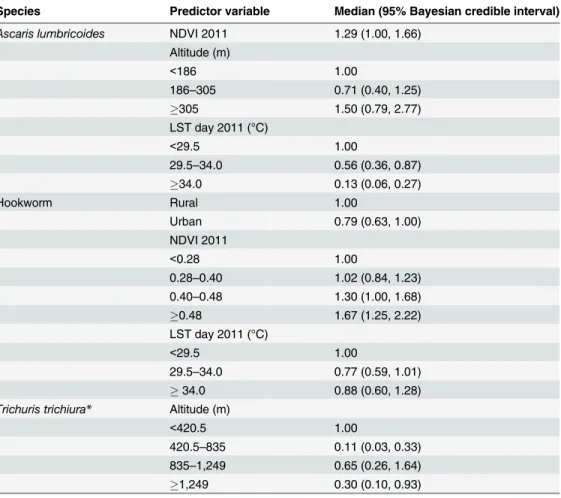
of covariates (i.e., 256 models for each STH species-specific infection) and selected the one, for each of the three STH species, with the best logarithmic score. The final models were used to predict infection risk at a grid of 3 x 3 km including areas where infection data were not avail-able. The form of the covariate that was included in the final model used in the prediction of each species of STH is shown inTable 2. The posterior estimates and Bayesian credible inter-vals for the effects of the predictors are presented in odds ratios. Additional details are provided in Supporting Information (S1 Text).
Due to the large number of observed zero prevalence data, we additionally fitted zero-inflated binomial models with invariant probability of zero-inflation. These models have shown better predictive ability in geostatistical modeling of malaria. [33]. In the present study, the zero-inflated models did not improve predictions (based on the cross-validated logarithmic score). Hence, we report results from the binomial models.
Determination of School-Aged Population at Risk of STH
The school-aged population infected with STHs was estimated by combining the predictive posterior distribution of the infection prevalence at the pixel level with the school-aged Table 2. Posterior estimates (median; 95% Bayesian credible interval) of the final geostatistical mod-els for soil-transmitted helminth infections in Nigeria in 2011.
Species Predictor variable Median (95% Bayesian credible interval) Ascaris lumbricoides NDVI 2011 1.29 (1.00, 1.66)
Altitude (m)
<186 1.00
186–305 0.71 (0.40, 1.25)
305 1.50 (0.79, 2.77)
LST day 2011 (°C)
<29.5 1.00
29.5–34.0 0.56 (0.36, 0.87)
34.0 0.13 (0.06, 0.27)
Hookworm Rural 1.00
Urban 0.79 (0.63, 1.00)
NDVI 2011
<0.28 1.00
0.28–0.40 1.02 (0.84, 1.23) 0.40–0.48 1.30 (1.00, 1.68)
0.48 1.67 (1.25, 2.22)
LST day 2011 (°C)
<29.5 1.00
29.5–34.0 0.77 (0.59, 1.01)
34.0 0.88 (0.60, 1.28)
Trichuris trichiura* Altitude (m)
<420.5 1.00
420.5–835 0.11 (0.03, 0.33) 835–1,249 0.65 (0.26, 1.64)
1,249 0.30 (0.10, 0.93)
*The effect of land surface temperature (LST) at night is depicted inS1 Fig.
population size at each pixel. The number of infected school-aged children was calculated by summing the respective values for each pixel, as described by Schuret al. [34].
Estimation of Anthelmintic Treatment Needs
The amount of anthelmintic treatment (i.e., albendazole or mebendazole) that would be re-quired to treat infected school-aged children at the unit of the state in Nigeria was computed from the pixel level risk estimates. Following recommendations by WHO, school-aged children should be treated twice a year in areas where the infection prevalence is50%, while annual treatment is recommended in areas where infection prevalence ranges between 20% and 50% [9]. Hence, we computed the total number of anthelmintic drugs needed by multiplying the number of school-aged children, per pixel, by a factor of 2 (prevalence50%, biannual treat-ment) or 1 (prevalence 20–50%, annual treattreat-ment). We considered the estimated prevalence of STH at pixel-level, calculated under the assumption that the species-specific prevalences are in-dependent. Treatments were aggregated over all pixels within individual states [19,33]. We compared treatment needs calculated from both pixel and population-adjusted district level prevalences. The estimation of the country-wide number of treatments was based on the sum of the treatment distributions of all local government areas (LGAs) and was conducted using both the approaches described above.
Results
Spatial Distribution of STH Infections in Nigeria
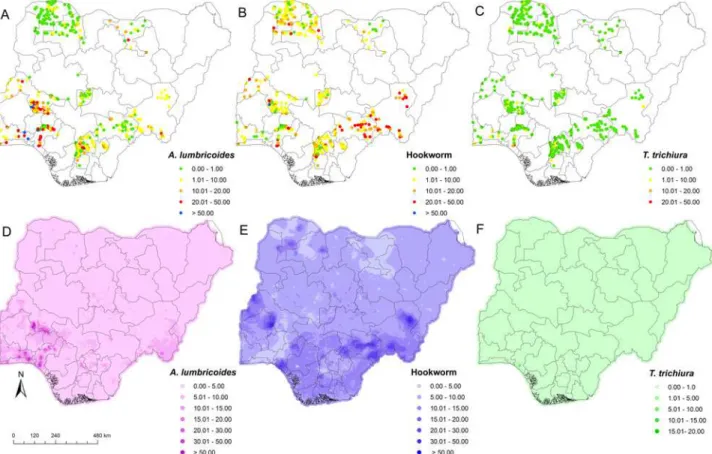
STH infections were diagnosed in the stool of school-aged children surveyed in 20 of the 36 states, including the Federal Capital Territory, Abuja.A.lumbricoideswas present in 305 (55.0%) locations in 16 states, and prevalence at the unit of the state varied from 1.6% to 77.8% (Fig 1A). Hookworm infection showed the widest geographic distribution, as it was found in 482 (86.8%) locations in all 20 states, with prevalence at the unit of the state ranging from 1.7% to 51.7% denoted with the varying colours inFig 1B.T.trichiurawas found in 55 (9.9%) loca-tions in 12 states with state-prevalence ranging from 1.0% to 25.5% (Fig 1C).A.lumbricoides and hookworm HHhHhinfections were co-endemic in 16 states, while co-occurrence of all three STH species was observed in 12 states.
Predicted Risk of
A
.
lumbricoides
Areas with high infection risk (50%) ofA.lumbricoideswere predicted for the south-western part of Nigeria. For most areas in the northern and southern parts of Nigeria, the predicted prevalence was below 5% (Fig 1D). Predicted pixel level prevalence revealed that high risks areas forA.lumbricoidesinfection occur within the states of Ogun, Ondo, Kwara, and Kogi, and some areas in Anambra and Taraba states. Our Bayesian geostatistical model forA. lumbri-coidesrisk suggests that extreme high LST (34°C) is negatively associated withA. lumbri-coides, while a positive association was found betweenA.lumbricoidesinfection and high NDVI value (Table 2).
Predicted Risk of Hookworm
the north-western part of the country. Only few areas in Nigeria showed a pixel level predicted prevalence of hookworm below 5%. Areas with predicted hookworm pixel level prevalence greater than50%, which are considered as high-risk areas, were observed in the states of Tar-aba, Benue, Oyo, Kwara, Katsina, Zamfara, Sokoto, and Kebbi (Fig 1E). The risk of hookworm infection at pixel level in Jigawa, Ogun, Osun, and parts of Zamfara and Sokoto states were pre-dicted to be below 5%. Our Bayesian-based geostatistical model for hookworm showed that high NDVI values and low day LST values are positively associated with hookworm infection (Table 2). The prevalence of hookworm infection was lower in urban compared to rural areas (Table 2).
Predicted Risk of
T
.
trichiura
Infection risk ofT.trichiura, ranging between 10% and 20% (pixel level prevalence), was pre-dicted for areas in the south-west (Ondo state), while all other parts of the country showed pixel level prevalence risks below 10%. The predicted risk ofT.trichiurawas considerably higher in the southern part of Nigeria compared to the north (Fig 1F). Pixel level prevalence re-vealed that areas within Ogun, Ondo, Anambra, and Enugu states and some areas of Taraba state are at high risk ofT.trichiura. Our Bayesian geostatistical model forT.trichiurasuggests a random walk process for night LST, indicating that extreme high temperatures (34°C) are associated with the absence ofT.trichiurain Nigeria. A negative association was found be-tween altitude (increase in altitude) and risk ofT.trichiurainfection.
Fig 1. Spatial distribution of soil-transmitted helminth infections in Nigeria.A) Observed prevalence ofA.lumbricoides. B) Observed prevalence of
hookworm. C) Observed prevalence ofT.trichiura. D) Predicted prevalence ofA.lumbricoides. E) Predicted prevalence of hookworm. F) Predicted
prevalence ofT.trichiura.
School-Aged Population at Risk of STHs and Treatment Requirements
Out of the 41.5 million school-aged children in Nigeria, an estimated 5.7million are predicted to be infected with any STH, an overall predicted prevalence of 13.8%. Kano state has the high-est number of infected school-aged children, while the Federal Capital Territory, Abuja has the lowest prevalence (Table 3).Following WHO recommended cut-offs of 20% and 50% for annual and bi-annual preven-tive chemotherapy with either albendazole or mebendazole, the estimates aggregated at state level showed that only 3 out of the 37 states had a population-adjusted prevalence between 20% and 50%. These states are Cross River, Kwara, and Ondo (Table 3). The LGA is the third administrative level in Nigeria and the preferred unit for health intervention. According to the aforementioned prevalence cut-offs, we computed that the number of albendazole or mebenda-zole tablets needed for treatments using pixel-level prevalence is 10,222,409, tablets, whereas using population-adjusted LGA-level prevalence, it is 9,025,229 tablets. These numbers corre-spond to the median of the country-wide distributions of treatment needs rather than the sum of the median LGA predicted requirements (S1 Table).
Discussion
We provide spatially explicit model-based risk estimates of the three main species of STHs in Nigeria. We used Bayesian geostatistical methods which have become essential tools in infec-tious disease risk profiling [35]. Our estimates are based on a large ensemble of recent survey data that were obtained using standard protocols. Hence, our estimates are more robust than those obtained from previous mapping exercises that collated historic survey data employing different collection methods and diagnostic approaches [28,36,37]. Our predictive risk maps are important and useful for planning, implementation, and evaluation of STH control pro-grams [21]. Indeed, as a first step, the maps will help prioritize the implementation of interven-tion programs for the control of STH infecinterven-tions, particularly the spatial targeting of preventive chemotherapy. This is important in light of the current global moves toward control and elimi-nation of NTDs [14,38]. Additionally, the model-based risk map of STH presented here com-plements a recent model-based risk map of schistosomiasis in Nigeria [19] for concurrent control of STH and schistosomiasis [39,40]. An integrated approach for the control of multiple helminthiases would reduce operational costs in the planning and implementation of control programs, as the primary target risk group for preventive chemotherapy are school-aged chil-dren, and hence the education system is the most convenient platform for drug administration [38,41,42]. It should be noted, however, that recent mathematical modeling work revealed that adults should also be targeted by preventive chemotherapy if substantial gains of morbidity control and interruption of transmission are aimed for [43]. A similar result was supported by a sub-continental geostatistical analysis of STH in sub-Saharan Africa [28].
Table 3. Median predicted prevalence of soil-transmitted helminth infection; number of school-aged children infected for Nigeria, stratified by state for 2011.
Population-adjusted mean prevalence and 95% Bayesian credible interval S/
N
State Ascaris lumbricoides
(95% CI)
Trichuris trichiura (95% CI)
Hookworm (95% CI)
Any STH** School-aged children population infected
1 Abia 7.8 (2.8, 19.7) 0.3 (0.1, 0.7) 9.3 (3.5, 20.3) 16.8 (8.3,
30.0)
144,950
2 Adamawa 2.8 (1.6, 4.2) 0.1 (0.1, 0.2) 8.5 (5.1, 13.4) 11.2 (7.6, 16.9)
92,727
3 Akwa Ibom 8.3 (3.1, 19.4) 0.4 (0.1, 1) 9.5 (3.2, 23.4) 18.4 (8.9, 31.3)
199,303
4 Anambra 3.9 (2.7, 6.2) 0.2 (0.1, 0.4) 6.3 (5.5, 7.5) 10.2 (8.5, 12.9)
126,859
5 Bauchi 3.6 (2.2, 5.9) 0.1 (0.04, 0.2) 7.3 (4.5, 10.1) 10.7 (7.6, 14.3)
145,923
6 Bayelsa 8.0 (4.0, 17.6) 0.3 (0.1, 0.9) 11.2 (4.3, 24.0) 19.2 (11.4, 32.7)
83,072
7 Benue 5.2 (3.7, 7.7) 0.2 (0.1, 0.3) 14.8 (12.4, 18.2) 19.7 (16.7, 23.6)
247,591
8 Borno 1.8 (0.9, 4.3) 0.1 (0.1, 0.3) 7.2 (4.5, 12.2) 9.2 (6.46,
13.4)
108,514
9 Cross River 8.9 (5.1, 14.0) 0.3 (0.1, 0.7) 12.0 (7.4, 18.9) 20.4 (13.8, 28.3)
155,420
10 Delta 7.7 (3.9, 14.4) 0.3 (0.1, 0.8) 10.8 (5.4, 19.6) 18.1 (12.0, 27.3)
211,644
11 Ebonyi 7.6 (3.7, 15.5) 0.3 (0.1, 0.8) 7.8 (4.3, 13.9) 15.5 (9.6, 22.8)
94,252
12 Edo 7.6 (4.1, 15.2) 0.2 (0.1, 0.8) 10.2 (6.3, 17.4) 17.9 (11.9, 27.6)
175,147
13 Ekiti 10.4 (3.9,21.7) 0.1 (0.02, 0.2) 7.6 (3.8, 14.3) 17.8 (10.3, 28.9)
120,899
14 Enugu 6.4 (3.5, 14.2) 0.2 (0.1, 0.4) 7.9 (6.1, 10.1) 14.2 (10.4, 21.8)
135,568
15 Federal Capital Territory
4.2 (2.5, 7.6) 0.3 (0.2, 0.5) 7.5 (5.8, 9.6) 11.6 (9.2, 15.3)
43,500
16 Gombe 2.2 (1.1, 4.5) 0.1 (0.1, 0.3) 7.0 (4.3, 13.9) 9.4 (6.3, 15.8)
67,031
17 Imo 6.3 (2.5, 16.3) 0.2 (0.1, 0.5) 12.3 (5.2, 23.8) 18.5 (10.6, 29.9)
210,835
18 Jigawa 3.4 (1.7, 5.2) 0.1 (0.02, 0.2) 5.0 (3.3, 7.1) 8.1 (5.9, 11.3)
105,754
19 Kaduna 7.2 (4.4, 11.5) 0.04 (0.02, 0.2) 7.5 (4.8, 12.1) 14.8 (10.7, 19.7)
265,200
20 Kano 5.0 (2.5, 12.3) 0.1 (0.01, 0.3) 5.8 (3.0, 14.6) 11.6 (6.4, 20.3)
322,757
21 Katsina 4.2 (2.4, 7.7) 0.04 (0.01, 0.2) 7.1 (4.2, 10.8) 11.0 (7.4, 16.6)
185,648
22 Kebbi 1.9 (1, 3.2) 0.1 (0.04, 0.1) 7.8 (4.7, 11.9) 9.9 (6.6,
14.0)
95,208
23 Kogi 8.2 (4.7, 12.7) 0.2 (0.1, 0.4) 10.6 (6.7, 16.6) 18.1 (13.4, 25.1)
178,799
24 Kwara 20.9 (17.1, 24.7) 0.2 (0.1, 0.6) 7.7 (6.7, 8.9) 27.3 (23.6, 30.8)
199,369
25 Lagos 5.9 (1.4, 27.0) 0.2 (0.1, 2.1) 3.1 (1.1, 9.7) 10.4 (4.4, 28.4)
291,630
organizations working in the country. Currently ongoing in Nigeria are deworming programs targeting onchocerciasis and lymphatic filariasis, which include ivermectin treatment given to school-aged children 5 years and above for onchocerciasis and/or ivermectin plus albendazole against lymphatic filariasis. Another reason may be attributed to good access to cheap sachet drinking water popularly called“pure water”in many rural communities in Nigeria. This 500 ml nylon-bagged potable water is basically available everywhere in Nigeria and is sold at US$ 0.03 per sachet. The availability of this product may be a factor in reducing the fecal-oral trans-mission ofA.lumbricoidesandT.trichiura. On the other hand, the comparatively higher prev-alence and distribution of hookworm infection in Nigeria is associated with the transmission of this parasite through the skin. Hence, barefoot walking by school-aged children is a risk factor and is likely to be driven by low socioeconomic status [44]. It should also be noted that Nigeria in the equatorial zone is suitable for hookworm larval development [46].
Our predictions revealed that less than 15% of school-aged children were infected with STHs in 2011. Thus, the acceleration of STH control is important to maintain this relatively low level of prevalence in the most populous country in Africa [47]. Our data are useful in re-viewing the current STH control program in Nigeria in light of the findings presented here. Based on our predictions, the estimated annualized needs for anthelmintic drugs have been de-termined to be 10.2 million tablets. This amount should be further reviewed when the security issue in north-eastern Nigeria is resolved and prevalence data for this region become available Table 3. (Continued)
Population-adjusted mean prevalence and 95% Bayesian credible interval S/
N
State Ascaris lumbricoides
(95% CI)
Trichuris trichiura (95% CI)
Hookworm (95% CI)
Any STH** School-aged children population infected
26 Nassarawa 5.7 (3.5, 9.7) 0.14 (0.1, 0.3) 8.6 (5.0, 14.4) 14.2 (9.6, 20.3)
79,619
27 Niger 4.6 (3.2, 7.4) 0.2 (0.1, 0.3) 7.8 (5.4, 10.4) 12.5 (9.4, 16.2)
142,791
28 Ogun 11.8 (7.4, 17.3) 0.4 (0.2, 1.0) 5.1 (3, 8.5) 16.8 (11.9,
22.2)
173,848
29 Ondo 13.5 (9.7, 18.0) 0.6 (0.4, 1.2) 11.6 (8.4, 17.0) 23.9 (18.6, 29.6)
219,037
30 Osun 8.5 (3.7, 15.8) 0.1 (0.1, 0.3) 4.5 (2.2, 9.3) 12.8 (7.9,
20.1)
143,953
31 Oyo 6.5 (3.6, 13.5) 0.1 (0.1, 0.3) 7.7 (4.8, 13.5) 14.0 (9.4,
21.6)
236,550
32 Plateau 5.9 (3.2, 11.9) 0.1 (0.03, 0.4) 7.8 (4.3, 12.7) 14.0 (8.9, 19.4)
131,414
33 Rivers 7.9 (2.9, 19.8) 0.3 (0.1, 1.1) 10.0 (4.3, 20.9) 18.3 (9.5, 31.6)
221,281
34 Sokoto 1.4 (0.9, 2.0) 0.2 (0.1, 0.4) 6.8 (6.0, 7.9) 8.3 (7.5, 9.7) 88,095 35 Taraba 6.1 (4.6, 7.9) 0.1 (0.1, 0.3) 14.1 (11.3, 16.8) 19.6 (16.4,
22.3)
132,344
36 Yobe 2.0 (0.9, 3.9) 0.1 (0.1, 0.2) 6.6 (3.9, 11) 8.7 (6.1,
12.9)
59,787
37 Zamfara 3.3 (2.3, 4.9) 0.1 (0.1, 0.2) 7.3 (5.8, 9.2) 10.5 (8.9, 12.5)
100,545
Total/Mean 6.2 (3.3, 12.5) 0.17 (0.08,0.55) 7.9 (4.8, 13.5) 13.8 (10.5, 16.5)
5,736,864
**Calculated under the assumption of independence.
to update model-based estimates. The fact that infection prevalence of STHs are considerably lower when compared to past estimates and projections [11] points to progress made, thanks to efforts by various governmental and non-governmental health development agencies imple-menting deworming programs across the country. Hence, these efforts should be sustained with adequate funding [12].
We fitted Bayesian geostatistical models to identify environmental and socioeconomic pre-dictors that influence the distribution of each of the three STH species. Our results show that NDVI is a major environmental predictor for hookworm infection, while day LST is negatively associated with the distribution ofA.lumbricoides. The results of our predictions are supported by the biology, ecology, and epidemiology of STHs. In fact, low humidity, associated with high temperature, leads to cessation of embryonation ofA.lumbricoides, while high humidity pro-motes quick embryonation ofA.lumbricoideseggs [48,49]. Our results are in line with earlier reports on the influence of temperature in the distribution and transmission of STH infections in Bolivia and the People’s Republic of China [37,50]. The observed prevalence data show that hookworm infection is the most widespread of the three common STH infections and has a higher predicted prevalence than the other two species. This finding is setting-dependent since other studies carried out in Bolivia, the People’s Republic of China, and Kenya found that A.lumbricoidesis the predominant STH species [37,50,51].
The only socioeconomic predictor used (i.e., urban-rural classification) did not show any re-lationship withA.lumbricoidesandT.trichiurainfections. Other socioeconomic proxies, such as sanitation level and access to clean water, may be able to better explain the spatial distribu-tion of infecdistribu-tion risk with STHs [52]. However, unless individual information on both infection and, for instance, sanitation become available, such socioeconomic proxies might not improve predictions [29]. The predictors identified indicate that high night LST, which is often observed in the desert part of Nigeria as well as high altitude, can prohibit the survival ofT.trichiura. This result may explain the quasi-absence of this STH species in the northern part of Nigeria (where there is extreme heat and a short wet season).
The strength of this study is that our analysis is based on recent survey data obtained by the FMoH Nigeria in 2011, adhering to standard and uniform diagnostic methods, focussing on school-aged children across all surveyed locations. This helps to avoid prediction bias asso-ciated with heterogeneities (e.g., due to diagnostic error and different age groups across sur-veys) arising from historically compiled data [52]. More importantly, an accurate and up-to-date map of STH infections is more reliable in making decisions for helminthiasis control, as relying on historic data alone may not give a true picture of the current status of the disease [53]. A limitation of this analysis is the lack of data from most of the north-eastern part of the country due to security issues and therefore prediction uncertainties are high in that part of the country.
not take into account the variation in the population density and can wrongly assign treat-ments to areas.
Our estimates are lower than those recently reported in a geostatistical analysis of STH in-fection across sub-Saharan Africa [28]. The previous analysis used historic data over the past 50 years stemming from 33 states in Nigeria, some of which had high prevalence before 2000. It also considered a common temporal trend across all countries and showed a prevalence decrease after 2000, probably due to socioeconomic development as well as preventive chemo-therapy that have been scaled up recently. In Nigeria, according to the preventive chemothera-py database of WHO, from 2003 to 2010, there have been more than 10 million school-aged children and almost 7 million preschool-aged children treated for STHs. From 2010 onwards, more than 22 million school-aged children have received preventive chemotherapy. In our study, using recent survey data, we predicted lower prevalence, indicating a continuous decline in the prevalence of STH.
In conclusion, we have produced spatially explicit model-based risk estimates of the geo-graphic distribution of the three main species of STHs in Nigeria and determined underlying environmental risk factors. This is useful for planning the control of STH. We have further esti-mated the number school-aged children infected and at risk of infection, and provided annual-ized deworming requirement for Nigeria. With these data, the national STH control program can mobilize resources and attract local, national, and international support to escalate the im-plementation of preventive chemotherapy and other control measures nationwide.
Supporting Information
S1 Fig. The effect of land surface temperature (LST) at night.
(TIF)
S2 Fig. Maps of environmental co-variates used in the model.
(DOCX)
S1 Table. Population-adjusted and Pixel treatment requirement per local government areas (LGAs) in Nigeria.
(DOCX)
S1 Text. Details of analysis conducted.
(DOCX)
Acknowledgments
We thank the Federal Ministry of Health (Abuja, Nigeria) for providing the survey data used in the analysis and the Swiss Tropical and Public Health Institute (Basel, Switzerland) for provid-ing an enablprovid-ing environment for the analysis to be conducted.
Author Contributions
Conceived and designed the experiments: UFE CFM JU PV. Performed the experiments: EMA FOO SI CO YS OJN EIB ASO UFE DAKV. Analyzed the data: ASO UFE DAKV JU PV. Con-tributed reagents/materials/analysis tools: DAKV PV. Wrote the paper: ASO UFE DAKV JU PV.
References
2. Hotez PJ, Brindley PJ, Bethony JM, King CH, Pearce EJ, et al. (2008) Helminth infections: the great ne-glected tropical diseases. J Clin Invest 118:1311–1321. doi:10.1172/JCI34261PMID:18382743
3. Utzinger J, Becker SL, Knopp S, Blum J, Neumayr AL, et al. (2012) Neglected tropical diseases: diag-nosis, clinical management, treatment and control. Swiss Med Wkly 142:w13727 doi:10.4414/smw. 2012.13727PMID:23180107
4. Pullan RL, Smith JL, Jasrasaria R, Brooker SJ (2014) Global numbers of infection and disease burden of soil transmitted helminth infections in 2010. Parasit Vectors 7:37. doi:10.1186/1756-3305-7-37 PMID:24447578
5. UNICEF (2008) Nigeria. Water and sanitation summary sheet.http://www.unicef.org/nigeria/ng_ media_Water_sanitation_summary_sheet.pdf; accessed on 20 July 2014.
6. Ekpo UF, Odoemene SN, Mafiana CF, Sam-Wobo SO (2008) Helminthiasis and hygiene conditions of schools in Ikenne, Ogun State, Nigeria. PLoS Negl Trop Dis 2:e146. doi:10.1371/journal.pntd. 0000146PMID:18357338
7. Strunz EC, Addiss DG, Stocks ME, Ogden S, Utzinger J, et al. (2014) Water, sanitation, hygiene, and soil-transmitted helminth infection: a systematic review and meta-analysis. PLoS Med 11:e1001620. doi:10.1371/journal.pmed.1001620PMID:24667810
8. WHO (2002) Prevention and control of schistosomiasis and soil-transmitted helminthiasis: a report of WHO expert committee. WHO Tech Rep Ser 912: 1–57.
9. WHO (2006) Preventive chemotherapy in human helminthiasis: coordinated use of anthelminthic drugs in control interventions: a manual for health professionals and programme managers. Geneva: World Health Organization.
10. Hotez PJ, Kamath A (2009) Neglected tropical diseases in sub-Saharan Africa: review of their preva-lence, distribution and disease burden. PLoS Negl Trop Dis 3: e412. doi:10.1371/journal.pntd. 0000412PMID:19707588
11. Hotez PJ, Asojo OA, Adesina AM (2012) Nigeria:“Ground Zero”for the high prevalence neglected trop-ical diseases. PLoS Negl Trop Dis 6:e1600. doi:10.1371/journal.pntd.0001600PMID:22860138
12. Federal Ministry of Health (2013) Nigeria master plan for neglected tropical diseases (NTDs) 2013–2017, Abuja: Federal Ministry of Health, 142 p.
13. WHO (2012) Research priorities for helminth infections: technical report of the TDR disease reference group on helminth infections. WHO Tech Rep Ser 972:1–196.
14. Utzinger J (2012) A research and development agenda for the control and elimination of human helmin-thiasis. PLoS Negl Trop Dis 6:e1646. doi:10.1371/journal.pntd.0001646PMID:22545174
15. WHO (2012) Uniting to combat NTDs. Available at:http://www.unitingtocombatntds.org; accessed on 20 July 2014.
16. Rollinson D, Knopp S, Levitz S, Stothard JR, Tchuem Tchuenté LA, et al. (2013) Time to set the agenda for schistosomiasis elimination. Acta Trop 128:423–440. doi:10.1016/j.actatropica.2012.04.013PMID: 22580511
17. Webster JP, Molyneux DH, Hotez PJ, Fenwick A (2014) The contribution of mass drug administration to global health: past, present and future. Philos Trans R Soc Lond B Biol Sci 369:20130434 doi:10. 1098/rstb.2013.0434PMID:24821920
18. Noma M, Nwoke BEB, Nutall I, Tambala PA, Enyong P, et al. (2002) Rapid epidemiological mapping of onchocerciasis (REMO): its application by the African Programme for Onchocerciasis Control (APOC). Ann Trop Med Parasitol 96:29–39.
19. Ekpo UF, Hürlimann E, Schur N, Oluwole AS, Abe EM, et al. (2013) Mapping and prediction of schisto-somiasis in Nigeria using compiled survey data and Bayesian geospatial modelling. Geospat Health 7:355–366. PMID:23733296
20. Montresor A, Crompton DWT, Hall A, Bundy, Savioli L (1998) Guidelines for the evaluation of soil-transmitted helminthiasis and schistosomiasis at community level. Geneva: World Health Organization.
21. Schur N, Hürlimann E, Garba A, Traoré MS, Ndir O, et al. (2011) Geostatistical model-based estimates of schistosomiasis prevalence among individuals aged20 years in West Africa. PLoS Negl Trop Dis 5:e1194. doi:10.1371/journal.pntd.0001194PMID:21695107
22. Center for International Earth Science Information Network (CIESIN)/Columbia University, International Food Policy Research Institute (IFPRI), The World Bank, Centro Internacional de Agricultura Tropical (CIAT). Global rural-urban mapping project, version 1 (GRUMPv1): urban extents grid. Palisades, NY: Socioeconomic Data and Applications Center (SEDAC), 2011.http://sedac.ciesin.columbia.edu/data/ dataset/grump-v1-urban-extents; accessed on 20 July 2014.
24. Lindgren F, Rue H, Lindstrom J (2011) An explicit link between Gaussian Markov random field: the sto-chastic partial differential equation approach. J R Stat Soc Ser B Stat Methodol 73:423–492.
25. R Core Team (2013) R: a language and environment for statistical computing. Vienna: R Foundation for Statistical Computing. doi:10.3758/s13428-013-0330-5PMID:23519455
26. Cameletti M, Lindgren F, Simpson D, Rue H (2013) Spatio-temporal modelling of particulate matter concentration through the SPDE approach. Adv Stat Anal 97:109–131.
27. Karagiannis-Voules DA, Scholte RGC, Guimarães LH, Utzinger J, Vounatsou P (2013) Bayesian
geos-tatistical modelling of leishmaniasis incidence in Brazil. PLoS Negl Trop Dis 7:e2213. doi:10.1371/ journal.pntd.0002213PMID:23675545
28. Karagiannis-Voules DA, Biedermann P, Ekpo UF, Garba A, Langer E, et al.(2015) Spatial and temporal distribution of soil-transmitted helminth infection in sub-Saharan Africa: a systematic review and geostatis-tical meta-analysis. Lancet Infect Dis 15:74–84 doi:10.1016/S1473-3099(14)71004-7PMID:25486852
29. Karagiannis-Voules DA, Odermatt P, Biedermann P, Khieu V, Schär F, et al. (2015) Geostatistical modelling of soil-transmitted helminth infection in Cambodia: do socioeconomic factors improve predic-tions? Acta Trop 141:204–212. doi:10.1016/j.actatropica.2014.09.001PMID:25205492
30. Gneiting T, Raftery AE (2007) Strictly proper scoring rules, prediction, and estimation. J Am Statist Assoc 102:359–378.
31. Held L, Schrödle B, Rue H (2010) Posterior and cross-validatory predictive checks: a comparison of MCMC and INLA. In: Tutz G, Kneib T, eds. Statistical modelling and regression structures—Festschrift in honour of Ludwig Fahrmeir. Heidelberg, Dordrecht, London, New York: Springer, pp 91–110.
32. Rue H, Held L (2005) Gaussian Markov random fields: theory and applications. London: Chapman and Hall—CRC Press.
33. Giardina F, Gosoniu L, Konate L, Diouf MB, Perry R, et al. (2012) Estimating the burden of malaria in Senegal: Bayesian zero-inflated binomial geostatistical modeling of the MIS 2008 data. PLoS One 7: e32625. doi:10.1371/journal.pone.0032625PMID:22403684
34. Schur N, Vounatsou P, Utzinger J (2012) Determining treatment needs at different spatial scales using geostatistical model-based risk estimates of schistosomiasis. PLoS Negl Trop Dis 6:e1773. doi:10. 1371/journal.pntd.0001773PMID:23029570
35. Patil AP, Gething PW, Piel FB, Hay SI (2011) Bayesian geostatistics in health cartography: the per-spective of malaria. Trends Parasitol 27:246–253. doi:10.1016/j.pt.2011.01.003PMID:21420361
36. Brooker S, Kabatereine NB, Smith JL, Mupfasoni D, Mwanje MT, et al. (2009) An updated atlas of human helminth infections: the example of East Africa. Int J Health Geogr 8:42. doi: 10.1186/1476-072X-8-42PMID:19589144
37. Chammartin F, Scholte RGC, Malone JB, Bavia ME, Nieto P, et al. (2013) Modelling the geographical distribution of soil-transmitted helminth infections in Bolivia. Parasit Vectors 6:152. doi: 10.1186/1756-3305-6-152PMID:23705798
38. WHO (2012) Eliminating soil-transmitted helminthiasis as a public health problem in children. Progress report 2001–2010 and strategic plan 2011–2020. Geneva: World Health Organization.
39. Hodges MH, Soares Magalhães RJ, Paye J, Koroma JB, Sonnie M, et al. (2012) Combined spatial
pre-diction of schistosomiasis and soil-transmitted helminthiasis in Sierra Leone: a tool for integrated dis-ease control. PLoS Negl Trop Dis 6:e1694. doi:10.1371/journal.pntd.0001694PMID:22724034
40. Brooker S, Kabatereine NB, Gyapong JO, Stothard JR, Utzinger J (2009) Rapid mapping of schistoso-miasis and other neglected tropical diseases in the context of integrated control programmes in Africa. Parasitology 136:1707–1718. doi:10.1017/S0031182009005940PMID:19450373
41. Evans D, McFarland D, Adamani W, Eigege A, Miri E, et al. (2011) Cost-effectiveness of triple drug ad-ministration (TDA) with praziquantel, ivermectin and albendazole for the prevention of neglected tropi-cal diseases in Nigeria. Ann Trop Med Parasitol 105:537–547. doi:10.1179/2047773211Y.
0000000010PMID:22325813
42. Mwinzi, Montgomery SP, Owaga CO, Mwanje M, Muok EM (2012) Integrated community-directed inter-vention for schistosomiasis and soil transmitted helminths in western Kenya—a pilot study. Parasit Vec-tors 5:182. PMID:22937890
43. Truscott JE, Hollingsworth TD, Brooker SJ, Anderson RM (2014) Can chemotherapy alone eliminates the transmission of soil transmitted helminths? Parasit Vectors 7:266. doi:10.1186/1756-3305-7-266 PMID:24916278
45. Schur N, Hürlimann E, Stensgaard AS, Chimfwembe K, Mushinge G, et al. (2013) Spatially explicit
Schistosomainfection risk in eastern Africa using Bayesian geostatistical modelling. Acta Trop
128:365–377. doi:10.1016/j.actatropica.2011.10.006PMID:22019933
46. Tchuem Tchuenté LA (2011) Control of soil-transmitted helminths in sub-Saharan Africa: diagnosis, drug efficacy concerns and challenges. Acta Trop 120:S4–S11. doi:10.1016/j.actatropica.2010.07. 001PMID:20654570
47. World Bank (2013) Nigeria Overview.http://www.worldbank.org/en/country/nigeria/overview; accessed on 20 July 2014.
48. Otto GF (1929) A study of the moisture requirements of the eggs of the horse, the dog, human and pig ascarids. Am J Hyg 10:497–520.
49. Spindler LA (1929) The relation of moisture to the distribution of humanTrichurisandAscaris. Am J Hyg 10: 476–496.
50. Lai YS, Zhou XN, Utzinger J, Vounatsou P (2013) Bayesian geostatistical modelling of soil-transmitted helminth survey data in the People’s Republic of China. Parasit Vectors 6: 359. doi: 10.1186/1756-3305-6-359PMID:24350825
51. Pullan RL, Gething PW, Smith JL, Mwandawiro CS, Sturrock HJW, et al (2011) Spatial modelling of soil-transmitted helminth infections in Kenya: a disease control planning tool. PLoS Negl Trop Dis 5: e958. doi:10.1371/journal.pntd.0000958PMID:21347451
52. Schur N, Utzinger J, Vounatsou P (2011) Modelling age-heterogeneousSchistosoma haematobium
andS.mansonisurvey data via alignment factors. Parasit Vectors 4:142. doi: 10.1186/1756-3305-4-142PMID:21774790