Submitted 10 March 2015 Accepted 13 June 2015 Published7 July 2015
Corresponding author
JHR Burns, [email protected]
Academic editor
Fabiano Thompson
Additional Information and Declarations can be found on page 15
DOI10.7717/peerj.1077
Copyright
2015 Burns et al.
Distributed under
Creative Commons CC-BY 4.0
OPEN ACCESS
Integrating structure-from-motion
photogrammetry with geospatial
software as a novel technique for
quantifying 3D ecological characteristics
of coral reefs
JHR Burns1, D Delparte2, RD Gates3and M Takabayashi4 1Department of Biology, College of Natural Sciences, University of Hawai‘i at M¯anoa,
McCarthy Mall, Honolulu, HI, USA
2Department of Geosciences, Idaho State University, Pocatello, ID, USA
3Hawai‘i Institute of Marine Biology, University of Hawai‘i at M¯anoa, Kaneohe, HI, USA 4Marine Science Department, University of Hawai‘i at Hilo, Hilo, HI, USA
ABSTRACT
The structural complexity of coral reefs plays a major role in the biodiversity, productivity, and overall functionality of reef ecosystems. Conventional metrics with 2-dimensional properties are inadequate for characterization of reef structural complexity. A 3-dimensional (3D) approach can better quantify topography, rugosity and other structural characteristics that play an important role in the ecology of coral reef communities. Structure-from-Motion (SfM) is an emerging low-cost photogrammetric method for high-resolution 3D topographic reconstruction. This study utilized SfM 3D reconstruction software tools to create textured mesh models of a reef at French Frigate Shoals, an atoll in the Northwestern Hawaiian Islands. The reconstructed orthophoto and digital elevation model were then integrated with geospatial software in order to quantify metrics pertaining to 3D complexity. The resulting data provided high-resolution physical properties of coral colonies that were then combined with live cover to accurately characterize the reef as a living structure. The 3D reconstruction of reef structure and complexity can be integrated with other physiological and ecological parameters in future research to develop reliable ecosystem models and improve capacity to monitor changes in the health and function of coral reef ecosystems.
Subjects Conservation Biology, Ecology, Ecosystem Science, Environmental Sciences, Marine Biology
Keywords Coral, Coral reef, Reef structural complexity, 3D topographic reconstruction, Coral ecology, Photogrammetry, Habitat, Structure-from-motion
INTRODUCTION
fisheries, coastline protection, building materials, biochemical compounds, and tourism (Moberg & Folke, 1999;Hoegh-Guldberg et al., 2007). Coral reefs are extremely vulnerable to stress and many have declined in integrity in the face of the increasing intensity and frequency of disturbances associated with climate change and human use (Harvell et al., 1999;Hoegh-Guldberg et al., 2007). Against this backdrop, it is critical to accurately evaluate and better understand how the structural integrity and ecological processes of these ecosystems respond to environmental changes.
Reef structural framework and reef-building capacity of biogenic components are primary drivers of the coral reef ecosystem functionality (Done, 1997;Fisher et al., 2007;
Alvarez-Filip et al., 2009;Zawada, Piniak & Hearn, 2010). These factors have a reciprocal relationship with one another: the high level of architectural complexity provides a diverse range of microhabitats that support high biodiversity, productivity, and resilience; in turn, biogenic calcification is responsible for the reef-building processes that create the complex physical structure (Risk, 1972;Luckhurst & Luckhurst, 1978;Crowder & Cooper, 1982;
Idjadi et al., 2006;Wilson, Graham & Polunin, 2007;Goatley & Bellwood, 2011;Graham & Nash, 2013). Furthermore, the extraordinary reef building capacity of scleractinian corals, enabled by their symbiotic partnerSymbiodinium, is greatly influenced by physical characteristics of coral colonies. This is because physical characteristics of coral colonies like overall shape and topographic complexity influence key metabolic processes such as photosynthesis, respiration, calcium carbonate deposition, and reproduction (Smith, 1978;Crossland, Hatcher & Smith, 1991;Fisher et al., 2007). An accurate evaluation of the physical characteristics of coral colonies and coral reefs, involving 3-dimentional (3D) metrics, is critical in advancing our understanding of functionality of not only coral biology but also habitat availability, biogenic flux, and productivity of the entire coral reef ecosystem (Goatley & Bellwood, 2011;Pittman & Brown, 2011;Graham & Nash, 2013).
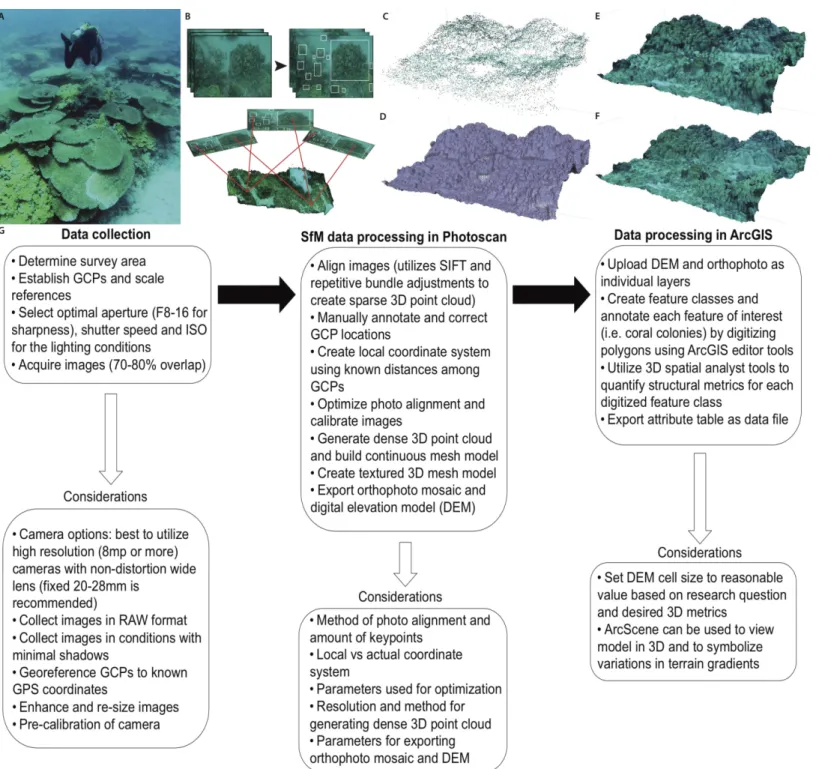
Recent advances in the fields of computer vision and photogrammetry, as well as improvements in data processing power, now make generation of 3D models and orthophotos from 2D imagery cost- and time-effective. Historically, collecting 3D environmental data has been a challenging undertaking in terms of logistics and cost. Oceanographic remote sensing tools, such as light detection and ranging (LIDAR), have been mounted to vessels for long-rage 3D underwater imaging, and in recent years, researchers have developed new techniques for high-resolution 3D reconstruction and visualization of underwater habitats using robotic vehicles (Kocak & Caimi, 2005;Pizarro, Eustice & Singh, 2009;Johnson-Roberson et al., 2010). Most of these technologies have not been widely used for small-scale coral reef studies due to the complexity of data collection, analytical time required, and prohibitive cost (Abdo et al., 2006;Bruno et al., 2011). The more recently developed Structure-from-Motion (SfM) photogrammetric technology offers a simpler, faster, and more affordable alternative for high-resolution topographic reconstruction (Westoby et al., 2012;McCarthy & Benjamin, 2014).
can accurately reconstruct scene geometry using high-resolution overlapping imagery obtained with single lens reflex (SLR) cameras and consumer point-and-shoot cameras, rather then relying on stereoscopic cameras, thus enhancing the accessibility and accuracy of 3D photogrammetric modeling for an array of uses. SfM techniques utilize the basic principles of stereoscopic photogrammetry, which is the science of obtaining reliable information about physical objects, the environment and terrain through processes of recording, measuring, and interpreting photographs or other images. However, the fundamental advantage of SfM is that the geometry of the photographed scene, camera positions, and orientation are evaluated without the need for a priori specification of targets with known 3D positions (Snavely, Seitz & Szeliski, 2008;Westoby et al., 2012). Rather, SfM photogrammetry determines these parameters simultaneously with a highly redundant and iterative bundle adjustment procedure, which is based on a dataset of invariant features extracted from multiple overlapping images (Snavely, Seitz & Szeliski, 2008;Westoby et al., 2012). These features are tracked from image to image, enabling initial estimates of camera position and object coordinates which are then refined iteratively using non-linear least squares minimization (Westoby et al., 2012;Fonstad et al., 2013). This process produces a point cloud of identifiable features present in the input photographs. Once georeferenced, this point cloud can be used to generate an array of digital elevation metrics to quantify 3D characteristics (Fonstad et al., 2013). Automating the process from identification of control points to 3D reconstruction of scene geometry makes SfM substantially more practical and cost-effective than traditional photogrammetric methodologies. Multiple studies have validated the accuracy of SfM techniques for high-resolution 3D topographic reconstruction and analysis, and in some cases found SfM to be highly comparable to substantially more expensive LIDAR techniques (Harwin & Lucieer, 2012;Delparte et al., 2014;Javernick, Brasington & Caruso, 2014).
Underwater SfM 3D reconstruction techniques have primarily been utilized for seafloor habitat characterization, bathymetry mapping, marine environment inspections and archeological surveys (Singh et al., 2002;Pizarro, Eustice & Singh, 2009;Beall et al., 2010;
McCarthy & Benjamin, 2014). However, the SfM technology can also be applied to obtain a range of metrics pertaining to coral colony volume, biomass, and live surface area, all of which directly govern biological functions and ecology of corals. SfM photogrammetry also produces digital elevation models (DEMs) that can be analyzed using topographic software tools. This process enables quantification of intricate structural metrics such as surface complexity (3D/2D surface area), slope, and curvature. These 3D structural metrics are important predictors of organismal abundance, biomass and diversity, and also affect benthic current velocities associated with the food particle supply for suspension feeding corals (Kostylev et al., 2005;Guinan et al., 2009;Pittman, Costa & Battista, 2009;Pittman & Brown, 2011). The ability to quantify these topographic features will greatly enhance both biological and ecological investigations of coral reef ecosystems.
meaningful data from 3D reconstructions made with SfM techniques. We tested the described methods at a study site in French Frigate Shoals, the largest atoll in the Papah¯anaumoku¯akea Marine National Monument (Northwestern Hawaiian Islands). The objectives of this study were to: (1) create a 3D reconstruction of the benthic habitat; (2) quantify several metrics pertaining to ecologically meaningful 3D characteristics; and (3) determine if each benthic component in the surveyed habitat will exhibit significantly distinct 3D structural characteristics.
METHODS
Image acquisition of a coral reef at French Frigate Shoals Images of the coral reef were collected at French Frigate Shoals (23◦43′03.2′′N, 166◦11′10.2′′W), an atoll located in the Papah¯anaumoku¯akea Marine National
Monu-ment. Image collections were conducted in conjunction with annual benthic monitoring surveys performed during a 2012 research expedition aboardNOAA Ship Hi‘ialakai (R 334, National Oceanic and Atmospheric Administration, National Ocean Sciences, Permit # PMNM-2012-031). Survey locations were chosen using a random stratified design in order to objectively assess benthic characteristics throughout the Monument. The data presented here were acquired during a single benthic survey at site FFS33 (23◦50′11.76′′,−166◦16′0.48′′), at 13:00 on August 5th, 2012. Two divers using SCUBA
from the images without prior calibration, thus eliminating the significant burden of pre-calibration (McCarthy & Benjamin, 2014). Pre-calibration options for the camera should be considered when using SfM approaches, and utilized if feasible for the research approach, as this can improve model accuracy and resolution. The workflow presented here allows for rapid surveys and reduces bulky equipment, which is critical for research conducted in remote locations where time and equipment are limiting factors. All photos were taken using a Pentax K-5 digital SLR camera with a 18–55 mm lens (PENTAX RICOH Imaging Americas Corporation, USA) in an Ikelite housing (Ikelite Underwater Systems, Indianapolis, Indiana, USA). An 8-inch hemispheric dome port was used for the Ikelite housing as this has been shown to significantly reduce refraction and enhance the ability of the software to accurately align the images (Bruno et al., 2011;McCarthy & Benjamin, 2014). Strobes were not used in order to reduce the effect of light changes in shadows. DLSR cameras are preferable for the approach described here as the large sensors and high-quality interchangeable lenses provide better light sensitivity with less noise than compared to small sensor compact cameras. The camera lens was set to the focal length of 18 mm with a shutter speed of 1/180, an aperture of f/8 and an ISO of 800. The environmental conditions of a study site, specifically light availability and turbidity, must be considered when selecting the camera and lens settings as an improper depth of field and lack of light sensitivity can dramatically impair the resolution and precision of underwater photogrammetry.
3D model generation
and intersection of pixel rays from the different positions and oriented images in a 3D space. Thex,y,zvalues from the GCPs are used to create a local coordinate system for accurate scaling and orientation of the point cloud, and at least 3 GCPs are needed for accurate 3D reconstruction (Verhoeven, 2012). Markers were annotated onto each of the GCPs using the Photoscan software. The location of each marker was manually reviewed and corrected in all 82 photos containing the GCPs (out of 441 total photos). This step required approximately 1-hour, and is dependent on both the amount of GCPs used and the number of photos containing the GCPs. Manually calibrating the location of GCPs using the Photoscan software ensures accurate interior and exterior orientation of the resulting model. After manually inputting the local coordinates of the GCPs, the model geometry is corrected by using the Photoscan optimize alignment tool. After correcting the interior and exterior orientation, the matching features are used to complete the final phase of the geometry building and generate a dense point cloud, which in turn can be used to build a continuous surface or mesh. The resulting mesh can be triangulated and rendered with the original imagery in order to build textured 3D mesh and create the final digital surface model (Fig. 1).
Digital annotation of benthic features
The 2D orthophoto image file was exported from the Agisoft modeling software and uploaded into geospatial software for annotation and subsequent topographic analyses. The orthophoto provides a high-resolution photo-mosaic of the surveyed substrate, and is geometrically corrected such that each cell contains accurate 3D information and can be used for measurement of topographic parameters (Fig. 2A). The orthophoto was manually digitized in order to create unique polygon shapefiles for all individual living coral colonies (Acropora cytherea, Montipora capitata, M. patula, Pocillopora meandrina, Porites compressa, and P. lobata) and abiotic features (rock/rubble and sand) present in the surveyed benthic habitat. Benthic features were digitized using the ArcGIS (ArcMap 10.1; Environmental Systems Resource Institute, Redlands, California, USA) editor tools. A ‘feature class layer’ was created within ArcGIS, and each digitized polygon was assigned to a specific sub-type that represented each benthic feature in order to catalogue the benthic substrate. This post-processing procedure enabled spatial data to be quantified for each individual coral colony (2,290 total colonies) and abiotic feature (Fig. 3andTable 1). Manually digitizing all features in the orthophoto required approximately 20-hours to complete. Annotating the orthophoto provided the means to compare topographic complexity data among all the living coral colonies and abiotic features that comprise the surveyed benthic habitat at French Frigate Shoals.
Quantification of spatial properties
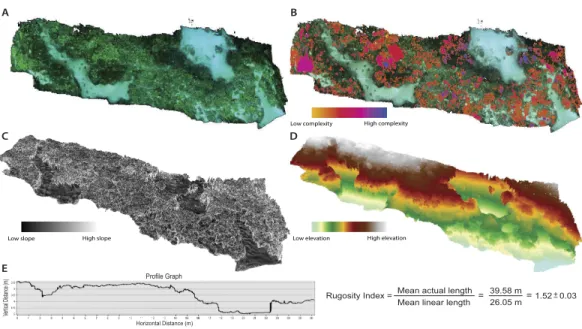
Figure 2 Orthophotos and digital elevation models (DEMs) produced with SfM photogrammetry techniques.(A) Orthophoto of the surveyed benthic habitat (28×6 m plot) at French Frigate Shoals provides a geometrically accurate image for annotation and topographic analyses. (B) Orthophoto with every coral colony individually annotated and symbolized to display the variability in surface complexity (3D/2D surface area). (C) DEM that represents percent slope of the surveyed habitat (maximum rate of change in value from one cell to its neighbors: tanθ∗100). (D) DEM representing elevational gradients throughout the surveyed habitat. (E) An example profile graph showing the DEM contour and the average Rugosity Index calculated from six profile graph permutations.
Table 1 Values of structural metrics compared among the coral species and two substrate types present at the French Frigate Shoals study site.
Structural metrics
Benthic component
Mean surface complexity (±S.E.)
Percent cover
Mean percent slope (±S.E.)
Combined curvature (±S.E.)
Profile
curvature (±S.E.)
Planform curvature (±S.E.)
A. cytherea 4.59±0.68 0.32% 3,614±536 0.32± −0.09 −0.41±0.06 −0.09±0.05
M. capitata 1.71±.0.06 0.19% 323.3±42 0.07±0.02 −0.09±0.01 −0.02±0.01
M. patula 1.81±0.13 0.11% 546±159 0.16±0.05 −0.16±0.03 0.00±0.02
P. compressa 3.02±0.29 1.07% 1,299±182 0.12±0.05 −0.20±0.03 −0.08±0.02
P. lobata 2.12±0.04 10.96% 733.7±30.6 0.17±0.01 −0.19±0.01 −0.02±0.00
P. meandrina 2.30±0.41 0.03% 1,438±744 0.42±0.28 −0.49±0.17 −0.08±0.14
Rock/rubble 1.35±0.05 74.75% 568±131 −0.02±0.02 −0.03±0.01 −0.05±0.01
Sand 1.29±0.05 12.56% 275.5±68 −0.02±0.01 −0.05±0.01 −0.06±0.01
based on the features being modeled. For this study, the raster cells of the DEM were set to 0.5-cm (1.5×1.5-cm window) in order to detect intricate structural differences among the various morphologies of the surveyed coral colonies. This component of the workflow must be adequately considered in order create a DEM with a spatial resolution that is appropriate for the desired ecological application. The following metrics were quantified as they have been shown to influence the key biological and ecological processes of coral reef ecosystems (Friedlander & Parrish, 1998;Kostylev et al., 2005;Pittman, Costa & Battista, 2009;Pittman & Brown, 2011). All metrics were quantified using tools within the ArcGIS topography software, with specific details provided below.
Linear rugosity and percent cover
Linear rugosity is calculated as the actual distance (accounting for changes in vertical surfaces along the reef contour) divided by the linear distance between two points (Luckhurst & Luckhurst, 1978;McCormick, 1994;Friedlander & Parrish, 1998). ArcGIS ‘path distance’ tool was used on the DEM to quantify a linear rugosity value for the surveyed reef plot by quantifying path distance across the across 6 different planes of the coral reef DEM, thus providing an average rugosity value for the surveyed area (Fig. 2). This tool quantified the path distance between start and end nodes on horizontal, vertical, and diagonal movement. Rugosity values were determined by comparing the path distance to the direct linear distance and an average was calculated for the surveyed reef plot (Fig. 2E). Percent cover was quantified by calculating the 2D surface area cover of each benthic feature in proportion to the overall 2D surface area of the surveyed reef plot.
Surface complexity
The 2D and 3D surface area was quantified using the ‘add surface information’ tool for all digitized polygons representing the benthic habitat. This tool is part of the ArcGIS spatial analysis toolbox and uses the orthophoto in conjunction with the DEM to calculate 2D and 3D surface area, as well as several other spatial properties. The ArcGIS editor function was used to calculate the ratio of 3D/2D surface area for each digitized polygon. This value of 3D/2D surface area was used as a 3D metric to represent ‘surface complexity’ for all benthic features.
Slope
Slope was calculated using the ‘slope’ tool in ArcGIS. This tool determines the maximum rate of elevational change from each cell to its neighbors in units of degrees. This tool fits a plane to thez-values of the 3×3 cell window around the processing or center cell. The slope value of this plane is calculated using the average maximum technique (Burrough & McDonell, 1998). The direction the plane faces is the aspect for the processing cell. A small slope values reflects flat terrain, while a large slope value infers a steep terrain. The output slope values were calculated as ‘percent slope,’ which is the rise divided by run (tangentθ) multiplied by 100.
Curvature
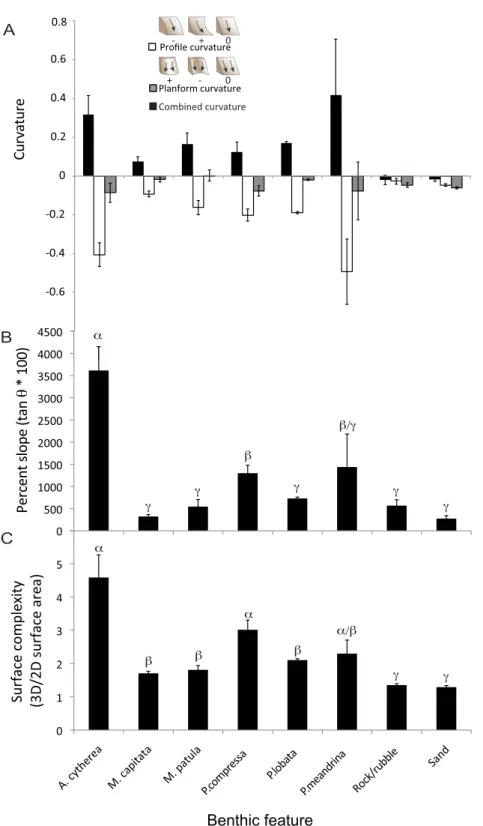
to quantify the curvature of the DEM surface on a cell-by-cell basis, as fitted through that cell and its eight surrounding neighbors. Curvature is the second derivative of the surface, or the slope-of-the-slope. This metric represents the rate of change in surface curvature and quantitatively represents convexities and concavities, thus identifying distinct physical features in a topographic context (Pittman, Costa & Battista, 2009;Pittman & Brown, 2011). Two optional output curvature types are possible: the profile curvature is in the parallel direction of the maximum slope, and the planform curvature is perpendicular to the direction of the maximum slope. Large values of curvature represent complex terrain, and positive or negative values are indicative of either upwardly concave or convex surface in the vertical (profile) and horizontal (planform) direction relating to slope. Units of the curvature output raster, as well as the units for the optional output profile curve raster and output plan curve raster, are one hundredth (1/100) of thez-unit (0.5-cm). The values were adjusted to a 1-m scale in order to compare to other terrestrial and marine studies that primarily compute this metric from DEMs with a 1 mz-unit. ArcGIS multiplies the curvature values by−100 to give values in the approximate range [−1, 1] with a sign that ensures that positive curvature equates to convex forms and negative curvature equates to concave forms. The resulting values represent the radius of curvature, and can be understood as directly relating to the size of a circle or a sphere that just touches the surface at sampled points (De Smith, Goodchild & Longley, 2015). Curvature measures: cross-sectional, maximum and minimum curvature, are used to characterize surface features in order to identify peaks, ridges, passes, planar regions, channels and pits (De Smith, Goodchild & Longley, 2015). The ArcGIS software summarizes the descriptive statistics for each benthic feature, therefore providing one average value and corresponding level of variance (Table 1). This provides a useful method for assess curvature values, however statistical analyses cannot be performed outside of the ArcGIS software as values are not computed for each annotated polygon.
Statistical analysis
RESULTS
The ground sample distance (resolution/pixel) of the resulting 3D model was 0.00109-m/pix with an error of 0.501 pix, thus our designated DEM cell size of 1.5-cm was well within the range of accuracy of the model. 100% of the images were matched with a median of 11715.7 keypoint matches per image and a total of 965,640 tie-points.
The SfM process renders textured 3D models in multiple file formats that serve as powerful visualization tools for assessing the dynamics of structural complexity in coral reef environments. Symbology gradients were applied to the DEMs in order to visualize variability in structural topography of the surveyed habitat for both percent slope and depth (Figs. 2Cand2D). These 3D models serve as a useful tool for visually representing physical characteristics, such as depth and slope, of the benthic habitat.
There were statistically significantly differences in the mean values of percent slope and surface complexity among the benthic features (biotic—corals, abiotic—rock/rubble and sand) of the reef at French Frigate Shoals (MANOVA,F=22.27,p<0.001). Further univariate analysis showed that percent slope, calculated as the tangent ofθmultiplied by 100, was significantly greater in the coral,A. cytherea, than all other corals and abiotic features (ANOVA,F=12.39,p<0.001,Fig. 3B). Surface complexity, calculated as the ratio of 3D surface area to 2D surface area, was significantly greater in the corals exhibiting plating and branching morphologies (A. cytherea,P. compressa, andP. meandrina) compared to the encrusting and mounding corals (M. capitata, M. patula, and P.lobata), and significantly lower in the abiotic substrate (ANOVA,F=30.63,p<0.001,Fig. 3C). The values of combined, profile, and planform curvature varied among the biotic and abiotic benthic features.A. cythereaandP. meandrina, coral species with branching and plating morphologies, exhibited distinctly high values of both combined and profile curvature (Fig. 3AandTable 1). All coral colonies showed higher values of combined curvature compared to the abiotic features. Values of percent cover showed that the benthic habitat was predominantly comprised of abiotic features, andP. lobatawas the dominant coral species (Table 1). The average Rugosity value of the surveyed habitat was 1.52±0.03 S.E. (Fig. 2E).
DISCUSSION
This study utilized Structure for Motion (SfM) photogrammetry techniques in order to characterize the 3D topographic structure of a coral reef at French Frigate Shoals, an atoll located in the Papah¯anaumoku¯akea Marine National Monument. Development of cost-and time-effective methods for quantifying 3D characteristics of coral reefs is critically needed considering that for the past six decades ecologists have found multiple measures of complexity to be primary drivers of biodiversity in these ecosystems (Goreau, 1959;
French Frigate Shoals with coral communities dominated byA. cytherea, P. meandrina, and P. compressaprovide the most complex habitat and potentially support higher levels of diversity and productivity. In summary, utilizing the 3D approach described here can help to identify key coral species that contribute to high levels of productivity and diversity in coral reef ecosystems. Furthermore, the 3D characterization can track the effects of environmental perturbations on this ecosystem. Corals exhibiting complex branching, plating and corymbose morphologies, such asAcropora, Pocillopora, and branching Poritesare generally more susceptible to disturbance than slow-growing corals that exhibit massive morphologies (Gates & Ainsworth, 2011;Woesik et al., 2011). Quantifying the relationship between the 3D structural characteristics of corals and assemblages of epibenthic organisms can help to elucidate potential changes to ecological functionality associated with local and global stressors that cause mortality and loss of coral cover.
In addition to the values representing 3D structural complexity, traditional benthic parameters including relative cover of coral species and abiotic substrate types and rugosity were analyzed using the orthophoto and DEM with the ArcGIS topographic software. Analyzing relative cover provides a useful construct perspective from which to assess reef structure and complexity. While the corals,A. cytherea, P. compressa, and P. meandrina were the most structurally complex, they only occupied a total of 1.42% of the surveyed space. On the other hand,Porites lobatawas the dominant coral, occupying 10.96% of the benthos, thus overall biotic reef structure is predominantly driven byP. lobataat this site. Abiotic substrate (rock, rubble, sand) occupied 87.31% of the benthos, therefore indicating the habitat at this particular site is primarily composed of abiotic features. Assessing the 3D structural dynamics of a benthic habitat in conjunction with percent cover is critical for characterizing the site in an ecological context. Determining how each feature is distinctly different in terms of habitat structure is equally as important as identifying dominant features, as the dominant features will likely have the largest impact on associated species assemblages. It is critical to determine the morpho-functional groups of corals in order to understand how shifts in coral dominance will induce changes in biodiversity and ecosystem services (Alvarez-Filip et al., 2011). Rugosity, measured as the ratio of a straight line transect to a flexible chain draped over the substrate, has been the universally accepted measure of habitat complexity for several decades (Risk, 1972;Friedlander & Parrish, 1998;
Long-term monitoring of coral reef habitats can also be enhanced with SfM photogrammetry techniques. This method not only provides visual tools for assessing changes over time, such as the orthophoto and photo-mosaic, but the point clouds can also be compared across temporal scales in order to precisely quantify changes occurring in the volumetric and structural properties of corals. This will be critical for accurately investigating param-eters such as coral biomass and habitat availability for reef fishes and invertebrates, all of which plays a vital role in coral reef productivity (Luckhurst & Luckhurst, 1978;Abdo et al., 2006;Wilson, Graham & Polunin, 2007). Examining changes in coral biomass and structure is also essential for accurately determining how coral reefs will respond to exponentially increasing global stressors, such as climate change and ocean acidification (Goatley & Bellwood, 2011;Graham & Nash, 2013). It is our hope that this study will provide a methodological platform for future studies to accurately quantify the 3D properties of coral reefs to improve our collective understanding of these important ecosystems.
ACKNOWLEDGEMENTS
We thank the University of Hawai‘i at Hilo Spatial Data Analysis and Visualization
(SDAV) laboratory, Idaho National Laboratories, and NOAA Papah¯anaumoku¯akea Marine National Monument for logistical support involved with fieldwork and image analysis. We also thank Nyssa Silbiger, Maya Walton, Jamie Sziklay, Monika Frazier, Matt Belt, Lisa Canale, Chris Nishioka, Mark Kimura, and Nick Turner for assistance with fieldwork and data processing.
ADDITIONAL INFORMATION AND DECLARATIONS
Funding
This research was funded by the National Science Foundation Center for Research Excellence in Science and Technology Grant No. 0833211 to MT for the Center in Tropical Ecology and Evolution in Marine and Terrestrial Environments. This publication was developed under STAR Fellowship Assistance Agreement no. FP-91768001-0 awarded by the US Environmental Protection Agency (EPA). It has not been formally reviewed by the EPA. The views expressed in this publication are solely those of the authors and EPA does not endorse any products or commercial services mentioned in this publication. Funding was also provided by both ESPCoR Hawai‘i (EPS-0903833) and Idaho (EPS-0814387)
Track-I research grants, and the UH Manoa Edmonson Grant. The funders had no role in study design, data collection and analysis, decision to publish, or preparation of the manuscript.
Grant Disclosures
The following grant information was disclosed by the authors:
National Science Foundation Center for Research Excellence in Science and Technology: 0833211.
Idaho: EPS-0814387. UH Manoa Edmonson.
Competing Interests
The authors declare there are no competing interests.
Author Contributions
• JHR Burns conceived and designed the experiments, performed the experiments, analyzed the data, contributed reagents/materials/analysis tools, wrote the paper, prepared figures and/or tables, reviewed drafts of the paper.
• D Delparte conceived and designed the experiments, analyzed the data, contributed reagents/materials/analysis tools, wrote the paper, reviewed drafts of the paper.
• RD Gates and M Takabayashi contributed reagents/materials/analysis tools, wrote the paper, reviewed drafts of the paper.
Field Study Permissions
The following information was supplied relating to field study approvals (i.e., approving body and any reference numbers):
The National Oceanic and Atmospheric Administration (NOAA), the US Fish and Wildlife Service (FWS), and the State of Hawai‘i (collectively, the Co-Trustess)
approved issuance of permit number PMNM-2012-031 to conduct activities within the Papah¯anaumoku¯akea Marine National Monument.
Supplemental Information
Supplemental information for this article can be found online athttp://dx.doi.org/ 10.7717/peerj.1077#supplemental-information.
REFERENCES
Abdo DA, Seager JW, Harvey ES, McDonald JI, Kendrick GA, Shortis MR. 2006.Efficiently mea-suring complex sessile epibenthic organisms using novel photogrammetric technique.Journal of Experimental Marine Biology and Ecology339:120–133DOI 10.1016/j.jembe.2006.07.015. Alvarez-Filip L, Dulvy NK, Cote IM, Watkinson AR, Gill JA. 2011.Coral identify underpins
architectural complexity on Caribbean reefs.Ecological Applications21(6):2223–2231
DOI 10.1890/10-1563.1.
Alvarez-Filip L, Dulvy NK, Gill JA, Cote IM, Watkinson AR. 2009.Flattening of Caribbean coral reefs: region-wide declines in architectural complexity.Proceedings of the Royal Society B276:3019–3025DOI 10.1098/rspb.2009.0339.
Beall C, Lawrence B, Ila V, Dellaert F. 2010.3D reconstruction of underwater structures. In:Proceedings of intelligent robots and systems (IROS), 2010 IEEE/RSJ international conference.
4418–4423DOI 10.1109/IROS.2010.5649213.
2011 Workshop.Available athttp://www.int-arch-photogramm-remote-sens-spatial-inf-sci.net/
XXXVIII-5-W16/357/2011/isprsarchives-XXXVIII-5-W16-357-2011.pdf.
Bruno F, Bianco G, Muzzupappa M, Barone S, Razionale AV. 2011.Experimentation of structured light and stereo vision for underwater 3D reconstruction.ISPRS Journal of Photogrammetry and Remote Sensing66:508–518DOI 10.1016/j.isprsjprs.2011.02.009. Burrough PA, McDonell RA. 1998.Principles of geographical information systems. New York:
Oxford Unversity Press. 190 pp.
Crossland CJ, Hatcher BG, Smith SV. 1991.Role of coral reefs in global ocean production.Coral Reefs10:55–64DOI 10.1007/BF00571824.
Crowder LB, Cooper WE. 1982.Habitat structural complexity and the interaction between bluegills and their prey.Ecology63:1802–1813DOI 10.2307/1940122.
Delparte DM, Belt M, Nishioka C, Turner N, Richardson R, Ericksen T. 2014.Monitoring tropi-cal alpine lake levels in a culturally sensitive environment utilizing 3D technologitropi-cal approaches.
Arctic, Antarctic, and Alpine Research46(4):709–718DOI 10.1657/1938-4246-46.4.709. De Smith MJ, Goodchild MF, Longley PA. 2015.Geospatial analysis: a comprehensive guide to
principles, techniques, and software tools. Fifth edition, Issue version: 1. Alberta: Winchelsea Press.Available athttp://www.spatialanalysisonline.com/HTML/.
Done TJ. 1997.Decadel changes in reef-building communities: implications for reef growth and monitoring programs.Proceedings of the 8th International Coral Reef Symposium1:411–416. Dustan P, Doherty O, Pardede S. 2013.Digital reef rugosity estimates coral reef habitat
complexity.PLoS ONE8(2):e57386DOI 10.1371/journal.pone.0057386.
Fisher WS, Davis WP, Quarles RL, Patrick J, Campbell JG, Harris PS, Hemmer BL, Parsons M. 2007.Characterizing coral condition using estimates of three-dimensional colony surface area.
Environmental Monitoring and Assessment125:347–360DOI 10.1007/s10661-006-9527-8. Fonstad MA, Dietrich JT, Courville BC, Jensen JL, Carbonneau PE. 2013.Topographic structure
from motion: a new development in photogrammetric measurement.Earth Surface Processes
and Landforms38(4):421–430DOI 10.1002/esp.3366.
Friedlander AM, Parrish JD. 1998.Habitat characteristics affecting fish assemblages on a Hawaiian coral reef.Journal of Experimental Marine Biology and Ecology224:1–30
DOI 10.1016/S0022-0981(97)00164-0.
Gates RD, Ainsworth TD. 2011.The nature and taxonomic composition of coral symbiomes as drivers of performance limits in scleractinian corals.Journal of Experimental Marine Biology and Ecology408:94–101DOI 10.1016/j.jembe.2011.07.029.
Goatley CHR, Bellwood DR. 2011.The roles of dimensionality, canopies and complexity in
ecosystem monitoring.PLoS ONE6(11):e27307DOI 10.1371/journal.pone.0027307.
Goreau TF. 1959.The ecology of Jamaican coral reefs 1. Species composition and zonation.Ecology
40:67–90DOI 10.2307/1929924.
Graham NAJ, Nash KL. 2013.The importance of structural complexity in coral reef ecosystems.
Coral Reefs32:315–326DOI 10.1007/s00338-012-0984-y.
Guinan J, Brown C, Dolan MFJ, Grehan AJ. 2009.Ecological niche modeling of the distribution of cold-water coral habitat using underwater remote sensing data.Ecological Informatics4:83–92
DOI 10.1016/j.ecoinf.2009.01.004.
Harvell CD, Kim K, Burkholder JM, Colwell RR, Epstein PR, Grimes DJ, Hofmann EE, Lipp EK, Osterhaus AD, Overstreet RM, Porter JW, Smith GW, Vasta GR. 1999.Emerging marine diseases, climate links and anthropogenic factors. Science285:1505–1510
Harwin S, Lucieer A. 2012.Assessing the accuracy of georeferenced point coulds produced via multi-view stereopsis from unmanned aerial vehicle (UAV) imagery.Remote Sensing
4.6:1573–1599DOI 10.3390/rs4061573.
Hoegh-Guldberg O, Mumby PJ, Hooten AJ, Steneck RS, Greenfield P, Gomez E, Harvell CD, Sale PF, Edwards AJ, Caldeira K, Knowlton N, Eakin CM, Iglesias-Prieto R, Muthiga N, Bradbury RH, Dubi A, Hatziolos ME. 2007.Coral reefs under rapid climate change and ocean acidification.Science318:1737–1742DOI 10.1126/science.1152509.
Idjadi JA, Lee SC, Bruno JF, Precht WF, Allen-Requa L, Edmunds PJ. 2006.Rapid phase-shift reversal on a Jamaican coral reef.Coral Reefs25:209–211DOI 10.1007/s00338-006-0088-7. Javernick L, Brasington J, Caruso B. 2014.Modeling the topography of shallow braided
rivers using Structure-from-Motion photogrammetry.Geomorphology 213:166–182
DOI 10.1016/j.geomorph.2014.01.006.
Johnson-Roberson M, Pizarro O, Williams SB, Mahon I. 2010.Generation an visualization of large-scale three-dimensional reconstructions from underwater robotic surveys.Journal of Field Robotics27(1):21–51DOI 10.1002/rob.20324.
Knudby A, LeDrew E. 2007.Measuring structural complexity on coral reefs. In: Pollock NW, Godfrey JM, eds.Diving for science 2007. Proceedings of the American academy of underwater sciences 26th symposium, 181–188.Available athttp://dspace.rubicon-foundation.org/xmlui/
bitstream/handle/123456789/7005/AAUS 2007 19.pdf?sequence=1.
Kocak DM, Caimi FM. 2005.The current art of underwater imaging—with a glimpse of the past and vision of the future.Marine Technology Society Journal39(3):5–26
DOI 10.4031/002533205787442576.
Kostylev VE, Erlandsson J, Ming MY, Williams GA. 2005.The relative importance of habitat complexity and surface area in assessing biodiversity: fractal application on rocky shores.
Ecological Complexity2:272–286DOI 10.1016/j.ecocom.2005.04.002.
Luckhurst BE, Luckhurst K. 1978.Analysis of the influence of substrate variables on coral reef fish
communities.Marine Biology49:317–323DOI 10.1007/BF00455026.
McCarthy J, Benjamin J. 2014.Multi-image photogrammetry for underwater archaeological site recording: an accessible, diver-based approach.Journal of Maritime Archaeology9:95–114
DOI 10.1007/s11457-014-9127-7.
McCormick M. 1994.Comparison of field methods for measuring surface topography and their associations with a tropical reef fish assemblage.Marine Ecology Progress Series112:87–96
DOI 10.3354/meps112087.
Moberg F, Folke C. 1999.Ecological goods and services of coral reef ecosystems.Ecological Economics29:215–233DOI 10.1016/S0921-8009(99)00009-9.
Pittman SJ, Brown KA. 2011.Multi-scale approach for predicting fish species distributions across coral reef seascapes.PLoS ONE6(5):e20583DOI 10.1371/journal.pone.0020583.
Pittman SJ, Costa BM, Battista TA. 2009.Using lidar bathymetry and boosted regression trees to predict the diversity and abundance of fish and corals.Journal of Coastal Research25(6):27–38
DOI 10.2112/SI53-004.1.
Pizarro O, Eustice RM, Singh H. 2009.Large area 3-D reconstructions from underwater optical surveys.IEEE Journal of Oceanic Engineering34(2):150–169DOI 10.1109/JOE.2009.2016071. Remondino F, Del Pizzo S, Kersten PT, Troisi S. 2012.Low-cost and open-source solutions
for automated image orientation—a critical overview.Lecture Notes in Computer Science
Risk MJ. 1972.Fish diversity on a coral reef in the Virgin Islands.Atoll Research Bulletin193:1–6
DOI 10.5479/si.00775630.153.1.
Singh H, Salgian G, Eustice R, Mandelbaum R. 2002.Sensor fusion of structure-from-motion, bathymetric 3D, and beacon-based navigation modalities.Proceedings of the IEEE International Conference on Robotics and Automation4:4024–4031.
Smith SV. 1978.Coral-reef area and the contributions of reefs to processes and resources of the world’s oceans.Nature273:225–226DOI 10.1038/273225a0.
Snavely N, Seitz SN, Szeliski R. 2008.Modeling the world from internet photo collections.
International Journal of Computer Vision80:189–210DOI 10.1007/s11263-007-0107-3. Stal C, Bourgeois J, De Maeyer P, De Mulder G, De Wulf A, Goossens R, Hendrickx M,
Nuttens T, Stichelbaut B. 2012.Test case on the quality analysis of structure from motion in airborne applications. In:Proceedings of the 32nd EARSeL symposium: ‘advances in geosciences’ Mykonos, Greece. p. 11.Available athttp://www.researchgate.net/publication/259979041 Test case on the quality analysis of structure from motion in airborne applications.
Verhoeven G. 2012.Getting computer vision airborne: using structure from motion for accurate orthophoto production. In:RSPSoc archaeology special interest group meeting spring 2012. 4–6. Walker BK, Jordan LKB, Spieler RE. 2009.Relationship of reef fish assemblages and topographic
complexity on Southeastern Florida Coral Reef Habitats.Journal of Coastal Research
25(6):39–48DOI 10.2112/SI53-005.1.
Westoby MJ, Brasington J, Glasser NF, Hambrey MJ, Reynolds JM. 2012. ‘Structure-from-Motion’ photogrammetry: a low-cost, effective tool for geoscience applications.Geomorphology
179:300–314DOI 10.1016/j.geomorph.2012.08.021.
Wilson SK, Graham NAJ, Polunin NVC. 2007.Appraisal of visual assessments of habitat
complexity and benthic composition on coral reefs.Marine Biology 151:1069–1076
DOI 10.1007/s00227-006-0538-3.
Woesik R, Sakai K, Ganase A, Loya Y. 2011.Revisiting the winners and losers a decade after coral bleaching.Marine Ecology Progress Series434:67–76DOI 10.3354/meps09203.