Product Eliminations: Consumer Costs and
the Impact on Satisfaction and Loyalty
Pedro Leitão
Dissertation written under the supervision of
Prof. Paulo Romeiro
Dissertation submitted in partial fulfilment of requirements for the MSc in
Management with Specialization in Strategic Marketing, at Universidade
ABSTRACT
Title: Product Eliminations - Consumer Costs and the Impact on Satisfaction and Loyalty Author: Pedro Afonso Vieira Leitão
Nowadays, consumers want to have a big wide variety of product offerings available and companies launch extended product lines and innovations to meet such demand. However, not every product turns out to be a top performer. In fact, 75% of consumer-packaged goods and retail products fail to reach $7.5 million in the first year on the market. These failed products can even decrease firm’s profitability and earnings, which justifies the implementation of product eliminations.
Product Elimination is defined as the decision of a company to end the production and marketing of a product, and existing work suggests that it is a valuable tool to free resources that can be invested in other promising products. Nevertheless, companies need to be cautious and understand the impact this tool may have on consumer relationships.
The main purpose of this dissertation is to study the impact of consumer costs derived from product elimination on satisfaction and loyalty towards the company responsible for the elimination. Primary and secondary data were collected from a conducted survey and by consulting existing literature on the proposed topics.
In the end, it was proved that consumer costs of a product elimination negatively impact satisfaction and loyalty after the elimination. Moreover, satisfaction after elimination positively impacts loyalty and mediates the effect of consumer costs on loyalty.
RESUMO
Título: Eliminações de Produto – Custos para o Consumidor e o impacto na Satisfação e
Lealdade
Autor: Pedro Afonso Vieira Leitão
Hoje em dia, os consumidores querem ter uma grande variedade de oferta de produtos disponível e as empresas desenvolvem linhas de produto alargadas e inovações para satisfazer essa procura. No entanto, nem todos os produtos chegam a ser um sucesso. Na verdade, 75% dos bens de consumo e produtos de retalho não atingem os $7.5 milhões no primeiro ano de comercialização. Estes produtos falhados podem até diminuir a rentabilidade e os ganhos da empresa, o que justifica a implementação de eliminações de produto.
Eliminação de produto é definido como a decisão pela empresa de acabar com a produção e marketing de um produto. Estudos feitos sugerem que é um instrumento valioso que permite libertar recursos que podem ser utilizados em produtos mais promissores. Porém, as empresas devem ser cuidadosas e perceber o impacto que esta ferramenta poderá ter na relação com os consumidores.
O objetivo principal desta dissertação é estudar o impacto dos custos para o consumidor derivados da eliminação de produto na satisfação e lealdade relativamente à empresa responsável pela eliminação. Dados primários e secundários foram coletados através de um questionário e através da literatura existente sobre os temas propostos.
No final, foi provado que os custos para o consumidor de uma eliminação de produto impactam negativamente a satisfação e lealdade após a eliminação. Ao mesmo tempo, a satisfação depois da eliminação impacta positivamente a lealdade e serve de mediador no efeito dos custos para o consumidor na lealdade.
ACKNOWLEDGEMENTS
First of all, I would like to pass a special thanks to my supervisor Paulo Romeiro for his feedback and suggestions, for all his continued support and encouragement and for giving me a path to follow that allowed me to efficiently write this thesis. I also would like to say that I am really grateful for all the help given by Professor Isabel Moreira regarding SPSS statistical analysis and interpretations.
Moreover, I would also like to thank my family for their support and ongoing encouragement never to give up and to demonstrate commitment to every task undertaken. Moreover, I would like to express my gratitude to all my friends who have encouraged me to carry on my work and look for the light at the end of the tunnel. Finally, I would like to thank all those who participated in and shared my survey.
TABLE OF CONTENTS
ABSTRACT ... II RESUMO ... III ACKNOWLEDGEMENTS ... IV TABLE OF FIGURES ... VII TABLE OF APPENDICES ... VIII GLOSSARY ... IX
CHAPTER 1: INTRODUCTION ... 1
1.1BACKGROUND AND PROBLEM STATEMENT ... 1
1.2PROBLEM STATEMENT ... 2
1.3RELEVANCE ... 2
1.4RESEARCH METHODS ... 3
1.5DISSERTATION OUTLINE ... 3
CHAPTER 2: LITERATURE REVIEW AND CONCEPTUAL FRAMEWORK ... 4
2.1PRODUCT ELIMINATION ... 4
2.2CONSUMER COSTS OF PRODUCT ELIMINATION ... 5
2.2.1 Economic Risk Costs ... 6
2.2.2 Evaluation Costs ... 7 2.2.3 Learning Costs ... 7 2.2.4 Set-Up Costs ... 7 2.2.5 Psychological Costs ... 8 2.3CONSUMER SATISFACTION ... 9 2.4CONSUMER LOYALTY ... 11 CHAPTER 3: METHODOLOGY ... 13 3.1RESEARCH APPROACH ... 13 3.2SECONDARY DATA ... 13 3.3PRIMARY DATA ... 13 3.4CONSTRUCT MEASUREMENT ... 15 3.5DATA ANALYSIS ... 16
CHAPTER 4: RESULTS AND DISCUSSION ... 17
4.1ONLINE SURVEY ... 17
4.1.1 Sample Characterization ... 17
4.1.2 Measures Reliability ... 18
4.2HYPOTHESIS TESTING ... 19
4.2.1 Results for the total sample ... 20
4.2.2 Results for the “Yes” sample ... 26
4.2.3 Results for the “No” sample ... 31
4.3HEDONIC VS UTILITARIAN PRODUCTS ... 33
5.1MAIN FINDINGS AND CONCLUSIONS ... 35
5.2ACADEMIC RELEVANCE ... 38
5.3MANAGERIAL IMPLICATIONS ... 39
5.4LIMITATIONS AND FURTHER RESEARCH ... 39
TABLE OF FIGURES
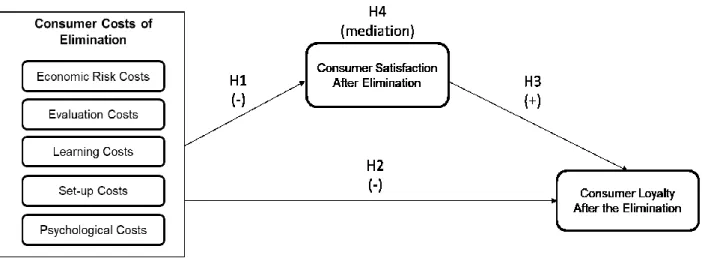
Figure 1 - Conceptual Framework of formulated hypothesis ... 12
Figure 2 - Constructs, nº of scale items and relevant literature source ... 15
Figure 3 - Classic Mediation Model - PROCESS ... 17
Figure 4 - Survey measures reliability... 19
Figure 5 - Costs and Satisfaction relationship for total sample (Hypothesis 1) ... 20
Figure 6 - Multiple Regression Coefficients for total sample (Hypothesis 1) ... 21
Figure 7 - Separate Costs and Satisfaction relationship for total sample (Hypothesis 1a, 1b, 1c, 1e and 1d)... 22
Figure 8 - Costs, Satisfaction and Loyalty relationship for total sample (Hypothesis 2 and 3) ... 23
Figure 9 - Multiple Regression Coefficients for total sample (Hypothesis 2 and 3) ... 23
Figure 10 - Separate Costs, Satisfaction and Loyalty relationship for total sample (Hypothesis 2a, 2b, 2c, 2d, 2e and 3) ... 24
Figure 11 - The mediating role of Satisfaction on the relationship between Costs and Loyalty for total sample (Hypothesis 4) ... 26
Figure 12 - Costs and Satisfaction relationship for “Yes” sample (Hypothesis 1) ... 27
Figure 13 - Costs and Satisfaction relationship for “Yes” sample (Hypothesis 2 and 3) ... 28
Figure 14 - Multiple Regression Coefficients for “Yes” sample (Hypothesis 2a, 2b, 2c, 2d, 2e and 3) 29 Figure 15 - Separate Costs, Satisfaction and Loyalty relationship for “Yes” sample (Hypothesis 2a, 2b, 2c, 2d, 2e and 3) ... 30
Figure 16 - Costs and Satisfaction relationship for “No” sample (Hypothesis 1) ... 31
Figure 17 - Multiple Regression Coefficients for “No” sample (Hypothesis 2a, 2b, 2c, 2d, 2e and 3) 32 Figure 18 - Separate Costs, Satisfaction and Loyalty relationship for “No” sample (Hypothesis 2a, 2b, 2c, 2d, 2e and 3) ... 33
TABLE OF APPENDICES
Appendix 1 - Online Survey………...46
Appendix 2 - SPSS Output……….54
Table 1 – Gender ... 54
Table 2 - Age ... 54
Table 3 – Country of origin ... 55
Table 4 - Level of Education ... 55
Table 5 - Employment Status ... 55
Table 6 – Introductory question ... 56
Table 7 - Product Usage/Selection ... 56
Table 8 - Regression Costs effect on Satisfaction (total sample) ... 56
Table 9 - Separate Costs effect on Satisfaction (total sample) ... 57
Table 10 - Regression Costs and Satisfaction effect on Loyalty (total sample) ... 57
Table 11 - Regression Separate Costs and Satisfaction effect on Loyalty (total sample) ... 58
Table 12 - Mediation Model: Costs direct and indirect impact on Loyalty ... 59
Table 13 - Regression Costs effect on Satisfaction ("Yes" sample) ... 60
Table 14 - Regression Separate Costs effect on Satisfaction ("Yes" sample) ... 60
Table 15 - Regression Costs and Satisfaction effect on Loyalty ("Yes" sample) ... 61
Table 16 - Regression Separate Costs and Satisfaction effect on Loyalty ("Yes" sample) ... 62
Table 17 - Regression Costs effect on Satisfaction w/Company ("Yes" sample) ... 62
Table 18 - Regression Satisfaction w/Company effect on Loyalty ("Yes" sample) ... 63
Table 19 - Regression Costs effect on Satisfaction ("No" sample) ... 63
Table 20 - Regression Separate Costs effect on Satisfaction ("No" sample) ... 64
Table 21 - Regression Costs and Satisfaction effect on Loyalty ("No" sample) ... 64
Table 22 - Regression Satisfaction effect on Loyalty ("No" Sample) ... 65
Table 23 - Regression Separate Costs and Satisfaction on Loyalty ("No" sample) ... 65
Table 24 - Independent Samples T-Test ("Yes" sample) ... 66
GLOSSARY
Product Elimination - decision to discontinue the production and marketing of a product either by replacing the product with an alternative offering or by putting an end to a product altogether. Eliminating Company – company responsible for Product Elimination
Consumer Costs – costs to be incurred by the consumer from Product Elimination
Aggregated Consumer Costs – combination of Economic Risk, Evaluation, Learning, Set-Up and Psychological Costs
B2C – Business-to-Consumer B2B – Business-to-Business
FMCG – Fast Moving Consumer Goods
“Yes” sample – sample consisted of participants who remember/faced a product elimination in the past
“No” sample – sample consisted of participants who did not remember/faced a product elimination in the past
Total sample – combination of the “Yes” and “No” sample IV – Independent Variable
CHAPTER 1: INTRODUCTION 1.1 Background and problem statement
Product line management is an important tool that firms use to be competitive. Since there is an increasing consumer demand for differentiated offerings, companies try to meet that demand by providing a wide variety of products. For instance, in 2016 more than 21,000 stock keeping units (SKUs) were launched in retail outlets in the United States of America of which only 18,5% in the beverages category and 14,8% on the snacks category (Mintel GNPD, 2017). At the same time, consumer companies spent $20bn on research and development in 2016, which reflects the importance of innovation in growth (PwC, Strategy & Consultancy, 2016). However, about 75% of consumer-packaged goods and retail products fail to earn even $7.5 million during their first year (Schneider & Hall, 2011). Sooner or later, many of these failed product innovations turn out to be unprofitable in their lifecycle, leading to a decrease in company earnings. In fact, research shows that 80% of the profits of a company are generated from only 20% of the brands they sell (Kumar, 2003; Mao, Luo, & Jain, 2009). Such financial and operational reasons justify that eliminating products could be a feasible decision for companies in different industries (Argouslidis & Baltas, 2007; Avlonitis, 1987; Homburg, Fürst, & Prigge, 2010).
Product Elimination (or Product Deletion) can be defined as the decision to discontinue the production and marketing of a product (Avlonitis, 1986) either by replacing the product with an alternative offering or by putting an end to a product altogether. A good example of a company that successfully engaged in product eliminations to have a more efficient product portfolio is Procter & Gamble. In the past decades, the company pruned more than 1000 brands that were not top-two performers in their categories and boosted profitability (Carlotti, Coe & Perry, 2004). Existing work suggests that product elimination is an important tool for a company as it allows to increase the economic value of the firm. In fact, discontinuing unwanted products can free up resources that can be redeployed to support more promising products, which can improve the company’s core competencies and amplify it’s growth potential (Mao et al., 2009; Varadarajan, 2006) . Although that evidence shows the need for product eliminations, many managers are reluctant to take action because they are afraid of causing a negative impact on customer loyalty (Homburg et al., 2010).
Despite the relevance of the potential problems from this portfolio management issue, there is a big gap in literature about product elimination. Some existing studies take on a company’s
perspective regarding product eliminations decision making process (e.g., the degree of formalization or criteria for selecting products to be eliminated; Argouslidis & Baltas, 2007; Avlonitis, 1985, 1986) and actual elimination of the product from the portfolio (e.g. the extent of withdrawal; Harness & Marr, 2001; Saunders & Jobber, 1994). Even fewer studies analyze the consumer perspective regarding product eliminations and are more focused on Brand Deletions or Business-to-Business (B2B) contexts (Homburg et al., 2010; Mao et al., 2009). In order to address said research gaps, the main purpose of this research is to understand the relationship between consumer costs of eliminating a product and the consequences for the consumer and the eliminating company. A consumer perspective, in a Business-to-Consumer (B2C) context, will be studied regarding product eliminations by evaluating consumer loyalty and overall satisfaction after the elimination.
1.2 Problem Statement
The aim of this research is to evaluate consumer costs deriving from a product elimination and how it affects consumer loyalty and satisfaction towards the eliminating company. Simultaneously, the mediating effect of overall Satisfaction after the elimination on the relationship between Consumer Costs and Loyalty will be studied.
This problem statement will be developed by answering several research questions:
RQ1: To what extent does Consumer Costs of Product Elimination influence Consumer Satisfaction after the Elimination?
RQ2: To what extent does Consumer Costs of Product Elimination influence Consumer Loyalty after the Elimination?
RQ3: How does Consumer Satisfaction after the Elimination influence Consumer Loyalty after the Elimination?
RQ4: Does Consumer Satisfaction after the Elimination mediates the relationship between Consumer Costs of Product Elimination and Consumer Loyalty after the Elimination?
1.3 Relevance
Since there is a lack of literature regarding this product management tool, adopting a consumer perspective would contribute to academic understanding of how and to what extent eliminating a product affects consumers and their relationship with the company. By filling these research gaps, some valuable insights were generated into whether and how a company can moderate
the effects of a product elimination in consumer loyalty and, at the same time, boost profitability and increase product portfolio effectiveness.
1.4 Research methods
Both primary and secondary data were used to make it possible to collect data to answer to the research questions made. As for primary data, information was quantitatively gathered by conducting a survey. This questionnaire was distributed online for the relationship between the studied variables to be tested in a quantitative way. The only restriction for conducting this survey was to be above eighteen years old, so it was circulated in Portuguese and in English. The main advantages of this quantitative method are the low cost involved and the little time necessary to collect the answers required. However, respondents could get distracted more easily and have memory failures on the subject, which may influence the results. In the end, SPSS statistical software was used to analyze and provide statistical meaning to the survey’s responses. Secondary data was also used in form of academic papers from top journals that focused on Consumer Costs, Satisfaction, Loyalty and their relationship to explain the research questions. Constructs for the studied variables were adapted from existing literature.
1.5 Dissertation outline
The outline of this dissertation will follow a typical dissertation template for Católica-Lisbon Master students. Firstly, a Literature Review will be formulated, which will support the creation of a hypothesis for the different relationships of the conceptual model. Also, the literature review will describe what was already previously studied regarding the different variables of the conceptual model. The third chapter consists of the Methodology that will be used to answer the research questions. Constructs will be identified and tested in the research methods chosen. The fourth chapter will consist on the analysis of the results from the gathered data and present some discussion regarding those results. Finally, the last chapter will state the conclusions from the results, the limitations of the research and indications for further research in the discussed topic.
CHAPTER 2: LITERATURE REVIEW AND CONCEPTUAL FRAMEWORK
This chapter has the objective of elaborating a theoretical framework on the topics related with the main research questions and to support the creation of hypothesis based on previous studies from several academic journals. Initially, some theoretical insights about product elimination were discussed. Afterwards, an introduction was made to the various costs derived from product eliminations. Finally, satisfaction and loyalty after the elimination close the chapter.
2.1 Product Elimination
Product Elimination can be defined as the decision to discontinue the production and marketing of a product either by replacing the product with an alternative offering or by putting an end to a product altogether (Avlonitis, 1986). In this research, product elimination will be treated as a product line contraction, in which the discontinued product belongs to a branded product line. Product elimination process understanding has progressed with some extensive contributions to the area by some authors (e.g. Avlonitis, 1983, 1984, 1985, 1986, 1987; Avlonitis, Hart, & Tzokas, 2000; Avlonitis & James, 1982). These authors considered the product deletion process used by UK industrial and consumer goods organizations and how these processes can be affected by various contextual elements. Avlonitis (1983, 1985, 1986) also commented on a number of cultural issues including employee involvement in deletion decision-making, the frequency with which organizations address deletion issues, and the level of formality to adopt. Some authors also explored brand elimination (e.g. Mao, Luo, & Jain, 2009; Varadarajan, 2006). Mao et al. (2009) studied the consumer reactions to a brand elimination using an attributional perspective and found that, in some circumstances, brand elimination can enhance rather than decrease firm image. Varadarajan (2006) stated the importance of deleting brands so that they can free resources that can be used for growing other brands/products. Homburg et al. (2010) adopted a customer perspective on a B2B context and concluded that a product elimination can result in adverse consequences for customers and for the eliminating company. However, very few studies adopt a consumer perspective in a product elimination context. Gustafsson, Johnson and Roos (2006), explored the potential for different precipitating events, or “triggers”, to moderate the effect of satisfaction on retention. In general, a trigger is a factor or an event that changes the basis of a relationship (Roos, Edvardsson, & Gustafsson, 2004). In the marketing literature, triggers are frequently cast as episodes/critical incidents that can lead to further actions from the consumers and change their perception of the company (Edvardsson
& Strandvik, 2000; Gustafsson, Johnson, & Roos, 2006). When something out of the ordinary occurs, it redirects a consumer’s attention to evaluate present performance more closely, which may put consumers on a switching path (Roos, 1999, 2002). For this research, a product elimination will be treated as a reactional trigger.
2.2 Consumer Costs of Product Elimination
When taken to the extreme, dissolution can be a consequence of eliminating a product (Fajer & Schouten, 1995; Perrin-Martinenq, 2004). Relationship dissolution can be described as the permanent dismembership of an existing relationship (Duck, 1982). Duck indicates that dissolution begins with an intrapsychic stage when one party (consumer) privately evaluates his or her dissatisfaction with the other party (company) and concludes that the cost of continuation or modification outweighs benefit. A good example can be the trauma of Coca-Cola’s attempt to eliminate original Coke (Ringold, 1988) where consumers showed dissatisfaction towards the product discontinuance and even shifted their consumption to the competition.
So that exchange relationships between organizations and individuals could be studied, social
exchange theory (e.g. Homans, 1958; Thibaut and Kelley 1959) has been used extensively
(Cropanzano & Mitchell, 2005; Dwyer, Schurr, & Oh, 1987) and will serve as basis for this research. According to this theory, an exchange partner (e.g. a consumer) evaluates both the expected benefits versus the costs of a given relationship (versus the same relationship with other companies) and the benefits versus the costs of alternative forms of that relationship (Johnson & Selnes, 2004). The consumer evaluates the perceived benefit-cost difference against a specific comparison level that is influenced by various situational factors (Homburg et al., 2010). The more the consumer perceived benefit-cost difference exceeds his/her standard comparison level, the higher is the consumer satisfaction with the relationship. Similarly, the more a consumer perceived benefit-cost difference surpasses his/her comparison level for alternatives, the more likely the exchange partner is to remain in the relationship. Thus, and according to Homburg et al. (2010), the elimination of a product by one exchange partner—a company— may lead to costs for the other partner—a consumer. These costs are likely to affect consumer satisfaction and loyalty by influencing the consumer’s perceived benefit-cost difference of the relationship that is evaluated against the consumer’s standard comparison level and comparison level for alternatives, respectively (Homburg et al., 2010). According to this reasoning, the following hypothesis can be formulated:
H1: Consumer Costs of the Elimination negatively impact Consumer Satisfaction after the Elimination.
H2: Consumer Costs of Elimination negatively impact Consumer Loyalty after the Elimination. Homburg et al. (2010) defined Consumer Costs as being consequences of a product elimination and divided them as Economic and Psychological Costs. Economic Costs symbolize the level of a consumer’s perceived economic load and spending due to the product elimination (Homburg et al., 2010). Thus, the consumer will engage in some economic switching costs in order to find an alternative to the eliminated product. Burnham, Frels and Mahajan (2003) managed to create a typology of consumer perceptions of economic switching costs that will be adopted for this research. In the end, Consumer Costs consist on the combination of several different types of costs that a consumer incurs when faced with a product elimination: Economic Risk, Evaluation, Learning, Set-Up and Psychological Costs (Burnham, Frels, & Mahajan, 2003; Homburg et al., 2010).
2.2.1 Economic Risk Costs
According to Burnham et al. (2003), when a consumer is faced with a product elimination, he sees himself in a situation of uncertainty since he needs to search for alternatives, with insufficient information, to adopt a new product (Burnham et al., 2003; Klemperer, 1995; Samuelson & Zeckhauser, 1988). This is an event with a probability for a negative consequence which can be translated as Economic Risk Costs for the consumer. Perceived consumption risk has been conceived as a six-dimensional construct (Bettman, 1973) but only three dimensions will be considered for this study: financial risk, performance risk and convenience risk. Thus, when faced with Economic Risk Costs, the consumer may have lower perceptions of benefit-cost difference on the relationship with the company, which can influence negatively both satisfaction and loyalty.
H1 a): Economic Risk Costs negatively impact Consumer Satisfaction after the Elimination. H2 a): Economic Risk Costs negatively impact Consumer Loyalty after the Elimination.
2.2.2 Evaluation Costs
Regarding Evaluation Costs, when a product elimination occurs, a consumer will have to spend time and effort to collect, search and analyze the information from the potential different alternatives in order to make a switching decision (Burnham et al., 2003; Samuelson & Zeckhauser, 1988; Shugan, 1980). So that an informed decision can be made, mental effort is necessary to restructure and analyze available information (Shugan, 1980). Following the same reasoning as before, it is possible to predict:
H1 b): Evaluation Costs negatively impact Consumer Satisfaction after the Elimination. H2 b): Evaluation Costs negatively impact Consumer Loyalty after the Elimination.
2.2.3 Learning Costs
With the objective of learning how to effectively use a new product, time and effort costs are required to acquire new skills and expertise – the Learning Costs (Alba & Hutchinson, 1987; Burnham et al., 2003; Eliashberg & Robertson, 1988; Wernerfelt, 1985). Each time a consumer needs to switch to a new provider, new investments need to be made which are normally provider-specific (Burnham et al., 2003; Klemperer, 1995). So, it is possible to predict the following hypothesis:
H1 c): Learning Costs negatively impact Consumer Satisfaction after the Elimination. H2 c): Learning Costs negatively impact Consumer Loyalty after the Elimination.
2.2.4 Set-Up Costs
Setup costs are the time and effort costs associated with the process of setting up a new product for initial use (Burnham et al., 2003; Klemperer, 1995). Loss of utility can be another cost for the consumer since the discontinued alternative could have distinctive features that are not available in any other product in the market which can prolongate the time and effort associated with getting started with a new product (Martin, 2004). Following the previous reasoning for the social exchange theory:
H1 d): Learning Costs negatively impact Consumer Satisfaction after the Elimination. H2 d): Learning Costs negatively impact Consumer Loyalty after the Elimination.
2.2.5 Psychological Costs
Dwyer, Schurr, and Oh (1997) compare the end of personal relationships and the dissolution of commercial relationships in that both involve psychological, emotional, and physical stress. When talking about consumer psychological costs of eliminating a product, the concept of emotional attachment must be evoked (Bowlby 1979; 1980). According to Bowlby, an attachment is an emotional-laden target-specific bond between a person and a specific object. The stronger an individual attachment to an object, the more likely one is to maintain proximity to the object. When individuals experience real or threatened separation from the attachment object, distress can result (Thomson, MacInnis, & Whan Park, 2005).
Normally, consumers are used to have freedom to choose among alternatives in several situations in their daily activities and choosing products is not different (Clee & Wicklund, 1980). A variety of reactions to limitations upon specific freedoms is defined by the theory of psychological reactance (Brehm’s 1966; 1972). This theory proposes that if an individual believes that he/she has a specific freedom, the perception that some event or force has increased the difficulty of exercising that freedom constitutes a threat to it. In response to such a threat to their freedom, individuals will engage in a motivational state to reestablish their ability to engage in the restricted behavior. In a product elimination context, the consumer whose decision alternative is being blocked externally should become increasingly motivated to obtain that alternative (Clee & Wicklund, 1980). Thus, to find that a favorite product is unavailable may enhance the consumer positive attitude towards that product and reduce the evaluation of the product he/she is forced to accept (Mazis, Settle, & Leslie, 1973). Several studies analyzed the manifestation of reactance in response to the withdrawal of consumer
products: candy bars (Hammock & Brehm, 1966), soft drinks (Ringold, 1988), sunglasses
(Wicklund, 1970) and detergents (Mazis et al., 1973). In each of these studies, consumers forced to switch to an alternative product have shown an increase desire for the restricted product and depreciate the alternative offered as substitutes.
Relationship loss costs are the affective losses associated with breaking the bonds of identification that have been formed with the company with which a consumer has associated (Burnham et al., 2003). At the same time, consumers often draw meaning from their purchases and form associations that become part of their sense of identity (McCracken 1986). If the product is no longer available, consumers can form psychological or emotional discomfort due to the loss of identity caused by the product elimination. This emotional response consists as anger and sadness as the most common affective responses and even loss of self-concept (more associated with perfumes) and losses of connections to others in the past (Martin, 2004). Homburg et al. (2010) define psychological costs as the magnitude to which the consumer raises doubts and becomes uncertain about affiliating in a business relationship with the company responsible for the product elimination. They wrote that “these doubts consist on dissonant cognitions and create an unpleasant inner state of tension or uncertainty about the eliminating company’s reliability, flexibility, and cooperativeness” (Homburg et al., 2010). According to the social exchange theory, these costs will reduce the probability that the difference between the benefits and costs surpasses the consumer’s standard comparison level which, as a result, leads to lower consumer satisfaction with the company after the elimination.
H1 e): Psychological Costs negatively impact Consumer Satisfaction after the Elimination. At the same time, an exchange partner will have lower levels of Loyalty if the perceived benefit-cost difference in the relationship does not meet the comparison level for alternatives (Homburg et al., 2010). Following the previous reasoning of social exchange theory:
H2 e): Psychological Costs negatively impact Consumer Loyalty after the Elimination.
2.3 Consumer Satisfaction
Consumer satisfaction is important to the marketer because it is generally assumed to be a significant determinant of repeat sales, positive word-of-mouth, and consumer loyalty (Gustafsson et al., 2006). On the other hand, it is also important to the individual consumer because it reflects a positive outcome from the outlay of scarce resources and/or the fulfillment of unmet needs (Day and Landon 1977; Landon 1977).
Consumer Satisfaction has been considered as a critical construct in marketing and consumer behavior which generated a high amount of research on the processes that take place before
judgements of satisfaction/dissatisfaction and the consequence of those decisions (Bearden & Teel, 1983). The satisfaction judgment is generally agreed to originate in a comparison of the level of product or service performance, quality, or other outcomes perceived by the consumer with an evaluative standard (Westbrook & Oliver, 1991). Normally, the evaluative standard most often assumed is the consumer's prepurchase expectation set, which, when compared to the level of perceived product performance, yields disconfirmation beliefs. These in turn are believed to produce the satisfaction judgment (Bearden & Teel, 1983; Oliver, 1980). Other standards have been investigated in the literature, including desired levels of product performance or outcomes (Westbrook and Reilly 1983), brand or product category norms (Woodruff, Cadotte, and Jenkins 1983), and equity interpretation of sales transaction responses (Oliver & Swan, 1989). Other studies analyzed factors that negatively influence consumer satisfaction with companies (dissatisfaction). Wagner et al. (1999) elaborated a model with a framework for considering how, in a service failure context, service recovery attributes influence consumer evaluations and satisfaction through disconfirmation and perceived justice (Wagner, Smith, Bolton, & Wagner, 1999). Zeelenberg and Pieters (2004) studied the impact of specific emotions (regret and disappointment) on the (dis)satisfaction and subsequent behavior towards a company. Some of those behaviors include complaining, negative WOM and switching to other service providers (Zeelenberg & Pieters, 2004). Oliver (1999) stated another point of view by defining satisfaction as a pleasurable fulfillment that arises from the consumer senses that consumption fulfills some need, desire or goal. Giese and Cote (2009) made a review based on the existing literature and focus groups to suggest a definitional framework of satisfaction in order to be suited to different contextual settings and to ensure that definitions of the construct were consistent with consumer’s view. Thus, consumer satisfaction is a summary affective response with different levels of intensity and focus around product choice with a time-specific point of determination and limited duration (Giese & Cote, 2009). In general, the satisfaction-loyalty literature anticipates the direct, linear, and positive effect of satisfaction on loyalty (Anderson & Mittal, 2000). Yet empirical studies often indicate that the relationship is indirect and complex (Mittal & Kamakura, 2001; Mittal, Ross, & Baldasare, 1998; Oliver, 1999). For satisfaction to affect loyalty, frequent or cumulative satisfaction is needed so that individual satisfaction episodes become aggregated or bended (Oliver 1999). When a product elimination occurs (reactional trigger), consumers will engage in a problem-solving activity and will focus on the present and future performance of the company while waiting to observe how the company handles the situation (Gustafsson et al., 2006). Thus, when
consumers are presented with a reactional trigger situation, the satisfaction-retention link will be weaker.
H3: As overall consumer satisfaction after the elimination increases (decreases), consumer loyalty after elimination also increases (decreases).
Taking into account the several findings stating that Satisfaction improves Loyalty, it would make sense that Satisfaction mediates the negative relationship between Consumer Costs and Loyalty. In fact, positive levels of Satisfaction could attenuate the negative effect of Consumer Costs on Loyalty. Hence, the undermentioned hypothesis is suggested:
H4: Consumer Satisfaction mediates the relationship between Consumer Costs of Elimination and Consumer Loyalty after the Elimination.
2.4 Consumer Loyalty
It is widely accepted that understanding and achieving consumer loyalty is critical for a company’s long-term survival, innovativeness and bottom-line returns (Agustin & Singh, 2005). In fact, small changes in loyalty and retention can translate in large changes in profitability (Reichheld, Markey, & Hopton, 2000). This is a reason why marketing research is shifting its focus of study from simply exchanges as transactions that need to be consummated to exchange of relationships that need to be nurtured, preserved and cultivated (Berry, 1995; Grönroos, 1995; Morgan & Hunt, 1994). However, there are different opinions about the critical factors that enhance and help maintain consumer loyalty for firms. In fact, some researchers advocate that loyalty is achieved and maintained by keeping consumers fully satisfied while exceeding their expectations and fill each exchange with great pleasure and positive emotion (Jones & Sasser, 1995; Rust & Oliver, 2000). Other authors stress the role of trust as an ultimate tool to formulate loyalty (Hart & Johnson, 1999; Sirdeshmukh, Singh, & Sabol, 2002). Sirdeshmukh, Singh, and Sabol (2002) extend this finding by conceptualizing and providing evidence for the partial mediating role of relational value.
Generally, loyalty has been and continues to be defined as: repeat purchasing frequency or relative volume of same brand purchasing (e.g. Mittal & Kamakura, 2001) or even consumer loyalty as those who rebought a brand, considered only that brand and did no brand-related information seeking (e.g. Newman & Werbel, 1973). However, this definitions do not take into account the psychological meaning of satisfaction or loyalty (Oliver, 1999). According to
Oliver (1999), loyalty is defined as “deeply held commitment to rebuy or repatronize a preferred product/service consistently in the future, thereby causing repetitive same-brand or same brand-set purchasing, despite situational influences and marketing efforts having the potential to cause switching behavior”. In fact, there are some obstacles to loyalty (e.g. switching incentives, consumer idiosyncrasies, product unavailability) and Oliver believes that as a last stage of attaining loyalty, consumer will engage in a desire to overcome obstacles that might prevent the act of buying the product. If the consumer is presented with costs after the elimination of a product, their loyalty will be tested and the relationship with the company will be affected. For this research, consumer loyalty after a product elimination will consist on the extent to which the consumer maintains the relationship with the company and continue that relationship in the future (Homburg et al., 2010; Mittal & Kamakura, 2001).
In figure 1 is displayed the conceptual framework with all the studied variables and proposed hypothesis.
CHAPTER 3: METHODOLOGY
In this chapter, the methods used to confirm and reach conclusions for the hypothesis generated based on the Literature Review will be explained in detail. The research design, data collection and analysis that was implemented to study the subject at hand will be presented.
3.1 Research Approach
As discussed on the first chapter, the conceptual framework of this research consists on the effect of the consumer costs of eliminating a product on the consumer satisfaction and loyalty after the elimination towards the eliminating company.
In order to study those relationships, it was adopted an Exploratory and Explanatory research methods to answer the previously formulated research questions. Exploratory research was adopted as a first step to gain familiarity and obtain new insights about the studied topic (Saunders, Lewis, & Thornhill, 2009). This was done by searching the literature for theories that could explain the relationships between the variables of the conceptual framework and if there were already some studies regarding product eliminations on a consumer perspective. Thus, exploratory research allowed a better understanding of the problem but with no conclusive evidence. Explanatory research method was then employed to confirm relationships between variables and understanding how they come together and interact (Saunders, Lewis, & Thornhill, 2009).
3.2 Secondary Data
Secondary data collected for the elaboration of this research consisted on academic articles from top journals and was used more extensively for the Literature Review. Some topics covered include different studies and theories regarding product elimination, the definition of costs for the consumer, how they could be applied to a product elimination and different authors views for consumer satisfaction and loyalty. At the same time, some websites regarding consumer goods industry information and trends were also used to support the academic and managerial implications of this study.
3.3 Primary Data
Primary Data was collected in a quantitative way by adopting a cross-sectional (data collected at one point in time) online survey design. The purpose of a survey is to provide a numeric description of trends, attitudes, or opinions of a population by studying a sample of that population from which the researcher generalizes or makes claims (Creswell, 2009). The online
survey method was adopted for this study because it has advantages such as the low cost of the design and fast data collection. Also, it allows to identify attributes of a large population from a small group of individuals (Babbie, 1990; Fowler, 2002; Creswell, 2009). However, some disadvantages include the fact that some participants may be skeptical about providing sensitive information or they could not be fully aware of their reasons for any given answer because of lack of memory on the subject, or even boredom.
The representative study population in this research includes all the individuals above eighteen years old since the goal of this study is to gather the maximum data possible to better understand consumer reactions to a product elimination. The sample was gathered following a nonrandom, convenience specification in which respondents were chosen based on their convenience and availability (Babbie, 1990) because it is easier, cheaper and faster to collect answers and population representativeness is possible (to a certain extent) (White and Rayner, 2014). The survey instrument used to collect data was Qualtrics website. The online survey has a between subjects’ design, consisted in 29 questions and it was distributed via social media and e-mail between December 7th and December 29th. Initially, participants were asked if they remembered the last time a product they normally used was eliminated. If they remembered a product elimination, participants were asked the product category from which the eliminated product belonged and to answer several questions (which consisted in the constructs of the conceptual framework) regarding their costs, satisfaction and loyalty after the elimination. Corresponding to the selected product category (from the options displayed) it was possible to determine which ones are utilitarian or hedonic categories according to a study did by Professor Rita Coelho in which it was made a classification on the Utilitarian vs Hedonic dimensions of different FMCG product macro-categories (Coelho & Duarte, 2013). However, if the participants did not remember a product elimination, they were presented with a hedonic (chocolate) and a utilitarian (toothpaste) product and asked which one(s) they use/buy. After, they were asked to imagine that the product they selected was eliminated. Then, the same questions (constructs) from the first scenario were presented. Also, if the participant answered that he/she uses/buys both the utilitarian and hedonic product, then they would be evenly randomly assigned to one of the products and asked to answer the same questions as the previous scenario. If the participant answered that he/she does not use/buy any of the presented products, the survey would end. Finally, participants answered some questions regarding demographics.
Since the only restriction for answering the survey is to be above eighteen years old, the questionnaire was distributed in English and in Portuguese. The survey is available on the appendix.
3.4 Construct Measurement
The most appropriate measures to analyze the different variables of this research were selected by doing a review of the literature. Some of the constructs were slightly adapted in order to fit with the objectives of the study but most of them were left in their original format. In figure 2 are displayed the constructs, literature sources and number of items for each construct. For this research, constructs derive from two main articles and were all measured using statements with a 5-point Likert-type scale, most of them from “Strongly Disagree” to “Strongly Agree”. Consumer Satisfaction was measured by asking all survey participants to answer to two items with 5-point Likert-type scale regarding the overall satisfaction of the product elimination itself. One of the items was measured from “Extremely Dissatisfied” to “Extremely Satisfied” and the other from “Extremely bad” to “Extremely good”. However, if the participant remembered a product elimination, he/she would also answer to three items regarding their satisfaction with the eliminating company after the product elimination.
Homburg, Fürst & Prigge, 2010 Zeelenberg & Pieters, 2004
5 Construct Literature for Scale Items Nº of items
Learning Costs Set-up Costs Psychological Costs Consumer Satisfaction
Consumer Loyalty
Burnham, Frels & Mahajan, 2003 Burnham, Frels & Mahajan, 2003 Homburg, Fürst & Prigge, 2010
Homburg, Fürst & Prigge, 2010 Economic Risk Costs Burnham, Frels & Mahajan, 2003
Measurement Model 4 4 3 5 6 Evaluation Costs Burnham, Frels & Mahajan, 2003 4
Figure 2 - Constructs, nº of scale items and relevant literature source
3.5 Data Analysis
In order to test the hypotheses and analyze collected data from the survey, the SPSS program was used extensively. At first, several statistical tests were implemented in order to assure that data was able to be analyzed. Since all variables are numeric, the next step was to assure there was a linear relationship between the independent and dependent variables. After this assumption was checked, it was necessary to determine if bivariate normality occurs or not by plotting histograms, Q-Q plots and analyze the Kolmogorov-Smirnov test. Finally, to determine the level of correlation between all the studied variables and corresponding level of significance, the Pearson Correlation coefficients were computed. For this research and for all statistical tests implemented, a significance level of 5% was used.
Descriptive Statistics and Frequencies consisted on the next statistical tests in order to analyze the number of participants who answered each of survey scenarios and to determine their demographics to provide a sample characterization. After that, several simple and multiple Linear Regressions analysis were computed to measure the effect of the different consumer costs and consumer satisfaction after the elimination on the consumer loyalty after the
elimination. This way, it is possible to predict any data by using the general equation: outcomei
= (model) + errori. So, the outcome that is being predicted for a particular situation can be
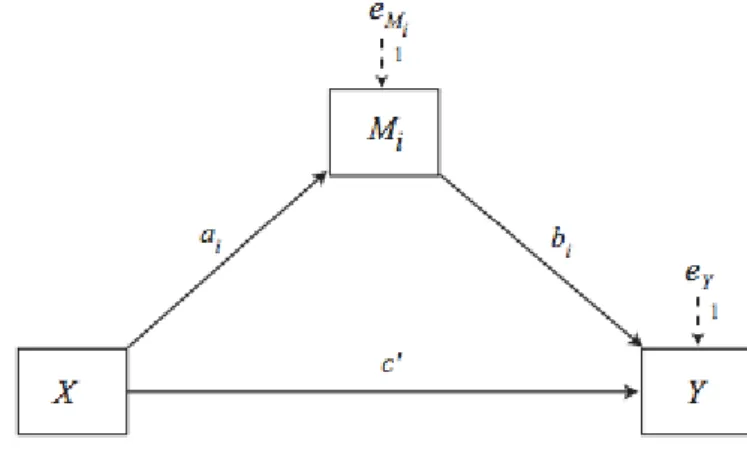
predicted by whatever model that is fitted to the data plus some kind of error. On regression analysis, the model that is fitted is linear, therefore data is summarized with a straight line that best describes it. While simple Linear Regression analysis was used to predict an outcome variable (Loyalty/Satisfaction) from only one predictor (Consumer Costs), multiple Linear Regression analysis allowed to predict the same outcome variable (Loyalty/Satisfaction) from several different predictors (each one of the consumer costs). For the next step, Independent Samples T-Test was implemented in order to verify if there are any differences on the means between the sample of participants who answered the survey for Utilitarian categories/products and the sample of participants who answered for Hedonic categories/products on the same dependent variable (Loyalty). This test was conducted because there were two groups with different participants assigned to each condition and it was necessary to understand if the effect of different category/product dimensions impacts the dependent variable (Loyalty) differently. Finally, so that the mediating effect of Consumer Satisfaction on the relationship between Consumer Costs and Consumer Loyalty could be tested, the PROCESS SPSS add-on designed by Professor Andrew F. Hayes was conducted for model 4: classic mediation (Hayes, 2013) which is displayed on Figure 3. This model of PROCESS add-on allowed to estimate the indirect effect of the independent variable X (Consumer Costs) on the independent variable Y
(Consumer Loyalty) with the presence of a mediator M (Consumer Satisfaction). The indirect effects of X on Y, through M, are represented by path a and b. Path a consists on the effect of X over M and path b the effect of M over Y. Additionally, the effect of X on Y also includes path c’ which represents the direct effect and path c (that is not represented on the figure) which represents the total effect of X on Y, that is, the sum of the direct and indirect effects.
CHAPTER 4: RESULTS AND DISCUSSION
This chapter provides information about the sample characterization collected on the online survey, the reliability of the different constructs used to measure the different variables of the research and, finally, to present the research hypothesis testing analysis.
4.1 Online Survey
4.1.1 Sample Characterization
The online survey was answered by 659 respondents. From these 659 participants, 368 (56%) answered that they remembered a product elimination, identified the eliminated product category and answered the rest of the survey based on their experience. At the same time, 291 (44%) participants did not remember a product elimination and, as explained on the Methodology chapter, were presented with a utilitarian product (chocolate) and a hedonic product (toothpaste). According to the selected product, participants were asked to imagine that
the chocolate/toothpaste they usually use/buy was eliminated and answer the rest of the survey based on that fictional experience. From the 291 participants who did not remember a product elimination, 21 participants answered “Chocolate”, 49 participants answered “Toothpaste”, 215 participants answered “Both” and 6 participants answered “None”. Like previously stated, respondents who answered “Both” were evenly randomly assigned to one of the presented products so in the end, 120 respondents answered questions about “Chocolate” and 165 respondents about “Toothpaste”. Since 6 participants answered “None”, they did not answer to the rest of the survey and will be treated as missing values for the rest of this research. Ultimately, there were 653 valid answers for the entire survey and the rest of the analysis will be done considering this number.
Starting by the gender of the survey participants, the majority is female (64%) while male was less represented in the sample (36%). From those individuals, most of them belong to the age group between 18 and 24 years old (69%) followed by the age group between 25 to 34 years old (20%). Participants with different nationalities answered to the survey but the big majority are from Portugal (85%) followed by respondents from Brazil (5%). Regarding the Education Level, 45% of the respondents achieved an Undergraduate Degree, 33% completed the Highschool Degree and 26% managed to complete a Master’s Degree. Finally, 65% of the participants are currently students and 18% are full-time workers.
4.1.2 Measures Reliability
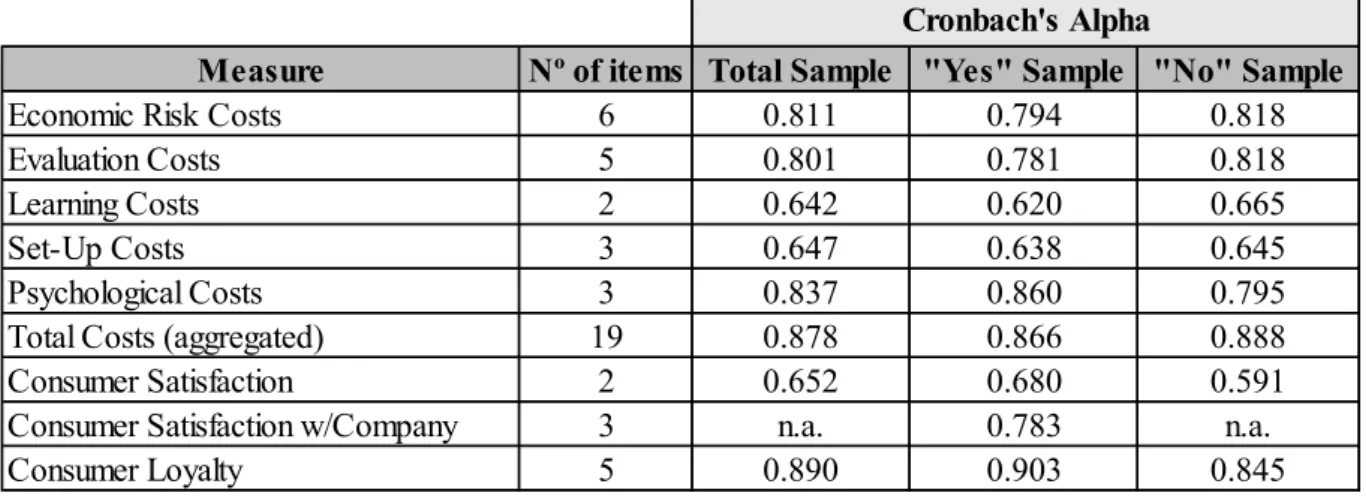
Cronbach’s Alpha was computed in order to measure each scale reliability and to ensure that each variable is well represented by the items provided by the literature. This coefficient of internal consistency allows to determine how closely related a set of items are as a group. According to George, D. and Mallery, P. (2003), Cronbach’s Alpha values above 0.70 are considered as acceptable.
In figure 4 is represented the Cronbach’s Alpha values for each measure studied in this research for the total sample, for the sample of participants who remembered a product elimination (“Yes Sample”) and for the sample of participants who did not remember a product elimination and answered the survey for the fictional elimination of the Chocolate or Toothpaste they normally use/buy (“No” Sample). Although almost all measures have ratings above 0.80 or very close to it, Learning Costs, Set-Up Costs and Consumer Satisfaction variables have questionable ratings (below 0.70). These Cronbach’s Alpha values were obtained even after deleting some items of
the constructs gathered from the literature. For Learning Costs, the items “There is not much involved in understanding a new product well” and “Getting used to how another product works would be easy” were deleted while for Set-Up Costs, the item “The process of starting up with a new product is quick/easy” was removed. However, it was not possible to improve the Consumer Satisfaction measure reliability using the same method. For the rest of the variables, no items were removed. In fact, the Cronbach’s Alpha value of the variable Total Costs was computed by aggregating all items from the five costs presented on this research and has a good reliability, so it was not necessary to remove any item as well.
Figure 4 - Survey measures reliability
4.2 Hypothesis Testing
With the purpose of testing the hypothesis generated through the Literature Review in Chapter 2, several simple/multiple linear regressions and mediation analysis using SPSS and PROCESS add-on were implemented so that the effect of the consumer costs of product elimination and satisfaction after the elimination have on consumer loyalty after the elimination. This analysis was done mostly for the total sample of 653 participants but also for the sample of participants who remembered a product elimination (“Yes” Sample) and for the sample of participants who did not (“No” Sample). This will allow to take some additional conclusions since it is different to answer a survey based on a real product elimination that consumers faced rather than a fictional one. In order to assure data validity of the models and that there was no violation of normality, linearity and multicollinearity assumptions, a preliminary analysis was performed
Measure Nº of items Total Sample "Yes" Sample "No" Sample
Economic Risk Costs 6 0.811 0.794 0.818
Evaluation Costs 5 0.801 0.781 0.818
Learning Costs 2 0.642 0.620 0.665
Set-Up Costs 3 0.647 0.638 0.645
Psychological Costs 3 0.837 0.860 0.795
Total Costs (aggregated) 19 0.878 0.866 0.888
Consumer Satisfaction 2 0.652 0.680 0.591
Consumer Satisfaction w/Company 3 n.a. 0.783 n.a.
Consumer Loyalty 5 0.890 0.903 0.845
successfully. For all analysis, the unstandardized coefficients were used because all variables were measured in the same way.
4.2.1 Results for the total sample
Hypothesis 1 - Linear Regression Analysis: Consumer Costs of Product Elimination negatively impacts Consumer Satisfaction after the Elimination
For the first hypothesis, the objective was to test if the independent variable(s) Consumer Costs of Elimination will negatively influence Consumer Satisfaction after the Elimination considered in this scenario as the dependent variable. This analysis was done considering the different Consumer Costs involved (Economic Risk Costs, Evaluation Costs, Learning Costs, Set-Up Costs and Psychological Costs) and all of them aggregated as a whole.
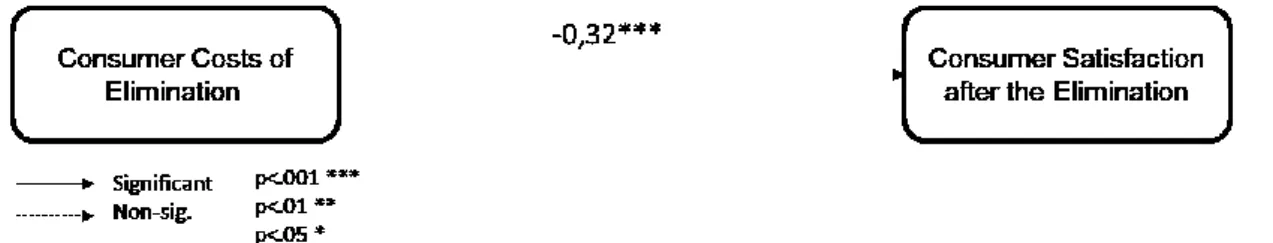
In order to analyze the relationship between Consumer Costs (aggregated) and Consumer Satisfaction, a simple linear regression was performed by using the Enter method. It was observed that Consumer Costs only accounts for 8.8% of the variation in Consumer Satisfaction (Adjusted R2 = 0.088) meaning there are other variables that have influence on Consumer
Satisfaction. However, the results show that, assuming a significance level of 5%, Consumer Costs (aggregated) predicts Consumer Satisfaction negatively and significantly (F (1, 652) =
63.843, B = -0.32, t = 7.990, p < 0.001). This means that if Consumer Costs increase by one unit, then the model predicts a decrease of 0.32 units (32%) on Consumer Satisfaction (variable relationship is demonstrated on figure 5). At the same time, when studying the Pearson correlation coefficient (r = -.299, p <0.001) between the variables, it is possible to identify a significant negative correlation, which means that increases in Consumer Costs will lead to decreases on Consumer Satisfaction. Thus, the results support Hypothesis 1.
To analyze the separate effects of the different Consumer Costs on Consumer Satisfaction, a multiple Linear Regression was performed on SPSS by using the Enter method. This model is appropriate to explain Consumer Satisfaction from Economic Risk Costs, Evaluation Costs, Learning Costs, Set-Up Costs and Psychological Costs because there is at least one predictor that has a significant effect on Consumer Satisfaction (F (5, 652) = 14.616, p < 0.001). However,
the five different Consumer Costs account only for 9.5% of the variance on Consumer
Satisfaction (Adjusted R2 = 0.095) but reflects an improvement when comparing with the
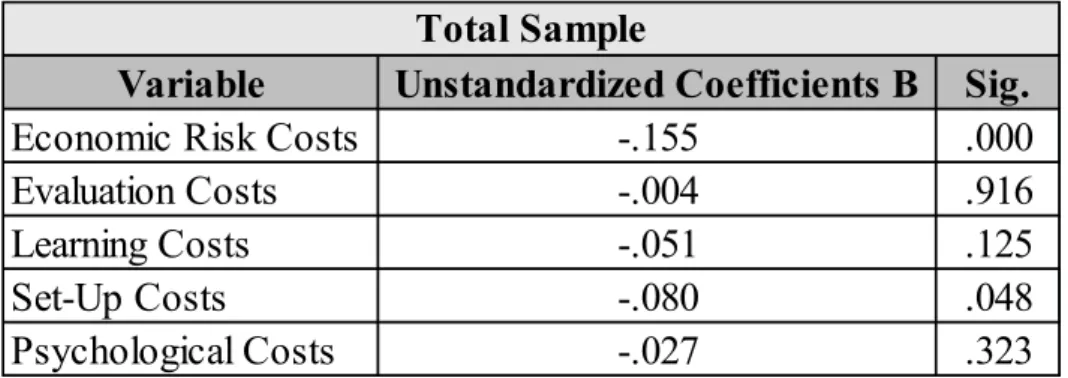
previous model. In figure 6 are presented the unstandardized coefficients B and p-values for each of the Consumer Costs.
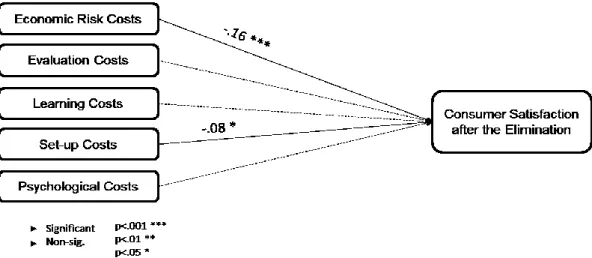
After observing the coefficient and p-value (B = -0.155, p < 0.001), it can be concluded that for every unit increase in Economic Risk Costs, the Consumer Satisfaction will decrease by 0.155 points (16%) when all other variables remain constant. These results validate Hypothesis 1 a). Regarding Set-Up Costs (B = -0.08, p < 0.05), it is observable that if a consumer’s Set-Up Costs increase by one unit, then Consumer Satisfaction decreases by 0.08 units (8%). Consequently, Hypothesis 1 d) is confirmed. However, it was not possible to analyze Hypothesis 1 b), c) and e) because the coefficients from the regression were not statistically significant. In figure 7, is displayed the interaction between all variables of this model for the total sample.
Variable
Unstandardized Coefficients B
Sig.
Economic Risk Costs
-.155
.000
Evaluation Costs
-.004
.916
Learning Costs
-.051
.125
Set-Up Costs
-.080
.048
Psychological Costs
-.027
.323
Total Sample
Hypothesis 2 and 3 – Linear Regression Analysis: Consumer Costs of Product Elimination negatively impact Consumer Loyalty after the Elimination; As Overall Consumer Satisfaction after the Elimination increases (decreases), Consumer Loyalty after Elimination also increases (decreases).
Starting by testing the hypothesis of aggregated Consumer Costs impact on Consumer Loyalty (Hypothesis 2), a simple Linear Regression was performed using the Enter method involving
only both variables on the model. Since the Adjusted R2 was only 0.03, the variable Consumer
Satisfaction was introduced in order to try to improve the model. In fact, by performing a multiple Linear Regression including Consumer Satisfaction, allowed an improvement of the
model Adjusted R2 to 0.05 and contributes to better explain the model. Thus, the model with
Consumer Costs, Consumer Satisfaction and Consumer Loyalty will be considered for the
analysis of the second and third hypothesis. In the end, and since the model is significant (F (2,
652) = 17.986, p < 0.001), the results show that Consumer Costs (aggregated) predicts Consumer
Loyalty negatively and significantly (B = -0.175, p < 0.01). More specifically, for every unit increase in Consumer Costs, Consumer Loyalty will decrease by 0.175 units (18%). So, there is evidence to uphold Hypothesis 2. At the same time, it is observable that Consumer Satisfaction have a positive and significant effect on Consumer Loyalty (B = 0.185, p < 0.001). Thus, for every unit increase on Consumer Satisfaction, Consumer Loyalty increases by 0.185 points (19%). Also, by analyzing the Pearson correlation coefficient (r = .19, p <0.001) between both variables, it is possible to identify a positive and significant correlation which means that
Figure 7 - Separate Costs and Satisfaction relationship for total sample (Hypothesis 1a, 1b, 1c, 1e and 1d)
increases in Consumer Satisfaction will lead to increases in Consumer Loyalty. These results allow to validate Hypothesis 3. In Figure 8 is displayed the interaction between each one of the variables of the studied model.
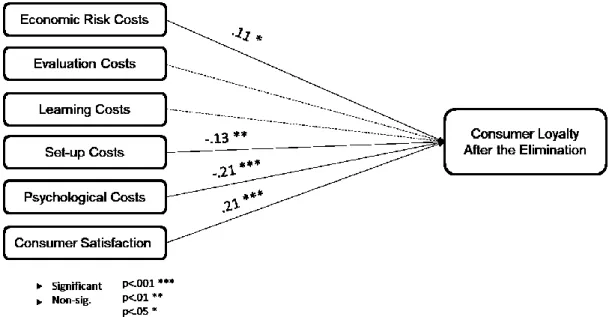
With the purpose of studying the effect of the separate Consumer Costs on Consumer Loyalty (Hypothesis 2 a) to e)), a multiple Linear Regression was performed using the Enter method.
The computed Adjusted R2 was only 0.09 so, like in the previous scenario, Consumer
Satisfaction was included in the model which contributed to increase the Adjusted R2 to 0.114.
Thus, Consumer Satisfaction contributes to predict Consumer Loyalty and will be considered in this model. In figure 9, are presented the unstandardized coefficients B and respectively p-values for each of the studied variables.
Figure 9 - Multiple Regression Coefficients for total sample (Hypothesis 2 and 3)
Variable
Unstandardized Coefficients B
Sig.
Economic Risk Costs
.107
.023
Evaluation Costs
-.038
.402
Learning Costs
.078
.052
Set-Up Costs
-.130
.009
Psychological Costs
-.213
.000
Consumer Satisfaction
.208
.000
Total Sample
This model is significant (F (6, 652) = 14.968, p < 0.001) which allows to analyze the different
coefficients for each variable. Starting by the variable Economic Risk Costs, it can be observed that the associated coefficient is positive and significant (B = 0.107, p < 0.05). Thus, holding all other variables constant, when Economic Risk Costs increase by one unit, Consumer Loyalty will increase 0.107 units (11%). Therefore, Hypothesis 2 a) is rejected. On the other hand, Set-Up Costs have a contrary effect over Consumer Loyalty. According to the observed coefficient (B = -0.13, p < 0.01), if Set-Up Costs increases by one unit, Consumer Loyalty will decrease 0.13 points (13%). So, it is possible to validate Hypothesis 2 d). At the same time, Psychological Costs conveys a negative and significant coefficient (B = -0.213, p < 0.001) which means that for each unit increase on Psychological Costs, Consumer Loyalty will decrease by 0.213 units (21%). This allows to accept Hypothesis 2 e). Moreover, and in line with the previous model, Consumer Satisfaction presents a positive and significant coefficient (B = 0.208, p < 0.001) which mean consumers with increased levels of satisfaction after the product elimination tend to have increased loyalty levels after the elimination. Once more, Hypothesis 3 is verified. Also, for this model, it was not possible to test Hypothesis 2 b) and c) because the linear regression coefficients associated with Evaluation and Learning Costs were not significant at a 5% level. In figure 10, is displayed a diagram that illustrates the several variables relationships for this model.
Figure 10 - Separate Costs, Satisfaction and Loyalty relationship for total sample (Hypothesis 2a, 2b, 2c, 2d, 2e and 3)
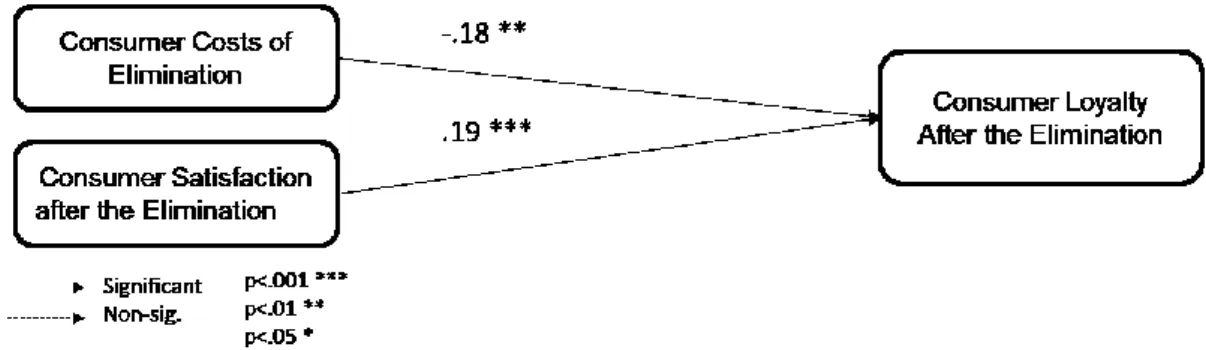
Hypothesis 4 – Mediation Analysis: Consumer Satisfaction mediates the relationship between Consumer Costs of Elimination and Consumer Loyalty after the Elimination
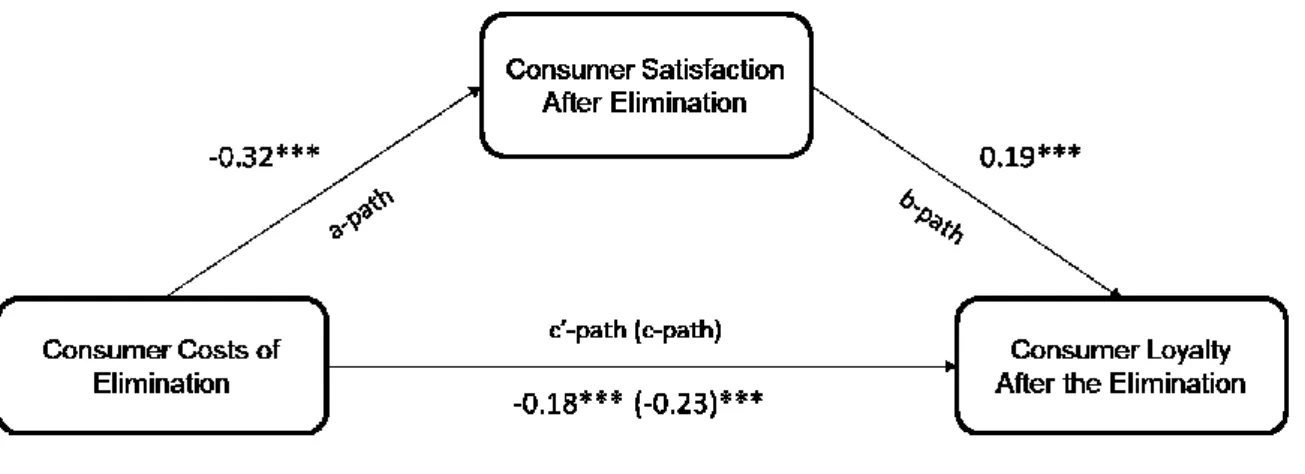
The PROCESS add-on for SPSS written by Prof. Hayes was used to test the mediating effect of Consumer Satisfaction on the (negative) relationship between Consumer Costs and Loyalty. The implemented model was Model 4 which represents a “Classic Mediation”. In order to test Hypothesis 4, the total sample was considered as the objective was to understand the mediating role of Satisfaction. In a Linear Regression, the total effect (c-path) of the independent variable (IV) on the dependent variable (DV) is only taken into account. Meditation analysis consists in understanding the process through which a predictor variable affects an outcome and builds on a Linear Regression by adding a third variable (the mediator). In the end, with the presence of a mediator, the direct effect (c’-path) of the IV on the DV should be smaller. Therefore, the goal is to unfold if the difference between the total effect and the direct effect (c-path minus c’-path), which is known as the indirect effect, is statistically significant. For this research and to test the significance of the indirect effect, the bootstrapping method was implemented. Bootstrapping is a robust analysis technique that can be applied to non-normal data and consists in creating some different simulated datasets from the studied sample. Then, the analysis is performed once in each of those datasets (in this research was done for 5000 bootstrap samples) and 95% of the generated statistics will fall between two numbers. If zero is not present in that interval, then it is possible to conclude that the indirect effect is significant (p < 0.05) and that mediation occurs. Finally, to calculate the effect sizes, the Percent Mediation measure was performed which consists on the percentage of the total effect (c-path) accounted for the indirect effect. This was calculated by using the formula: PM = (a*b)/c being a the a-path, b the b-path and c the total effect of the IV on the DV.
So that it could be possible to test Hypothesis 4, Consumer Costs (aggregated) were considered as the independent variable, Consumer Satisfaction as the mediator and Consumer Loyalty as the dependent variable. From the results generated from the first model, it was possible to observe that Consumer Costs negatively impact Consumer Satisfaction (a-path: B = -0.32, p <
0.001) and that the model has an R2 of 0.0893. This result goes in line with what was previously
tested in Hypothesis 1. The second model considers both Consumer Costs and Satisfaction effects on Loyalty. The outcome shows that Consumer Satisfaction positively impact Consumer Loyalty (b-path: B = 0.19, p < 0.001) like previously studied on Hypothesis 3. At the same time, and as previously tested on Hypothesis 2, the negative direct effect (c’-path) of Consumer Costs
in Consumer Loyalty is significant (c’-path: B = -0.18, p < 0.001) and it is lower than the total effect (c-path: B = -0.23, p < 0.001) which means that mediation occurs. To confirm this result, it is possible to verify a significant indirect effect of Consumer Costs on Consumer Loyalty (Indirect Effect: -0.06, 95% CI = [-0.09; -0.02] because zero is not presented on the bootstrap confidence intervals. Finally, to better understand the mediator effect size accountability, the Percent Mediation was calculated: PM = (-0.32*0.19)/-0.23 = 0.2643. This means that Consumer Satisfaction (mediator) is responsible for 26.4% of the total effect of Consumer Costs on Loyalty. Thus, it is possible to accept Hypothesis 4. A diagram to better explain this relationship is presented in Figure 11.
Figure 11 - The mediating role of Satisfaction on the relationship between Costs and Loyalty for total sample (Hypothesis 4)
4.2.2 Results for the “Yes” sample
Hypothesis 1 – Linear Regression Analysis: Consumer Costs of Product Elimination negatively impact Consumer Satisfaction after the Elimination
Similar to the analysis done for the total sample, a simple Linear Regression by using the Enter method was performed for the sample of participants who did remember a product elimination to study the relationship between Consumer Costs and Satisfaction. Starting by considering
Consumer Costs as a whole, the model had an Adjusted R2 of 0.087 and was significant (F
(1, 367) = 36.096, p < 0.001). Also, it was observed that Consumer Costs have a negative and