An Analysis of the Factorial Structure of the Teacher Communication Behavior
Questionnaire with Brazilian High School Science Students
1Daniel Abud Seabra Matos2 Universidade Federal de Ouro Preto
Walter Lana Leite University of Florida Gavin Thomas Lumsden Brown
The University of Auckland Sérgio Dias Cirino
Universidade Federal de Minas Gerais
ABSTRACT - The Teacher Communication Behavior Questionnaire (TCBQ) has been used at different levels of education in many countries to measure students’ perceptions of their science teachers’ communication behavior. The TCBQ was translated into Portuguese in accordance with ITC test adaptation standards. Validity evidence for the Brazilian version of the TCBQ was
obtained with a sample of 414 secondary students. The internal consistency of the TCBQ was satisfactory and an adequate it of the original factor model was found through conirmatory factor analysis. The Brazilian data exhibited inter-factor correlations similar in value and direction to those of previous international studies. Statistically signiicant differences were found between
school type and subject matter, which is consistent with previous studies.
Keywords: student perception, classroom learning environment, science education
Uma Análise da Estrutura Fatorial do Teacher Communication Behavior
Questionnaire com Alunos Brasileiros de Ciências no Ensino Médio
RESUMO - O Teacher Communication Behavior Questionnaire (TCBQ) tem sido usado em níveis de ensino diferentes, em muitos países, com o objetivo de mensurar a percepção dos alunos do comportamento comunicativo do professor de ciências. O TCBQ foi traduzido para o Português de acordo com os padrões de adaptação de testes da ITC. Evidência de validade para a versão brasileira do TCBQ foi obtida com uma amostra de 414 estudantes do ensino médio. A consistência interna do TCBQ
foi adequada e um ajuste adequado do modelo fatorial original foi encontrado por meio de análise fatorial conirmatória. Os
dados brasileiros apresentaram correlações entre fatores similares, no valor e na direção, às de pesquisas internacionais. Foram
encontradas diferenças estatisticamente signiicantes entre tipo de escola e matéria consistentes com pesquisas anteriores.
Palavras-chave: percepção do estudante, ambiente de aprendizagem da sala de aula, ciências
1 Apoio: Fundação de Amparo à Pesquisa do Estado de Minas Gerais (FAPEMIG)
2 Endereço para correspondência: Departamento de Educação, Universidade Federal de Ouro Preto, Instituto de Ciências Humanas e Sociais, Rua do Seminário, s/nº Centro, Mariana, MG, Brasil. CEP: 35420-000. E-mail: [email protected]
Positive classroom learning environments depend on teachers’ interpersonal skills to create positive teacher-student relationships (Wubbels, Levy, & Brekelmans, 1997). Classroom learning environments have received substantial attention from researchers, teachers, and schools (Dorman, 2002). At least ten different psychometrically-evaluated inventories have been reported as means of obtaining students’ perceptions of the quality of the classroom learning environment (Chen, Chang, & Chang, 2002; Fraser, 2002; Idiris & Fraser, 1994; She & Fisher, 2000; Sebela, 2003; Waldrip & Fisher 2000; Walker, 2004; Wubbels & Levy, 1991). These scales have been used to assess the quality of classroom learning environments in North America, Europe, Asia, and Africa. Despite this internationalization, we noted the absence of instruments to measure students’ perceptions
of the classroom learning environment for use in South American countries.
Among these scales, the Teacher Communication Behavior Questionnaire (TCBQ) assesses both verbal and non-verbal communication between teachers and students. The TCBQ has been validated with Taiwanese and Australian samples and used in the United States, United Kingdom, and Turkey. In this study, our primary goal is to adapt the student version of the TCBQ for use in Brazilian high school
classrooms. Additionally, we examine the factor structure of the TCBQ with conirmatory factor analysis (CFA), an
advanced psychometric method that has not previously been reported for this scale. Therefore, the version of the TCBQ we develop in this study contributes to research tools for measuring classroom learning environments in
Portuguese-speaking contexts, as well as adding to the body of validation
studies for the TCBQ inventory.
To evaluate the TCBQ adaptation for use with Brazilian high school students, the Brazilian results were analyzed
with CFA to determine if the ive-factor structure could
Additionally, the study provides a preliminary evaluation of whether student perceptions of teacher communication behaviors in Brazilian high school classrooms depend on the gender of the student, gender of the teacher, type of school (i.e., public or private), and subject matter (i.e., biological science or physical science).
The following sections contain (1) a review of the theoretical framework underpinning the TCBQ and (2) an evaluation of the scale reliability estimates and inter-scale correlations obtained in different countries.
Theoretical framework
Within the broad research area of classroom learning environments, concern regarding the study of teacher-student relationships has been based largely on the work of Wubbels (Wubbels & Brekelmans, 2005; Wubbels & Levy, 1991; Wubbels et al., 1997). Wubbels was interested in teacher-student relationships from a systems theory perspective (Watzlawick, Beavin, & Jackson, 1991). Systems theory emphasizes the connections between a group of individuals and the feedback mechanisms by which the individuals
mutually inluence each other. Social situations are deined
as systems because changes in one aspect of the system cause changes in other aspects. The systems perspective implies that teacher-student relationships are not unidirectional. That is, the teacher’s and students’ behaviors mutually and partially determine and are determined by each other.
Furthermore, everything that happens in a classroom can be considered communication (e.g., students’ silence during class, non-verbal behaviors, indiscipline, etc.). Wubbels developed a model for interpersonal teacher behavior based on two dimensions of the teacher-student
relationship,influence and proximity. The influence
dimension varies from dominance to submission, while the
proximity dimension varies from opposition to cooperation. Based on these dimensions, Wubbels created a taxonomy
of eight types of teacher behavior: (a) leading, (b) helpful/ friendly, (c) understanding, (d) student responsibility/ freedom (e.g., giving freedom and responsibility for the students or giving opportunity for independent work), (e)
uncertain, (f) dissatisied, (g) admonishing, and (h) strict
(Wubbels & Brekelmans, 2005). To measure these behavior types, Wubbels and Levy (1991) developed the 77-item Questionnaire on Teacher Interaction (QTI) which has been translated into several languages.
She and Fisher (2000, 2002) developed the Teacher Communication Behavior Questionnaire (TCBQ) from the QTI. The development of the TCBQ was also based on She’s studies of teacher-student interactions in Taiwanese science classrooms (She, 1998, 1999, 2000). For instance, She (2000) analyzed teacher-initiated questions, student responses, and teacher feedback in two 7th-grade biology classes. The study reported that male students answered teacher-initiated questions at a much higher frequency than female students and received more frequent feedback from the teacher (She, 2000). Important aspects of this and other studies, such as type of questions in the classroom,
teacher-initiated questions, and teacher-student relationship (i.e., feedback and support), were used to create the TCBQ scales. The TCBQ measures students’ perceptions of science teachers’ communication behavior with five scales: (a)
challenging (i.e., extent to which the teacher uses
higher-order questions to challenge students in their learning),
(b) encouragement and praise (i.e., extent to which the
teacher praises and encourages the students), (c) non-verbal
support (i.e., extent to which the teacher uses non-verbal
communication to interact positively with the students),
(d) understanding and friendliness (i.e., extent to which the
teacher is understanding and friendly towards students), and
(e) controlling (i.e., extent to which the teacher controls and
manages student behavior in class) (She & Fisher, 2000,
2002). The questionnaire has 40 items (see Appendix A) with
8 items for each scale. The students responded on a 5-point frequency scale: 1=almost never, 2=seldom, 3=sometimes, 4=often, and 5=very often.
The TCBQ was developed simultaneously in Australia and Taiwan to assess student perceptions of their science teachers’ communication behaviors. We chose to adapt this instrument to Brazilian classrooms because of its comprehensive coverage of student perceptions of teachers’ verbal and non-verbal behaviors and attitudes. The TCBQ can be used to provide teachers with feedback about their behaviors in the classroom and facilitate the improvement of classroom environments. Two forms of the TCBQ have been developed, one for students and another for teachers (She, 2000). We focus on the student version because it is particularly useful for gaining insights into how students perceive the teachers’ communication behaviors. Receiving
feedback on the ive aspects of teacher-student relationship
is most useful for teacher continuous professional learning. Researchers have used classroom learning environment dimensions (e.g., size of class, type of school, grade level, and subject matter) as independent variables in studies of
variation in classroom environments. For example, the effect
of student gender is most widely studied in Asia (Fraser, 2002), with the results showing that girls, compared to boys, tend to (a) perceive their learning environments more positively (Fraser, Giddings, & McRobbie, 1995; Khine & Fisher, 2003; She & Fisher, 2002), (b) report higher levels of encouragement and praise (Frumkin, 2006), (c) have more
positive perceptions of all ive TCBQ factors (Frumkin &
Murphy, 2007), and (d) perceive their teachers as providing
more encouragement and praise and exhibiting greater
understanding and friendlier behaviors (Özay, Kaya, & Sezek, 2004; Yilmaz Tüzün, 2006). In contrast, male students have reported to perceive their teachers as more controlling (Yilmaz Tüzün, 2006).
There is evidence of positive associations between students’ cognitive learning outcomes and their perceptions of the classroom learning environment (Fraser, 2002). As
expected, subject matter has been found to inluence student
Authors Country Sample size Level Subject She & Fisher, 2000 Australia and
Taiwan
1202 (Taiwan) 301 (Australia)
Secondary (grades 7 to 9)
Science classes
She & Fisher, 2002 Australia and Taiwan
1138 (Taiwan) 307 (Australia)
Secondary (grades 7 to 9)
Biological / physical science
Özay, Kaya & Sezek, 2004 Turkey 389 Secondary
(grades 7 to 9)
Biological / chemical / physical science
Yilmaz Tüzün, 2006 Turkey 751 Elementary
(grades 4 to 8)
Science classes
Cirillo & Herbel-Eisenmann, 2006 USA 178 Secondary
(grades 7 to 10)
Mathematics
Frumkin, 2006 United Kingdom 86 Tertiary
(MSc students)
Computing Science
Frumkin & Murphy, 2007 United Kingdom 113 Tertiary (MSc students)
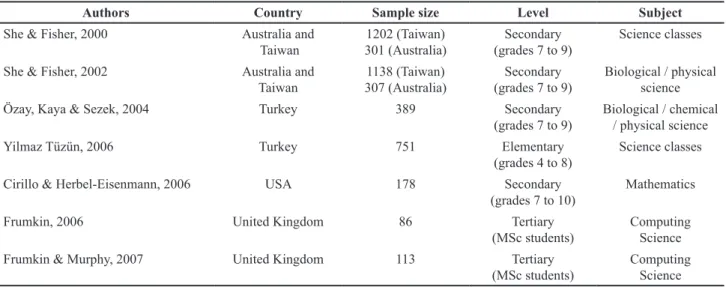
Computing Science Table 1. TCBQ studies from six countries
Cronbach’s alpha coeficients Mean inter-correlation with other scales
TCBQ Scale Australia Taiwan Turkey USA Australia Taiwan Turkey USA Mean
Challenging .86 .88 .70 .85 .37 .40 .62 .53 .48
Encouragement & praise
.87 .91 .77 .90 .44 .50 .61 .57 .53
Non-verbal support .92 .93 .86 .93 .44 .50 .51 .55 .50
Understanding & friendly
.93 .92 .86 .94 .39 .47 .54 .52 .48
Controlling .87 .87 .76 .87 .05 .14 .19 .31 .17
Table 2. Comparison of TCBQ psychometric properties in samples from four countries
Note. Sample sizes: Australia (n=307), Taiwan (n=1138), Turkey (n=751), USA (n=178) With respect to the differences between the students’
perceptions of their male and female teachers, several studies
found no signiicant interactions between teachers’ gender
and students’ gender (Fagot, 1981; Stake & Katz, 1982). However, studies employing the TCBQ found interactions
between teachers´ gender and students´ gender. For example,
Cirillo and Herbel-Eisenmann (2006) found that male students rated their male teachers higher on all factors and female students rated their female teachers higher on all TCBQ factors. Frumkin and Murphy (2007) reported no difference between teachers’ gender, but found that female, rather than male students, rated both male and female teachers higher on all TCBQ factors.
Studies using the TCBQ
A broad literature search was carried out among international databases (i.e., Academic Search Premier, Mental Measurements Yearbook, Professional Development Collection, PsycINFO, Psychology and Behavioral Sciences Collection, and Research Starters - Education), as well as on Brazilian databases (i.e., Scielo, Pepsic), for keywords ‘Teacher Communication Behavior Questionnaire’ and ‘TCBQ”. We also searched the following combinations of keywords: ‘student conception’ and ‘classroom learning environment’, ‘student perception’ and ‘classroom learning
environment’, and ‘student representation’ and ‘classroom learning environment’. Studies were selected if they directly used the TCBQ to collect data and provided reliability information. Although two of the studies did not report internal consistency estimates for the TCBQ scales, this information was obtained from the corresponding authors. A
total of seven studies meeting these criteria were identiied
(see Table 1).
The TCBQ’s use in ive countries included all levels of
education, although mostly were in science classes. Two studies involved distance education programs (Frumkin, 2006; Frumkin & Murphy, 2007). Frumkin (2006) reported a virtual learning environment (VLE) study of 86 students (53
Asian and 33 Caucasian) who lived in the United Kingdom or had recently moved there. Frumkin and Murphy (2007) investigated a distance learning project originated at a British university involving a sample of 113 students (47 citizens of European Union countries and 66 Chinese students). Because these studies used participants living in different countries,
results relected complex cross-cultural differences among
students and teachers, rather than being robust indicators of TCBQ factors in the host countries. Consequently, the statistical properties of the TCBQ are reported for just four
countries for which we can be conident of the participant
Evidently, the Cronbach’s alpha coefficients were consistently high for all scales in four countries (i.e., ranging
between .83 and .94), with the exception of Turkey where
values ranged from .70 to .86. Nevertheless, these studies
demonstrated that the TCBQ scales had suficiently similar
and robust internal estimates of reliability despite differences in language and geography.
In the development of the TCBQ, She and Fisher (2002) reported the mean inter-scale correlations for each TCBQ scale as evidence of discriminant validity. Correlations ranged from .05 to .62, depending on the country. These values can be considered small enough to confirm the independence of each scale; hence, the structure of the TCBQ
as ive distinct factors is supported. However, none of the international studies reviewed employed CFA to examine
the factorial structure of the TCBQ. Thus, the goal of this study was to analyze the underlying dimensions of the TCBQ
with conirmatory factor analysis, a powerful psychometric
technique for identifying dimensionality (Hoyle & Duvall, 2004).
Method
In this section, we describe how we adapted the TCBQ for use with Brazilian students1 following the guidelines from the International Test Commission (ITC, 2000b) and collected valid evidence according to established test development standards (AERA, APA, & NCME, 1999).
Adaptation of the TCBQ
Test developers should (a) provide evidence that item content is familiar to all intended populations; (b) insure that the adaptation process takes full account of linguistic and cultural differences among the populations; and (c) implement systematic judgmental evidence, both linguistic and psychological, to improve the adaptation process (ITC, 2000b). Hence, validity evidence for the translated questionnaire with respect to scale content and response process was obtained through three qualitative procedures (i.e., back translation from Portuguese to English, interviews with prospective users of the questionnaire, and pilot administration of the Brazilian questionnaire). Then, we conducted a large-scale administration of the TCBQ to obtain validity evidence with respect to the scale’s internal structure
using CFA and estimation of scale reliability coeficients.
The TCBQ was translated from English to Portuguese for use in Brazil. Back translation procedure is a commonly-used procedure to evaluate the quality of a translation
(Harkness & Schoua-Glusberg, 1998). The irst and fourth
authors of the present study translated the English TCBQ into Portuguese and back translations into English were performed independently by three researchers not involved in the original translation. Based on the results of the
back-1 This research was submitted to the Ethics Committee of the Universi-dade Federal de Minas Gerais (process number 163-05) and followed all the rules and guidelines contained in Resolution 196/96.
translation, some modiications were made to the wording of
the items in the Brazilian version to match more closely the functional meaning of the English version. For instance, the
irst translation of item 19 was “sem falar, esse professor(a)
demonstra apoio para mim pela sua expressão facial”. After
the back-translation procedure, the item was modiied to “sem falar, esse professor(a) demonstra, pela sua expressão facial, que me apoia”.
Next, feedback from potential future users of the
questionnaire was obtained. Ten 9th grade science students from three different Brazilian schools were interviewed. The
students were distributed into three groups. The irst group
contained four boys from a private school, the second group contained four girls from a second private school, and the third group contained two girls from a public school. The objective of the interviews was to obtain insights as to how the students understood the questionnaire, its sub-scales, and items. We also obtained fresh points of view from the students about their classes and their answers to the questions. Subsequently, a pilot administration of the Brazilian TCBQ was conducted in one classroom of 33 students in
a public secondary school. This procedure conirmed that
students did not have any problems understanding and responding to the adapted Brazilian TCBQ. These three
procedures provided suficient evidence that the Brazilian
version of the TCBQ was equivalent to the English version and that the items were appropriate for administration to Brazilian secondary school science students.
The ITC (2000a) guidelines also require the use of appropriate statistical techniques to establish the equivalence of the different versions of the instrument. To establish that the scale scores of an adapted instrument are valid and
reliable, factor analytic, experimental or other correlational
information can be used (Hambleton & Patsula, 1999). Thus, we collected data for a CFA of the Brazilian TCBQ through a survey of 414 9th grade science students. The translated items
for the TCBQ are provided in Appendix A.
Participants
Responses to the TCBQ were obtained from a large, non-random sample of Brazilian science students enrolled in 9th
grade, the irst year of secondary education, (N = 414; 195
males and 219 females; age M = 15.33 years; SD = .71). Five of nine invited schools, all located in Belo Horizonte, the third largest city in Brazil, provided students from: private school A (n = 18); public school B (n = 102); private school C (n = 91); public school D (n = 130); and private school E (n = 73). Thus, the students were split relatively evenly between public (n = 232) and private (n = 182) schooling (details in Table 3). In Brazilian standardized tests for primary and secondary education, the mean academic achievement scores of private school students are generally higher than those of public schools students. While no studies with the
TCBQ have examined the relationship between achievement
Student gender
Demographic Factor Female Male Total
Type of School
Private 97 85 182
Public 122 110 232
Science Subject Studied
Biological Science 113 120 233
Physical Science 106 75 181
Teacher Gender
Female (n=7) 114 113 227
Male (n=6) 105 82 187
Total 219 195
Table 3. Participants in Brazilian TCBQ study
secondary science curriculum divides the subject area into three separate courses: biology (n = 233), physics (n = 181), and chemistry (not included in our study).
The students had 13 teachers (7 female and 6 male), but more students had a female teacher (n = 227) than a male teacher (n = 187) (see Table 3).
Data Analysis
The software MPLUS version 4.2 (Muthén & Muthén, 2006) was used for this analysis. The CFA was conducted using the mean and variance-adjusted weighted least squares estimator (WLSMV). Standard errors were obtained with Taylor Series linearization (Stapleton, 2006) to account for clustering effects due to students being grouped within classrooms. The equation of the CFA model used was γіј =
λјкпік + Ɛіј , where i indicates a student, j indicates an item, k indicates each of the factors of the TCBQ, γіј corresponds to the observed score of a student on an item, λјк is the loading of an item on a factor, пік is the factor score of a student on a factor, and Ɛіј is a residual error.
In order to evaluate model it, the χ2 statistic and multiple it indices (i.e. CFI, TLI, gamma hat, RMSEA, and SRMR) were examined (Fan & Sivo, 2007; Hu & Bentler, 1999).
Recently, it has been shown that Hu and Bentler’s criteria are too restrictive when applied to multi-factor rating instruments (Marsh, Hau, & Wen, 2004; Marsh, Hau, &
Grayson, 2005). The criteria of CFI ≥ .90, TLI ≥ .90, gamma hat ≥ .90, RMSEA ≤ .08 and SRMR ≤ .08 were used to establish adequate it, rather than the more strict cutoff criteria
proposed by Hu and Bentler (1999).
There have been no previously reported studies of the TCBQ in Brazil. Thus, we evaluate in this paper whether TCBQ results found in other countries generalize to Brazil. We tested four hypotheses about main effects and one
hypothesis about a two-way interaction using the scores on the TCBQ factors from the Brazilian sample.
1. Main effect of student gender: Female students would perceive their learning environments more positively than male students.
2. Main effect of type of school: Students in private schools would have more positive perceptions of TCBQ than public school students.
3. Main effect of subject matter: Biological science students would perceive their learning environments more positively than physical science students.
4. Main effect of teacher gender: Students would have more positive perceptions of female teachers than male teachers.
5. Interaction between student gender and teacher gender: Male students would have more positive perceptions of male teachers, while female students would have more positive perceptions of female teachers.
A structural equation model (SEM) was used to test these hypotheses, because it allows the estimation of the effects (and interactions) of the independent variables upon the latent constructs controlling for measurement error in the indicators.
Thus, in our model, each of the ive inter-correlated TCBQ
factors was predicted by student gender, type of school, sub-ject matter, teacher gender, and interaction between student gender and teacher gender. The equation for the SEM was:
γіј = λјкпік + Ɛіј
(1)
пік = ß0к + ß1к X1і+ ß2к X2і+ ß3к X3і+ ß4к X4і+ ß5к X1і X4і + ζік
where the irst equation is the measurement part of the model with terms as deined previously, and the second
indicates teacher gender, and the product term X1і X4і is the interaction between student gender and teacher gender. All of the predictors were included in the model as dummy-coded variables. The effect of these predictors on the TCBQ factors are shown in ß1к, ß2к , ß3к , ß4к, and ß5к. Analysis of the SEM model followed the same procedures and standards to the CFA presented previously.
Results
Factorial structure
A set of alternative models was tested ranging from a
one-factor solution to the hypothesized ive-factor solution.
Our criterion to create alternative models was to use the correlations between scales to create alternative groupings.
For instance, because “controlling” had low correlations with all other factors, the two-factor model isolated “controlling” and aggregated the other factors. The it of alternative models
to the data were not as strong as the hypothesized model
(Table 4). All other combinations of factors did not have a it
as good as the ive-factor model. The hypothesized ive-factor
CFA model had acceptable it to the data (χ2 = 502.094; df =
127; CFI = .91; TLI = .97; gamma hat = .96; RMSEA = .084). Hence, these results supported the argument that the
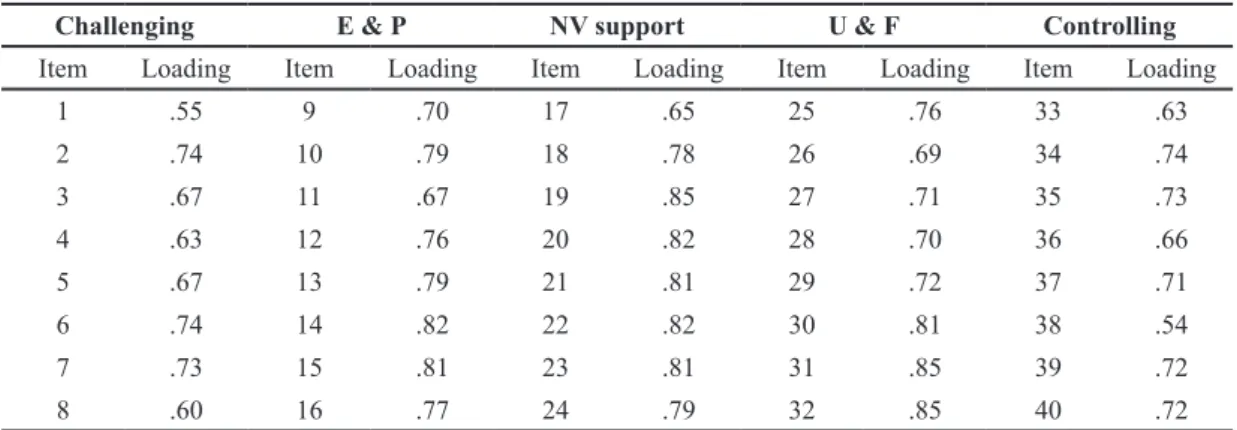
Brazilian TCBQ responses it closely to the original TCBQ ive-factor structure. The standardized factor loadings for all items of the ive-factor TCBQ are reported in Table 5, and
show that most items had high factor loadings.
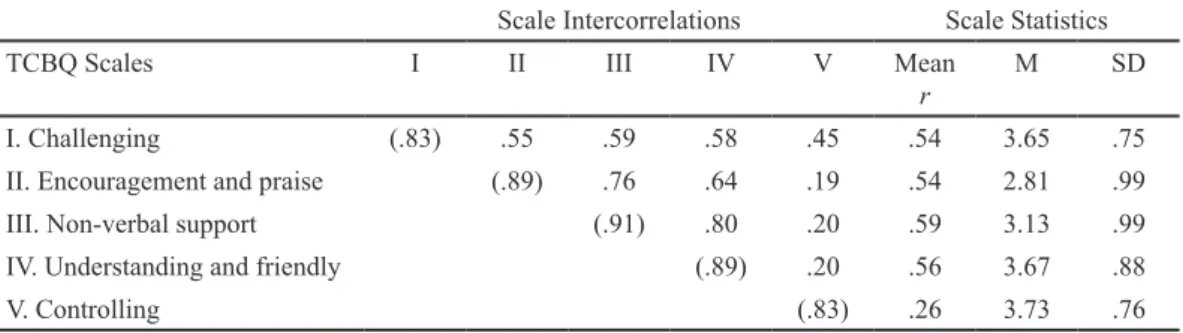
We estimated the factor inter-correlations for the
ive-factor solution (Table 6). The lowest correlation was between the “Controlling” and the “Encouragement and
Praise” factors. The highest correlations were between
the “Non-verbal support” and the “Understanding and Friendly” and “Encouragement and praise” factors. These
higher correlations indicate that teachers were perceived as providing encouragement and praise, being understanding and friendly, and using non-verbal behaviors.
On one hand, the factor “Non-verbal support” had high
correlations with two other factors and these correlations
were not as expected (i.e., they did not provide discriminant
Figure 1. Structural equation model of the effects of covariates on the factors measured
Models χ2 df CFI TLI Gamma hat RMSEA
1 factor 1975.254 121 .53 .83 .82 .192
2 factors 1049.067 117 .76 .91 .90 .139
3 factors 744.455 120 .84 .94 .93 .112
4 factors 806.945 123 .83 .94 .92 .116
5 factors 502.094 127 .91 .97 .96 .084
Table 4. Comparison of TCBQ CFA models
Note: all chi-square values statistically signiicant (p < . 0000).
Challenging E & P NV support U & F Controlling
Item Loading Item Loading Item Loading Item Loading Item Loading
1 .55 9 .70 17 .65 25 .76 33 .63
2 .74 10 .79 18 .78 26 .69 34 .74
3 .67 11 .67 19 .85 27 .71 35 .73
4 .63 12 .76 20 .82 28 .70 36 .66
5 .67 13 .79 21 .81 29 .72 37 .71
6 .74 14 .82 22 .82 30 .81 38 .54
7 .73 15 .81 23 .81 31 .85 39 .72
8 .60 16 .77 24 .79 32 .85 40 .72
Table 5. Standardized factor loadings of TCBQ items
Note. E & P = Encouragement and praise; NV support = non-verbal support; U & F = Understanding and friendly. evidence of the scores of Brazilian version of the TCBQ).
On the other hand, our CFA results supported the
multi-dimensionality of the ive-factor model; indeed, aggregating the factors “Non-verbal support”, “Understanding and Friendly”, and “Encouragement and praise” together (i.e., three-factors model, Table 4) gave worse it.
Furthermore, the Brazilian data seem to exhibit
inter-factor correlations similar in value and direction to those of previous international studies with the TCBQ. However, the other international studies provided only mean correlations. Thus, we cannot be sure if all the correlations are really in the same direction as those of the present study. The scale estimates of reliability (Table 6) were also close to values reported in previously published studies and similarly high for all scales.
Understanding science students’ evaluations of teacher communication behavior
The mean scores for the ive scales (Table 6) indicated that
the Brazilian science students in this study generally endorsed
three behaviors (i.e., “Challenging”, “Understanding and friendly” and “Controlling”). Agreement levels were very
similar (i.e., mean difference in agreement between scales
was d≤|.10|). In contrast, the students were either neutral
or negative to the two remaining teacher communication
behaviors (i.e., “Non-verbal support” and “Encouragement
and praise”). These scales were much more weakly endorsed than the first three scales (i.e., mean differences were d=.73). Clearly, from the student perspective, teachers were much more perceived as being challenging, controlling,
and understanding than they were seen as encouraging and praising.
The SEM had good it to the data (χ2 = 1164.645; df = 905;
CFI = .97; TLI = .96; RMSEA = .026). The results of the SEM
showed signiicant differences between public and private
schools on the Challenging scale (standardized β = 0.842,
p < .001), on the non-verbal support scale (standardized β
Scale Intercorrelations Scale Statistics
TCBQ Scales I II III IV V Mean
r
M SD
I. Challenging (.83) .55 .59 .58 .45 .54 3.65 .75
II. Encouragement and praise (.89) .76 .64 .19 .54 2.81 .99
III. Non-verbal support (.91) .80 .20 .59 3.13 .99
IV. Understanding and friendly (.89) .20 .56 3.67 .88
V. Controlling (.83) .26 3.73 .76
Table 6. Scale statistics and inter-correlations for the Brazilian TCBQ
Note: Cronbach alpha estimate of scale reliability displayed in brackets on diagonal of inter-correlation matrix; correlations estimated with Conirmatory Factor Analysis (CFA).
Discussion
The TCBQ has been recommended as a robust way of obtaining feedback that can contribute to improvement in classroom learning environments (She & Fisher, 2000) with successful studies in multiple languages at all levels of education in many different countries. The results of this
study support extending the use of the TCBQ to Brazil. CFA recovered the intended ive-factor solution with reasonable
inter-factor discrimination and strong scale reliability. Therefore, this study has broadened the international applicability of the TCBQ.
We found no difference between female and male students’ perceptions of their learning environments. This result differed from previous international studies which showed that girls tend to be more positive than boys (Fraser et al., 1995; Khine & Fisher, 2003; She & Fisher, 2002). From the perspective of teacher professional development, this is an encouraging result since schooling effectiveness ought not to depend on learner demographic characteristics. We found that students perceived that biological science teachers showed more controlling behaviors than physical science teachers. Thus, biological science students perceived their learning environments more positively than do physical science students (the higher the scores on factors, the more
positive is the perception). The controlling factor, speciically,
means that the teacher makes clear his/her instructions/rules and knows how to control and manage students’ behaviors in the classroom. This result reinforces previous international studies which show that biology teachers were more positively perceived than physics teachers (Özay et al., 2004;
She & Fisher, 2002). There are several possible explanations
for this subject matter difference. For instance, She (1998) reported that in Taiwan physical science tends to be perceived
as more abstract and dificult. On the contrary, the biology
content is considered more pertinent to the students’ daily lives and biology teaching seems to have a larger variety of approaches. Özay et al. (2004) reached similar conclusions in Turkey. Alternately, if biology is taken by academically
weaker students, teachers may need to exercise greater
control of classroom behavior than in classrooms where highly-able students self-regulate their learning. Hence, in Brazil, we speculate that our result may be more related to the challenges of managing the classroom, rather than to the
subject’s inherent dificulty. Further studies are needed to
test this speculation.
We also found that private school students perceived their teachers more favorably than did public school ones.
These groups had the largest differences identiied in this
study. The comparison between public and private schools
is relevant to the Brazilian context. With Brazil’s National
Evaluation System of Basic Education (from Portuguese, Sistema de Avaliação da Educação Básica - SAEB), the mean academic achievement scores of private school students are generally higher than that of public schools students. Although our study did not investigate the relation between learning environments and academic achievement in Brazil, it is possible that students of Brazilian private schools have more positive perceptions of their teacher communication behaviors than students of public schools because of their higher academic achievement.
Other studies have shown that the classroom learning environment variables predict students’ cognitive outcomes
(Fraser, 2002). For example, Frumkin and Murphy (2007),
using the TCBQ, reported a positive relationship between students’ perceptions of teacher communication behavior and
inal class grades. More speciically, higher inal grades were
received by students who perceived their teachers to be more challenging and controlling; a result consistent with other studies of high school students who valued teachers who provided challenging instruction (Irving, 2004). Likewise, among a New Zealand sample of high school students (Winheller, Hattie & Brown, 2013), higher ratings of teacher interest and quality predicted greater academic outcomes.
We found no differences between the students’ perceptions of their male and female science teachers (hypothesis 4) and no interaction between student gender and teacher gender (hypothesis 5). This contrasts to previous TCBQ studies which found higher ratings for teachers of the same gender as the students (Cirillo & Herbel-Eisenmann, 2006; Frumkin & Murphy, 2007). However, not enough research is available about the differences between teacher communication behaviors according to the gender of the teacher in Brazil. We could hypothesize that, conventionally, female teachers are considered more warm and supportive than their male counterparts. But our results do not support this interpretation. We consider that the results reported in this study with respect to student gender, teacher gender, type of school,
and subject might be explained by real-world structural
interactions occur quickly, making it dificult for teachers
and students to be aware of them (She & Fisher, 2000). The TCBQ can give teachers feedback that may help them recognize their own behaviors and contribute towards the development of positive classroom learning environments.
While this study found acceptable it of the data to the
TCBQ model and consistency with previous international studies, some improvements could yet be made. Improved
it of the TCBQ may be found with the use of alternative rating scales; for example, agreement ratings (i.e., giving
an indication of endorsement) may provide more precision than the current frequency (especially given weaknesses in human perception of frequency) scale of the TCBQ (Brown,
2004). Furthermore, given the existence of versions of the TCBQ in different languages, an important next step would
be to investigate the measurement invariance of the TCBQ’s items across countries (Byrne & Watkins, 2003; Meredith, 1993; Millsap, 2005). The establishment of measurement invariance or non-invariance of the TCBQ items would allow cross-cultural research and may shed light on further improvements to the TCBQ itself.
References
American Educational Research Association, American Psychological Association, & National Council on Measurement in Education (1999). Standards for educational and psychological testing. Washington, DC: American Educational Research Association.
Brown, G. T. L. (2004). Measuring attitude with positively packed self-report ratings: Comparison of agreement and frequency scales. Psychological Reports, 94(3), 1015-1024.
Byrne, B. M., & Watkins, D. (2003). The issue of measurement invariance revisited. Journal of Cross-Cultural Psychology,
34(2), 155-175.
Chen, H., Chang, W., & Chang, H. (2002). Different gender students’ perceptions of classroom climate in a trial of a teacher developed interdisciplinary module. Proceedings of the National Science Council, Republic of China - Part D:
Mathematics, Science and Technology Education, 12(3), 79-90. Cirillo, M., & Herbel-Eisenmann, B. (2006). Teacher communication behavior in the mathematics classroom. In S. Alatorre, J. L. Cortina, M. Sáiz, & A. Méndez (Eds.), Annual Meeting of the North American Chapter of the International Group for the Psychology of Mathematics Education: Vol. 2. (pp. 497-498).
Mérida, México: Universidad Pedagógica Nacional.
Dorman, J. (2002). Classroom environment research: Progress and possibilities. Queensland Journal of Educational Research,
18(2), 112-14.
Fagot, B. (1981). Male and female teachers: Do they treat boys and girls differently? Sex Roles, 7(3), 263-271.
Fan, X., & Sivo, S. A. (2007). Sensitivity of it indices to model misspeciication and model types. Multivariate Behavioral Research, 42(3), 509-529.
Fraser, B. J. (2002). Learning environments research: Yesterday, today and tomorrow. In S. C. Goh & M. S. Khine (Eds.),
Studies in educational learning environments: An international perspective (pp. 1-26). River Edge, NJ: World Scientiic.
Fraser, B. J., Giddings, G. J., & McRobbie, C. R. (1995). Evolution and validation of a personal form of an instrument for assessing science laboratory classroom environments. Journal of Research in Science Teaching, 32(4), 399-422.
Frumkin, L. (2006). Does increasing communication through visual learning environments enhance student perceptions of lecturers? International Education Journal, 7(5), 688-698. Frumkin, L., & Murphy, A. (2007). Student perceptions of lecturer
classroom communication style. European Journal of Social Sciences, 5(3), 45-60.
Hambleton, R. K., & Patsula, L. (1999). Increasing the validity of adapted tests: Myths to be avoided and guidelines for improving test adaptation practices. Journal of Applied Testing Technology, 1(1), 1-12.
Harkness, J. A., & Schoua-Glusberg, A. (1998). Questionnaires in translation. In J. A. Harkness, F. J. R. Van De Vijver, & P. P. Molher (Eds.), Cross-cultural survey methods (pp. 87- 127). Hoboken, NJ: John Wiley & Sons.
Hoyle, R. H., & Duvall, J. L. (2004). Determining the number
of factors in exploratory and conirmatory factor analysis.
In D. Kaplan (Ed.), The SAGE Handbook of Quantitative Methodology for Social Sciences (pp. 301-315). Thousand Oaks, CA: Sage.
Hu, L., & Bentler, P. M. (1999). Cutoff criteria for it indexes in
covariance structure analysis: Conventional criteria versus new alternatives. Structural Equation Modeling, 6(1), 1-55. Idiris, S. & Fraser, B. J. (1994, December). A study of learning
environments in agricultural science classrooms in Nigeria. Paper presented at the Annual Conference of the Australian Association for Research in Education (AARE), The University of Newcastle, New South Wales.
International Test Commission - ITC (2000a). International guidelines for test use. Retrieved from www.intestcom. org/ itc_projects.htm
International Test Commission - ITC (2000b). Test adaptation guidelines. Retrieved from www.intestcom.org/itc_projects. htm
Irving, S. E. (2004). The development and validation of a student evaluation instrument to identify highly accomplished mathematics teachers. (Unpublished doctoral dissertation). University of Auckland, Auckland.
Khine, M. S., & Fisher, D. L. (2003). Teacher-student interactions in science classrooms in Brunei. Journal of Classroom Interaction, 38(2), 21-28.
Marsh, H. W., Hau, K., & Grayson, D. (2005). Goodness of it in
structural equation models. In A. Maydeu-Olivares & J. J. McArdle (Eds.), Contemporary psychometrics: A festschrift for Roderick P. McDonald (pp. 275-340). Mahwah, NJ: Lawrence Erlbaum Associates.
Marsh, H. W., Hau, K.-T., & Wen, Z. (2004). In search of golden rules: Comment on hypothesis-testing approaches to setting
cutoff values for it indexes and dangers in overgeneralizing Hu and Bentler’s (1999) indings. Structural Equation Modeling,
11(3), 320-341.
Meredith, W. (1993). Measurement invariance, factor analysis and factorial invariance. Psychometrika, 58(4), 525-543.
Millsap, R. E. (2005). Four unresolved problems in studies of factorial invariance. In A. Maydeu-Olivares & J. J. McArdle (Eds.), Contemporary psychometrics: A festschirift for Roderick P. McDonald (pp. 153-171). Mahwah, NJ: Lawrence Erlbaum.
Muthén, L. K., & Muthén, B. O. (2006). Mplus (Version 4.2). Los Angeles, CA: Authors.
Özay, E., Kaya, E., & Sezek, F. (2004). Application of a questionnaire to describe teacher communication behaviour and its association with students in science in Turkey. Journal of Baltic Science Education, 2(6), 15-21.
Sebela, M. P. (2003). Using teacher action research to promote constructivist learning environments in mathematics classes in South Africa. (Unpublished doctoral dissertation). Curtin University of Technology, Bentley.
She, H. C. (1998). Interaction between different gender students and their teacher in junior high school biology classes. Journal of Proceedings of the National Science Council, Part D:
Mathematics, Science, and Technology Education, 8, 16–21. She, H. C. (1999). Students’ knowledge construction in small groups
in the 7th grade biology laboratory: Verbal communication and physical engagement. International Journal of Science Education, 21(10), 1051–1066.
She, H. C. (2000). The interplay of a biology teacher’s beliefs, teaching practices and gender-based student-teacher classroom interaction. Educational Research, 42(1), 100-111.
She, H. C. & Fisher, D. (2000). The development of a questionnaire to describe science teacher communication behavior in Taiwan and Australia. Science Education, 84(6), 706-726.
She, H. C., & Fisher, D. (2002). Teacher communication behavior and its association with students’ cognitive and attitudinal outcomes in science in Taiwan. Journal of Research in Science Teaching, 39(1), 63-78.
Stake, J., & Katz, J. (1982). Teacher-pupil relationships in the elementary school classroom: Teacher-gender and pupil-gender differences. American Educational Research Journal, 19(3), 465-471.
Stapleton, L. M. (2006). An assessment of practical solutions
for structural equation modeling with complex sample data.
Structural Equation Modeling, 13(1), 28-58.
Waldrip, B. G., & Fisher, D. L. (2000). The development and validation of a learning environment questionnaire using both quantitative and qualitative methods. Journal of Classroom Interaction, 35(2), 25-37.
Walker, S. L. (2004). Learning environment research: A review of the literature (Learning Environments Monograph No. 2). San
Marcos, TX: Texas State University. Retrieved from http:// uweb.txstate.edu/~sw36/monographs
Watzlawick, P., Beavin, J. H., & Jackson, D. D. (1991). Pragmática da comunicação humana: um estudo dos padrões, patologias e paradoxos da interação. São Paulo: Cultrix.
Winheller, S., Hattie, J. A., & Brown, G. T. L. (2013). Factors
inluencing early adolescents’ maths achievement: High quality
teaching rather than relationships. Learning Environments Research, 16(1), 49-69.
Wubbels, T., & Levy, J. (1991). A comparison of interpersonal behaviour of Dutch and American teachers. International
Journal of Intercultural Relations, 15(1), 1-18.
Wubbels, T., Levy, J., & Brekelmans, M. (1997). Paying attention to relationships. Educational Leadership, 54, 82-86.
Wubbels, T. & Brekelmans, M. (2005). Two decades of research on teacher–student relationships in class. International Journal of Educational Research, 43(1), 6–24.
Yilmaz Tüzün, O. (2006). Validation and use of Teacher Communication Behavior Questionnaire in Elementary Schools. Hacettepe University Journal of Education, 31, 234-243.
Recebido em 07.06.2013 Primeira decisão editorial em 10.09.2013
Versão inal em 17.10.2013
Appendix A
Scales and items from the English-version of the Teacher Communication Behavior Questionnaire (TCBQ), developed by She & Fisher (2000, 2002), and scales and items from the Portuguese-version of the TCBQ, adapted by Matos (2006).
English-version
Challenging
1. This teacher asks questions that require me to provide steps or ways of solving problems. 2. This teacher asks questions that make me think hard about things that I have learned in class. 3. This teacher asks questions that require me to carefully analyze information in order to answer. 4. This teacher asks questions that require me to use a judgment to answer.
5. This teacher asks questions that require me to apply what I have learned in class in order to answer. 6. This teacher asks questions that require me to integrate information that I have learned.
7. This teacher asks questions that require me to understand what I have learned in class in order to answer.
8. This teacher asks questions that require me to give explanations in my own words.
Encouragement and Praise
9. This teacher asks for my opinions during discussions.
10. This teacher encourages me to discuss the answers to questions. 11. This teacher encourages me to discuss my ideas with other students.
12. This teacher encourages me to express my opinions about a topic.
13. This teacher praises me for asking a good question. 14. This teacher praises my answers.
15. This teacher uses my ideas as part of the lesson.
16. This teacher uses my answer as part of the explanation of the lesson.
Non-Verbal Support
17. This teacher nods his/her head to show his/her understanding of my opinion.
18. This teacher nods his/her head to show support while I am struggling to answer a question.
19. Without speaking, this teacher indicates support for me through his/her facial expression.
20. Without speaking, this teacher supports me when I have a problem through his/her facial expression. 21. Without speaking, this teacher shows he/she understands my opinion through his/her facial expression. 22. Without speaking, this teacher shows his/her enthusiasm about my answer through his/her facial expression. 23. Without speaking, this teacher shows his/her enthusiasm about my question through his/her facial expression.
24. Without speaking, this teacher shows his/her support through his/her eyes.
Understanding and Friendly 25. This teacher trusts me.
26. This teacher is willing to explain things to me again.
27. If I have something to say, this teacher will listen. 28. This teacher realizes when I do not understand. 29. This teacher is patient with me.
30. This teacher is friendly to me.
31. This teacher is someone I can depend on. 32. This teacher cares about me.
Controlling
33. This teacher’s standards of behavior are very high.
34. This teacher expects me to obey his/her instructions.
35. This teacher insists that I follow his/her rules.
36. This teacher insists that I do everything(s) he/she tells me to do.
37. This teacher demands that I do exactly as I am told.
38. This teacher does not allow me to do things differently from what he/she expect.
39. This teacher makes very clear to me the standard of behavior expected of all students in this class.
Portuguese-version
Desaio
1. Esse(a) professor(a) faz perguntas que exigem que eu estabeleça passos ou maneiras de resolver problemas.
2. Esse(a) professor(a) faz perguntas que me fazem pensar com empenho sobre coisas que eu aprendi na aula.
3. Esse(a) professor(a) faz perguntas que exigem que eu analise a informação cuidadosamente para poder responder.
4. Esse(a) professor(a) faz perguntas que exigem que eu faça um julgamento sobre coisas que eu aprendi na aula para responder. 5. Esse(a) professor(a) faz perguntas que exigem que eu aplique o que eu aprendi na aula para poder responder.
6. Esse(a) professor(a) faz perguntas que exigem que eu incorpore a informação que eu aprendi.
7. Esse(a) professor(a) faz perguntas que exigem que eu entenda o que eu aprendi na aula para poder responder. 8. Esse(a) professor(a) faz perguntas que exigem que eu dê explicações com as minhas próprias palavras.
Encorajamento e elogio
9. Esse(a) professor(a) pede minhas opiniões durante as discussões.
10. Esse(a) professor(a) me encoraja a discutir as respostas para as perguntas. 11. Esse(a) professor(a) me encoraja a discutir minhas idéias com outros alunos.
12. Esse(a) professor(a) me encoraja a expressar minhas opiniões sobre um assunto.
13. Esse(a) professor(a) me elogia por fazer uma boa pergunta. 14. Esse(a) professor(a) elogia minhas respostas.
15. Esse(a) professor(a) usa minhas idéias como parte da aula.
16. Esse(a) professor(a) usa minhas respostas como parte da explicação da aula.
Apoio não-verbal
17. Esse(a) professor(a) balança sua cabeça em gesto airmativo para mostrar sua compreensão da minha opinião.
18. Esse(a) professor(a) balança sua cabeça em gesto airmativo para mostrar apoio enquanto eu estou me esforçando para responder uma
pergunta.
19. Sem falar, esse(a) professor(a) demonstra pela sua expressão facial que me apóia.
20. Sem falar, esse(a) professor(a) demonstra pela sua expressão facial que me apóia, quando eu tenho um problema. 21. Sem falar, esse(a) professor(a) demonstra pela sua expressão facial que ele/ela entende minhas opiniões. 22. Sem falar, esse(a) professor(a) demonstra pela sua expressão facial seu entusiasmo sobre minhas respostas. 23. Sem falar, esse(a) professor(a) demonstra pela sua expressão facial seu entusiasmo sobre minhas perguntas.
24. Sem falar, esse(a) professor(a) demonstra apoio através dos seus olhos.
Compreensão e relação amigável
25. Esse(a) professor(a) conia em mim.
26. Esse(a) professor(a) se dispõe a explicar coisas para mim de novo.
27. Esse(a) professor(a) vai escutar se eu tenho algo a dizer. 28. Esse(a) professor(a) percebe quando eu não entendo. 29. Esse(a) professor(a) é paciente comigo.
30. Esse(a) professor(a) é amigável comigo.
31. Esse(a) professor(a) é alguém com quem eu posso contar. 32. Esse(a) professor(a) se preocupa comigo.
Controle
33. Esse(a) professor(a) exige padrões de comportamento muito altos dos alunos.
34. Esse(a) professor(a) espera que eu obedeça suas instruções. 35. Esse(a) professor(a) insiste que eu siga suas regras.
36. Esse(a) professor(a) insiste que eu faça tudo que ele/ela me diz para fazer.
37. Esse(a) professor(a) exige que eu faça exatamente como me foi falado.
38. Esse(a) professor(a) não me permite fazer coisas diferentemente daquilo que ele/ela espera.