Radiol Bras. 2014 Set/Out;47(5):275–282 275
Application for internal dosimetry using biokinetic
distribution of photons based on nuclear medicine images
*
Aplicativo para dosimetria interna usando a distribuição biocinética de fótons baseada em imagens de medicina nuclear
Leal Neto V, Vieira JW, Lima FRA. Application for internal dosimetry using biokinetic distribution of photons based on nuclear medicine images. Radiol Bras. 2014 Set/Out;47(5):275–282.
Abstract
R e s u m o
Objective: This article presents a way to obtain estimates of dose in patients submitted to radiotherapy with basis on the analysis of regions of interest on nuclear medicine images.
Materials and Methods: A software called DoRadIo (Dosimetria das Radiações Ionizantes [Ionizing Radiation Dosimetry]) was developed to receive information about source organs and target organs, generating graphical and numerical results. The nuclear medicine images utilized in the present study were obtained from catalogs provided by medical physicists. The simulations were performed with computational exposure models consisting of voxel phantoms coupled with the Monte Carlo EGSnrc code. The software was developed with the Microsoft Visual Studio 2010 Service Pack and the project template Windows Presentation Foundation for C# programming language.
Results: With the mentioned tools, the authors obtained the file for optimization of Monte Carlo simulations using the EGSnrc; organization and compaction of dosimetry results with all radioactive sources; selection of regions of interest; evaluation of grayscale intensity in regions of interest; the file of weighted sources; and, finally, all the charts and numerical results.
Conclusion: The user interface may be adapted for use in clinical nuclear medicine as a computer-aided tool to estimate the administered activity.
Keywords: Nuclear medicine; Biokinetic distribution; Dosimetric evaluations; Administered activity.
Objetivo: Este artigo apresenta uma forma de se obterem estimativas de dose em pacientes submetidos a tratamentos radioterápicos a partir da análise das regiões de interesse em imagens de medicina nuclear.
Materiais e Métodos: Foi desenvolvido o software denominado DoRadIo (Dosimetria das Radiações Ionizantes), que recebe as infor-mações sobre os órgãos fontes e o órgão alvo e retorna resultados gráficos e numéricos. As imagens de medicina nuclear utilizadas foram obtidas de catálogos disponibilizados por físicos médicos. Nas simulações utilizaram-se modelos computacionais de exposição cons-tituídos por fantomas de voxels acoplados ao código Monte Carlo EGSnrc. O software foi desenvolvido no Microsoft Visual Studio 2010 com o modelo de projeto Windows Presentation Foundation e a linguagem de programação C#.
Resultados: Da aplicação das ferramentas foram obtidos: o arquivo para otimização das simulações Monte Carlo utilizando o EGSnrc, a organização e compactação dos resultados dosimétricos com todas as fontes, a seleção das regiões de interesse, a contagem da intensidade dos tons de cinza nas regiões de interesse, o arquivo das fontes ponderadas e, finalmente, todos os resultados gráficos e numéricos.
Conclusão: A interface de usuários pode ser adaptada para uso em clínicas de medicina nuclear como ferramenta computacional auxiliar na estimativa da atividade administrada.
Unitermos: Medicina nuclear; Distribuição biocinética; Avaliações dosimétricas; Atividade administrada.
* Study developed at Department of Nuclear Energy – Universidade Federal de Pernambuco (UFPE), Recife, PE, Brazil.
1. PhD, Teacher and Researcher at Instituto Federal de Educação, Ciência e Tecnologia de Pernambuco (IFPE), Recife, PE, Brazil.
2. PhD, Researcher, Member of the Department of Nuclear Energy Post-graduation Program – Universidade Federal de Pernambuco (UFPE), Teacher at Escola Politéc-nica de Pernambuco – Universidade de Pernambuco (UPE), Recife, PE, Brazil.
3. PhD, Researcher, Member of the Department of Nuclear Energy Post-graduation Program – Universidade Federal de Pernambuco (UFPE), Researcher at Centro Regio-nal de Ciências Nucleares (CRCN), Recife, PE, Brazil.
cal physicochemical characteristics determine its biokinet-ics, i.e., its fixation in the target organ, metabolization and elimination, while the physical characteristics of the radio-nuclide determine the application of the compound in the diagnosis or therapy.
Images from patients submitted to treatment with radio-active substances may be used to assess the distribution of the activity to be administered. The definition of amount of administered activity is generally under the responsibility of Viriato Leal Neto1, José Wilson Vieira2, Fernando Roberto de Andrade Lima3
Mailing Address: Dr. Viriato Leal Neto. Instituto Federal de Educação, Ciência e Tecnologia de Pernambuco. Avenida Professor Luís Freire, 500, Cidade Universitária. Recife, PE, Brazil, 50740-540. E-mail: [email protected].
Received March 13, 2013. Accepted after revision October 28, 2013. INTRODUCTION
radiopharmaceuti-Dosimetry of Ionizing Radiations) aimed at integrating the above mentioned tasks into a single computer-aided tool. Menus clearly demonstrate such tasks for data obtention and organization into tables and charts for further analysis. The current version of the software is intended for the use by dosimetry investigators. With the dosimetry data available at the current version, it is possible to interpolate results since the source is a monoenergetic gamma emitter. In such a case, the user should save the table of the absorbed dose per accu-mulated activity for the problem situation of interest. The user should only to choose the source organ, the target and select the data on the table with results related to the energy of interest. The interpolation must be made with another software. Also, it is possible to obtain results when the pho-tons are emitted from several source organs. The techniques that allow further dosimetry evaluations characterize the implemented innovations.
The DoRadIo software is an integral part of Sistema de Informações Dosimétricas (SID) (stands for Dosimetric In-formation System)(1) developed and maintained by the Grupo de Pesquisa em Dosimetria Numérica (GDN/CNPq), whose website is http://dosimetrianumerica.org/.
MATERIALS AND METHODS
The software was built within the Microsoft Visual Stu-dio 2010 with the project model WPF Application(2). Vari-ous tools were brought in from other GDN softwares, such as MonteCarlo(3) and Digital Image Processing (DIP)(4). As the MC simulations were restricted to gamma emitters, one resorted to EGSnrc (Electron Gamma Shower National Re-search Council)(5) code. The exposure computational model (ECM) MSTA (Mash STAnding)(6) provided by the Depart-ment of Nuclear Energy of Universidade Federal de Pernam-buco (DEN-UFPE), Recife, PE, Brazil, (www.caldose.org) was inserted in the user interface system. The ECM MSTA consists of a voxel phantom representing a male adult body coupled with EGSnrc. The MSTA user code comprises 13 source simulators for external dosimetry and one for inter-nal dosimetry, this particular one with 27 text files with data on sources recommended for medical practice. The MSTA
The Files (Arquivos) menu was developed to perform computer-aided tasks related to text files reading and writ-ing, as well as files compression and decompression. The menu items are shown on Figure 1.
a) Item Create ECM_DI.bat (Criar o MCE_DI.bat) This menu item is used to create the text file that opti-mizes the MC simulation. The produced file comprises data that allow the execution of all internal sources available for ECM MSTA. Each line in the file is an instruction to run via Windows Command Prompt, a ECM with a given file containing the data on the shock sections of the materials that make up the phantom used in the, and another file con-taining additional data.
b) Item Create DataFiles_DI.txt (Criar o ArquivoDados_ DI.txt)
The simulation generates several text files with specific dosimetry results. The menu item Criar o ArquivoDados_ DI.txt, shown on Figure 1, was developed to read such files and write them into a single file called DataFiles_DI.txt (ArquivosDados_DI.txt).
The reading and writing mechanisms of the text file in this activity as well as in other activities implemented at DoRadIo are in the classes FileStream, StreamWriter and StreamReader of namespaceSystem.IO, contained in the NET Framework(2)class library.
c) Item Compress/Decompress txt Files (Compactar/ Descompactar Arquivos txt)
The Digital Images Processing menu (Processamento de Imagens Digitais)
Digital Images Processing (Processamento de Imagens Digitais)is the second menu shown in the interface on Fig-ure 1. It comprises two menu items, as follows: one to se-lect and save a given region of interest (ROI) on an image, and another one to count the pixel intensity on the saved images. Such counts per ROI are used to weight dosimetry results when more than one source is used in the simulation. The ratio between the count on a given ROI and the total count on the image is used as a factor by which the dosim-etry values for each involved source should be multiplied. Each simulation is always monoenergetic, and the photons emerge from a single source organ.
At the beginning of each history simulation, the photon released position and its initial direction of travelling are uniform probability density functions within the parallelepi-ped containing the source organ, as in the MIRD (Medical Internal Radiation Dose) formulation(7). One of the advan-tages of performing the monoenergetic simulation and weighting the results is decreasing statistical errors, as all simulations are performed with the same number of histo-ries and the weighting is based on dosimetry results obtained with the plain sources.
The pixels’ intensity on the hot spots of an 8-bit nuclear medicine image reflects the activity distribution. Thus, by cumulatively counting the intensity on a given ROI, one obtains a number corresponding to the quantity of photons originated from that ROI. As the procedure is repeated, for all ROIs on the image, one obtains quantities which, divided by their sum, become factors that weight the quantities of photons originated from each ROI. The results of the ab-sorbed dose per accumulated activity that are entry data in the DoRadIo software were obtained as if such factors were equal to 1, i.e., each source organ was separately simulated. When there is more than one source organ involved in the simulation, the dosimetry results from the separate simula-tions of those organs are weighted by those factors.
a)Region of interest image acquisition
A ROI image is obtained by a logical operation AND involving a mask of defined dimensions over all the image pixels. Each output pixel results from the convolution of pixels defined on the region of the image with the same di-mensions of the mask by weights attributed to the operation AND (1 or true). Such an operation was implemented at DoRadIo by reading, at each point (x,y), the pixel intensity of the nuclear medicine image (a) and the corresponding intensity on a mask (b). The mask has the same dimensions as the image, with 0 pixel intensity at all locations except for the desired ROI, which is selected using the mouse. The value returned by the operation is a AND b, i.e., the result-ing image contains the mask background and the pixels lo-cated in the ROI on the nuclear medicine image(8).
b)The menu item Pixel Intensity Count on an Image (Conta Intensidade dos Pixels em uma Imagem)
The menu item Pixel Intensity Count on an Image (Conta Intensidade dos Pixels em uma Imagem) has a built-in tool that calculates the sum of the pixels’ intensities on an im-age. For this purpose, a C# function was developed, which receives an image with a single ROI and background filled by 0s (zeros). On a 256-bit vector of integer variables, the frequencies (y) of each gray shade on the image (x) are cu-mulatively counted. For frequencies different from 0, the function performs the convolution of the gray shade by the frequency. The result is given as the sum of the pixels’ in-tensities of the ROI contained on the entry image.
The present study results are presented below. A sequence that presents the main functionalities of the developed soft-ware was selected for the case of a hypothetical user interested not only in the dosimetry results, but also in how to prepare the data entry into the ECMs available at DEN-UFPE.
RESULTS
simulation
Among the available material on the ECM MSTA ma-terial (available at: www.caldose.org), there are 27 text files with data on the source organs most commonly used in the medical practice. Such standard files are prepared to execute a hypothetical 15-energy spectrum: 10, 15, 20, 30, 50, 60, 70, 80, 100, 200, 500, 1000, 1500, 2000, 4000 keV. Such energy interval comprises the photon emitting sources used in medicine. In the case user deals with an intermediate energy, he may interpolate the dosimetry results available in the application. Some adjustments were made in the files with the standard sources. The number of histories was es-tablished at 108
, independently of the energy and of the source organ; and the names of the exit files were customized.
When clicking on the item Create the ECM_DI.bat (Criar o MCE_DI.bat) of the Files (Arquivos) menu, the user can create a text file, the ECM_DI.bat, with data to execute the 27 plain sources. The simulation was triggered and took approximately 30 continuous days on a PC at LDN-IFPE. In this case each source were separately simulated, 27 user inputs would be necessary. Once the process was completed, 405 files (15 energies × 27 sources) with specific dosimetry results were obtained.
Data organization and compression
As the Create DataFiles_DI.txt (Criar ArquivosDados_ DI.txt) item of the Files (Arquivos) menu is triggered, the software reads the 405 files with specific dosimetry results obtained as described in the previous item, and organizes them into a single file called DataFiles_DI.txt (Arquivos Dados_DI.txt). Such file is used to obtain dosimetry results at a considered target: one source (Plain Sources) or N sources (Weighted Sources).
The file DataFiles_DI.txt (ArquivosDados_DI.txt) is relatively large (27,066 kB) to be added as a resource of the DoRadIo. By the Compress/Decompress txt Files ( Compac-tar/Descompactar Arquivos txt) itemof the Files (Arquivos) menu, the file was compressed to 8,721 kB, reducing the storage space by 67.8%. The compressed file was added as a resource and it is read and decompressed during execution by the software interfaces to present specific results.
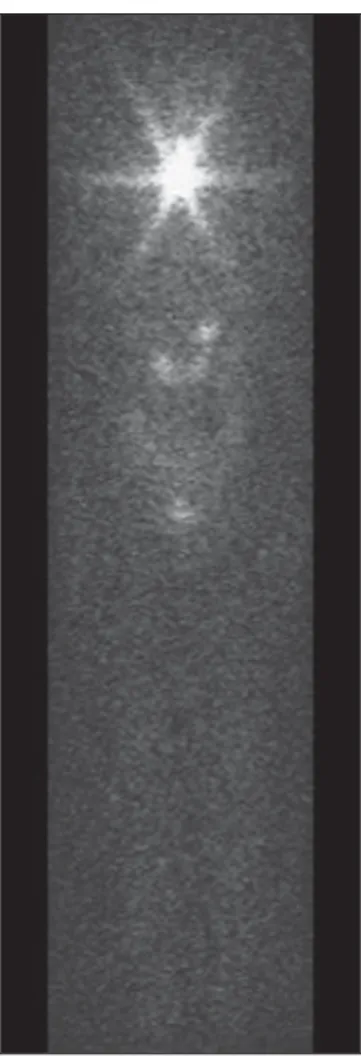
Step 2: An image is opened by clicking on (1) the inter-face. In the frame on the left, the image shown on Figure 2 is adjusted.
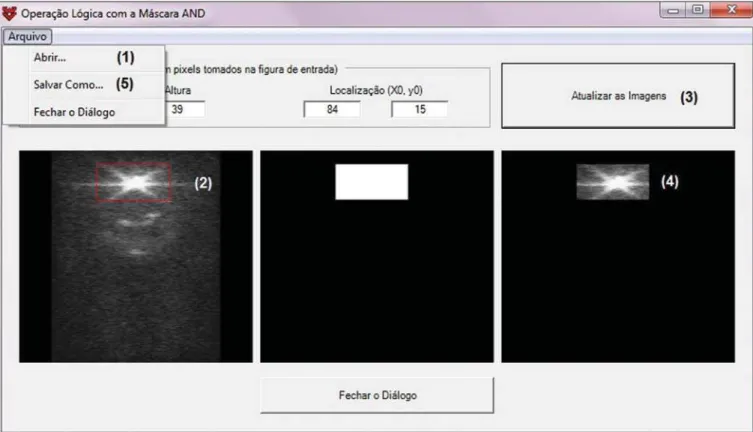
Step 3: The first ROI is selected (neck region) with a click on the left button of the mouse to select the upper left cor-ner of the ROI, and another click on the right button to se-lect the lower right corner in such a way to form a rectangle (2). The button (3) must be clicked in order to generate and/ or update the images from the mask and from the ROI (4). Step 4: Finally, one clicks on it (5) in order to save the images of the mask and of the ROI.
Step 5: Steps 1 to 4 are repeated to save other ROI images. On a single image, Figure 4 presents the results obtained with the application of the tool in the three regions with the respective saved images of the ROIs. The image on Figure 4 contains 0s (zeros) as background and gray shades in the intervals [0, 255] at the ROIs. By using the item Image Pix-els Intensity Count (Conta Intensidade de Pixels de uma Imagem) in the Digital Image Processing (Processamento de Imagens Digitais) menu one obtained a total of 3042, 1271 and 432 for the sum of pixels intensities for the thyroid, small bowel and bladder, respectively. Such values divided by their total sum were utilized as weighting factors for such sources. In order to obtain a realistic distribution of doses from photons coming from the three sources, such a count is in-dispensable, as the total intensities in the ROIs are propor-tional to the quantity of photons whose histories initiate at such regions. Thus, the ratios between the total intensities for each ROI, shown on Figure 4, and the total on the im-age are, respectively, the normalized weights of the simu-lated sources 0.641, 0.268 and 0.091. Such weights are ap-plied on the dosimetry data built in the software and the user can save the results in an external file.
Dosimetry results presentation and analysis
Figure 5 shows four menu items, where only ECM MSTA is enabled in the current release of DoRadIo. The items in this menu allow the display of dosimetry results from plain sources and the creation and display results from
weighted sources. Figure 4. Image of the ROIs selected on Figure 2.
Figure 5. The Dosimetry Results Analysis (Análise de Resultados Dosimétricos) menu and its sub-menus.
to create a file with the results from the action of more than one source organ on a target organ and to analyze them. As shown on Figure 5, such sub-item comprises two other items: Create DataFiles_MSTA_DI_FP.txt (Criar o ArquivoDados_ MSTA_DI_FP.txt) and Numerical and Graphical Results (Resultados Gráficos e Numéricos).
When the item Create DataFiles_MSTA_DI_FP.txt (Criar o ArquivoDados_MSTA_DI_FP.txt) was selected, the UI on Figure 7 was loaded, and the normalized weights ob-tained in the item Obtaining factors for a Weighted Source were entered. By clicking on the button Save DataFiles_MSTA_DI_FP.txt (Salvar ArquivosDados_ MSTA_DI_FP.txt) one saves a text file with the name of the caption. Such file contains the weighted dosimetry results for all available targets at MSTA and is used in the numeri-cal and graphinumeri-cal analysis.
By clicking on the item Numerical and Graphical Re-sults (Resultados Gráficos e Numéricos) shown on Figure 5, the software loads the interface on Figure 8, where it is pos-sible to select a target organ (for example, the liver). By click-ing on the button Dosimetry Results Table (Tabela com Resultados Dosimétricos) the table is shown with the conver-sion coefficients and coefficients of variance for the selected target organ. In the case user wishes to analyze the coefficient Figure 7. Interface for definition of source organs with their respective weights.
the simulation would be made for the three sources sepa-rately. Thus the total of 108
photons should be weighted between sources, with 6.41 × 10⁷
in the thyroid, 2.68 × 10⁷ in the small bowel, and 9.1 × 10⁶
in the bladder. In the present study, all simulations were performed with 108
his-tories. The weighting was applied to the dosimetry results. In a future study the accuracy of this approach will be dem-onstrated with the undertaking of separate simulations for thyroid, small bowel and bladder with the respective history numbers being drawn during the execution time. The com-parative analysis will be incorporated into DoRadIo. System errors originated from the ECMs used by GDN/CNPq, which may compromise the accuracy of dosimetry results are constantly being detected and corrected or minimized.
An important point that can be improved in the DoRadIo is the determination of the ROIs on nuclear medicine im-ages. Besides the mouse resources, the user could evaluate a threshold gray shade for the contour of the ROIs and the software would, automatically, load as a standard the ROIs limited by such threshold. Subsequent adjustments would be made by the user.
CONCLUSIONS
The present study presents the first version of the DoRadIo software, which provides:
zantes. [Tese de doutorado]. Recife: Universidade Federal de Per-nambuco; 2013.
2. Sharp J. Visual C# 2010 step by step. 1ª ed. Washington: Microsoft Press; 2010.
3. Vieira JW, Leal Neto V, Lima Filho JM, et al. Transformation of the normal distribution for Monte Carlo modeling of regions of adult trabecular bones for use in computational models of expo-sure. 13th International Congress of International Radiation Pro-tection Association; 2012 May 13–18; Glasgow, Scotland. 4. Vieira JW, Lima FRA. A software to digital image processing to be
used in the voxel phantom development. Cell Mol Biol (Noisy-le-grand). 2009;55:16–22.
5. Kawrakow I, Rogers DWO, Mainegra-Hing E, et al. The EGSnrc Code System: Monte Carlo simulation of electron and photon trans-port. Report No. PIRS-701. Ottawa, Canada: National Research Council Canada; 2011.
6. Cassola VF. Desenvolvimento de fantomas humanos computacio-nais usando malhas poligocomputacio-nais em função da postura, massa e altura. [Tese de doutorado]. Recife: Universidade Federal de Pernambuco; 2011.
7. Zaidi H, Sgouros G. Therapeutic applications of Monte Carlo cal-culations in nuclear medicine. 1ª ed. Bristol: IOP Publishing; 2003. 8. Gonzalez RC, Woods RE. Digital image processing. 3ª ed. New
Jersey: Prentice Hall; 2008.
9. Lopes Filho FJ. Avaliações dosimétricas em pacientes submetidos à radioiodoterapia com base em fantomas de voxels e em imagens de medicina nuclear. [Tese de doutorado]. Recife: Universidade Fede-ral de Pernambuco; 2007.